Assessment of the Mercury Content in Coal fed to Power Plants and study of Mercury Emissions from the Sector in India
←
→
Page content transcription
If your browser does not render page correctly, please read the page content below
Assessment of the Mercury Content in Coal
 fed to Power Plants and study of Mercury
    Emissions from the Sector in India

                     Report Prepared by:

      Central Institute of Mining & Fuel Research (CIMFR)
         (Council of Scientific & Industrial Research)
             Department of Science & Technology
                           Dhanbad, India
                          (February 2014)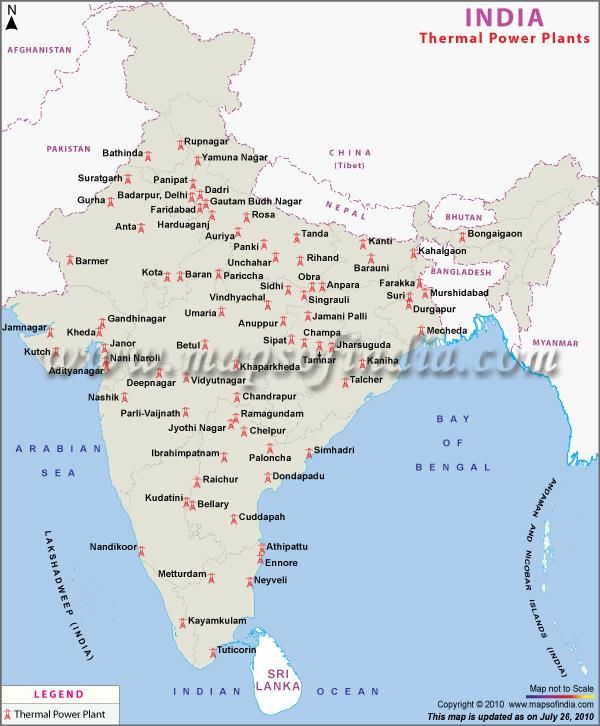
2
Assessment of the Mercury Content in Coal
    fed to Power Plants and study of Mercury
       Emissions from the Sector in India

                       A report from
the Mercury Control from Coal Combustion Partnership Area
         of the UNEP Global Mercury Partnership

                                                        3
Copyright © United Nations Environment Programme, 2014
Citation: UNEP, 2014. Assessment of the Mercury Content in Coal fed to Power Plant and study of
Mercury Emissions from the Sector in India. UNEP Chemicals Branch, Geneva, Switzerland
This is a report from the Mercury Control from Coal Combustion Partnership Area of the UNEP
Global Mercury Partnership
Disclaimer
The designations employed and the presentation of the material in this publication do not imply the
expression of any opinion whatsoever on the part of the United Nations Environment Programme or
the Government of the India concerning the legal status of any country, territory, city or area or of
its authorities, or concerning delimitation of its frontiers or boundaries. Moreover, the views
expressed do not necessarily represent the decision or the stated policy of the United Nations
Environment Programme or the Government of India, nor does citing of trade names or commercial
processes constitute endorsement.
Reproduction
This publication may be produced in whole or in part and in any form for educational or non-profit
purposes without special permission from VTI or UNEP, provided acknowledgement of the source
is made. Material in this report can be freely quoted or reprinted. UNEP and VTI would appreciate
receiving a copy of any publication that uses this report as a source.
No use of this publication may be made for resale or for any other commercial purpose whatsoever
without prior permission in writing from the United Nations Environment Programme.
Funding
The work was funded by the European Union.
Production
Based on the agreement between the United Nations Environment Programme (UNEP), Division of
Technology, Industry and Economics (DTIE), Chemicals Branch and Central Institute of Mining &
Fuel Research (CIMFR) (Council of Scientific & Industrial Research), CIMFR has undertaken the
project entitled: “Assessment of the Mercury Content in Coal fed to Power Plant and study of
Mercury Emissions from the Sector in India ”.
The report can be found on UNEP Chemicals Branch website:
http://www.unep.org/hazardoussubstances/Mercury/PrioritiesforAction/Coalcombustion/Reports/ta
bid/4492/language/en-US/Default.aspx
Acknowledgements
This work was performed under an agreement between UNEP, DTIE Chemicals Branch, Geneva,
Switzerland, and The Ministry of Environment and Forests of India and CIMFR. The project
partners deeply appreciate the administrative, technical and expert assistance of the following
institutions and individuals:
4(i) Mr. Tarit Baran Das, Sr. Principal Scientist and Mr. Ashim Choudhury, Chief Scientist &
Head of Power Coal Division of Central Institute of Mining and Fuel Research (CSIR-
CIMFR);
(ii) Central Electricity Authority, Ministry of Power, Government of India, for providing
information on Indian thermal power sector and facilitating coal sample collection and
emission studies at the power plants;
(iii) National Thermal Power Corporation (NTPC), a public sector power company, for
facilitating coal sample collection from the power plants and providing assistance for
conducting emission studies at NTPC power plant and allowing the use of data from an
earlier study;
(iv) Members of the working group constituted by MoEF comprising the major stake holders of
the power sector, coal sector, environmental research institutes, regulatory bodies for
proving guidance and support to facilitate proper execution of the programme;
(v) All the power stations and coal washeries for facilitating the coal sample collections from
their respective plants;
(vi) Dr. Manoranjan Hota, Director, Shri R.N.Jindal, Addl. Director,Dr. R. B. Lal, Deputy
Director, Dr. M. Ramesh, Deputy Director , Dr Shruti Rai Bhardwaj, Deputy Director and
Ms. Amrita Gupta, RA Ministry of Environment and Forests, New Delhi;
(vii) Dr. P. Chakraborty, Scientist, National Institute of Oceanography, Vishakhapatnam;
(viii) Mr. Gunnar Futsaeter, UNEP Chemicals Branch, DTIE; and
(ix) Dr. Wojciech Jozewicz, ARCADIS Inc.
5Acronyms and Abbreviations
A : Ash
APCD : Air Pollution Control Device
ASTM : American Standard for Testing Materials
BCCL : Bharat Coking Coal Limited
CCL : Central Coalfields Limited
CEA : Central Electricity Authority
CESC : Calcutta Electric Supply Corporation
CIL : Coal India Limited
CIMFR : Central Institute of Mining and Fuel Research
CMPDI : Central Mine Planning & Design Institute
CSIR : Council of Scientific and Industrial Research
ECL : Eastern Coalfields Limited
ESP : Electrostatic Precipitator
FC : Fixed carbon
FGD : Flue Gas Desulphurization
GCV : Gross Calorific Value
g/t : gramme per tonne
GoI : Government of India
ISO : International Standard Organization
JSPL : Jindal Steel and Power Limited
kcal/kg : kilocalories per kilogramme
kWh : kilowatt hour
MCL : Mahanadi Coalfields Limited
mg/kg : milligramme per kilogramme
mg/m3 : milligramme per cubic metre
M : moisture
MoEF : Ministry of Environment and Forests
Mt : million tonne
mta : million tonne per annum
MW : megawatt
NCL : Northern Coalfields Limited
NTPC : National Thermal Power Corporation
ng : nanogramme
NOX : Oxides of nitrogen
POG : Process Optimization Guidance
SCCL : Singerani Collieries Company Limited
SECL : South Eastern Coalfields Limited
SPM : suspended particulate matter
ppm : parts per million
SO2 : Sulphur dioxide
TPS : Thermal power station
µg/Nm3 : microgramme per normal cubic metre
UNEP : United Nations Environment Programme
US EPA : United States Environmental Protection Agency
VM : Volatile matter
WBPDCL : West Bengal Power Development Corporation Limited
WCL : Western Coalfields Limited
6CONTENTS page no.
Executive Summary 9
1.0 Introduction 10
1.1 Project Objectives 10
1.2 Major Tasks of the study 11
1.3 Deliverables 12
2.0 Overview of Indian coal sector 13
2.1 Characteristics of Indian coals 13
2.2 Coal reserves of India 13
2.3 Pattern of coal consumption 16
2.4 Coal Washeries 17
3.0 Power Generation Sector in India 18
3.1 Installed generation capacity of electricity 18
3.2 Coal fired power plant in India 21
3.3 Air pollution control equipment in the power plants 23
4.0 Present study 23
4.1 Coal analysis 23
4.2 Mercury emissions measurement in power plants 25
4.3 Previous study at NTPC coal based power plants 27
4.4 Washery samples 28
4.5 Inter-calibration of analyses on selected coal samples 28
5.0 Mercury Emission factor and Emission Inventory 30
5.1 Partitioning of Mercury and Mercury Speciation 32
5.2 Future Mercury Emissions Estimate 32
6.0 Global Inventory of Mercury in coal and Mercury emissions 33
7.0 References 35
LIST OF FIGURES
Figure 1: Reserves of coal and lignite 15
Figure 2: Coal consumption profile of 2008-09 16
Figure 3: Primary energy sources in India 20
Figure 4: Installed electricity generation capacity in India 20
Figure 5: Coal consumption in the power sector 22
Figure 6: Share of indigenous, imported & washed coal in power sector 22
Figure 7: Mercury in Feed coals and emission from the thermal power stations 31
7LIST OF MAPS
Map 1 : Location of the major coal reserves 15
Map 2 : Location of the Thermal Power Plants 19
LIST OF TABLES
Table 1 : Variability of coal quality of the major sources 14
Table 2 : Installed capacity of major non-coking coal washeries in India 17
Table 3 : Boiler unit sizes and installed power plant capacity 21
Table 4 : Unit size wise electricity generation 21
Table 5 : The methods adopted for collecting, preparing and analyzing samples 24
Table 6 : Quality parameters of the coals fed to Power Plants 25
Table 7 : Major and minor elements in coal 25
Table 8 : Mercury content of the feed coal to power plants 26
Table 9 : Mercury concentrations in flue gas samples and other combustion
Products 27
Table 10 : Distribution of Mercury in Flue Gas and other Combustion
Products at NTPC coal based power plants 27
Table 11 : Distribution of Mercury in the Washery products 28
Table 12 : Certified mercury concentrations of reference coal samples 29
Table 13 : Method adopted and instrument used by the laboratories 29
Table 14 : Inter laboratory variability of mercury concentrations 29
Table 15 : Projected estimates of Mercury Emissions from Power sector 32
Table 16 : Mercury contents in raw coals across the world 33
Table 17 : Mercury emission inventory of ten countries 34
Table 18 : Global mercury emission inventory 34
8Executive Summary
Under the Small Scale Funding Agreement between United Nations Environmental
Programme (UNEP), Ministry of Environment and Forests, Government of India (MoEF) and
Central Institute of Mining and Fuel Research (CSIR-CIMFR), the project entitled
“Characterization of the coal fired power sector in India, assessment of the mercury contents in coal
fed to power plants and calculation of mercury emissions from the Sector” was undertaken. MoEF
as the National Project Manager and Coordinator for the project had the overall responsibility for
the implementation of the activities of the project. CSIR-CIMFR was the executing agency for
implementation of the project.
Information was collected on coal consumed in power plants in India by coal source from
2003 to 2011. Information has been provided on existing commercial non-coking coal washeries in
the country supplying coal to the power plants. Coal samples collected from power plants cover the
major coal fields of India. The samples were characterized for proximate, ultimate analyses,
mercury (Hg), arsenic (As), selenium (Se), chlorine (Cl), calcium (Ca), and sodium (Na) content.
Coal samples from five major non-coking coal washeries were collected and analyzed for mercury.
This report presents Indian power sector information which includes locations of major coal
based power plants, installed power plant capacity and electricity generation by coal combustion in
2010 and projections for 2020 and also the status of air pollution control at power plants. The report
also presents an inventory of mercury emissions from the coal based power sector and mercury
emission projections. The mercury content estimated from the results of the sixty six samples
studied varied from 0.003-0.34 g/tonne with the mean value being 0.14 g/tonne. Salient findings of
this report indicate that the mercury emissions from coal-fired power generation are estimated at
38.54 metric tonnes/annum for 2008 using the default ODF of 0.9. Future mercury emissions have
been estimated based on the projected coal consumption without taking into consideration future
mercury emission reduction measures. Assessment of the reduction potential of mercury content of
coal through washing has been made after conducting studies at five non coking coal washeries.
The reduction of mercury content in the clean product of the washeries varied between 13.1% to
39.8%.
Mercury concentration in flue gas was measured in three power plants. The three power
plants are NTPC, Talcher (Odisha), Korba (west), Chhattisgarh, and Budge Budge, West Bengal.
The average mercury concentration in the flue gas at the outlet of ESP of the three power stations
was 14.84, 11.50 and 4.24 μg/Nm3 respectively. Significant portion of mercury present in feed coal
have been found to be associated with fly ash.
The results mentioned in the report are indicative in nature. It may be noted that sample size
is small for emission study. Rigorous sampling of Indian coal is required to make it a representative
study. Based on archive data and data collected through present study, the output distribution
factor (ODF) varies between 0.27 to 0.81 as per estimates. The mean value of ODF for Mercury in
Indian coal would be 0.58 in place of default value of 0.9 as per UNEP tool kit.
--x--
91.0 Introduction
Emissions of mercury from thermal power stations are a subject of increasing concern because
of its toxicity, volatility, persistence, long range transport in the atmosphere. Mercury has the
tendency for bioaccumulation as methyl mercury and thus enters into the food chain. Once released
into the environment, mercury contaminates soil, air, surface and ground water. Mercury is a
neurotoxin and exhibits adverse health effects. Mercury is a global pollutant that is emitted,
deposited, and reemitted on both a local and global scale in both terrestrial and marine
environments.
The mercury emitted from coal-fired power plants originates from the mercury present in the
coal. Typically, mercury is present in the coal in the tens of parts-per-billion range. Burning of
enormous quantity of coal for power generation makes it the largest anthropogenic source of
mercury emissions at global level.
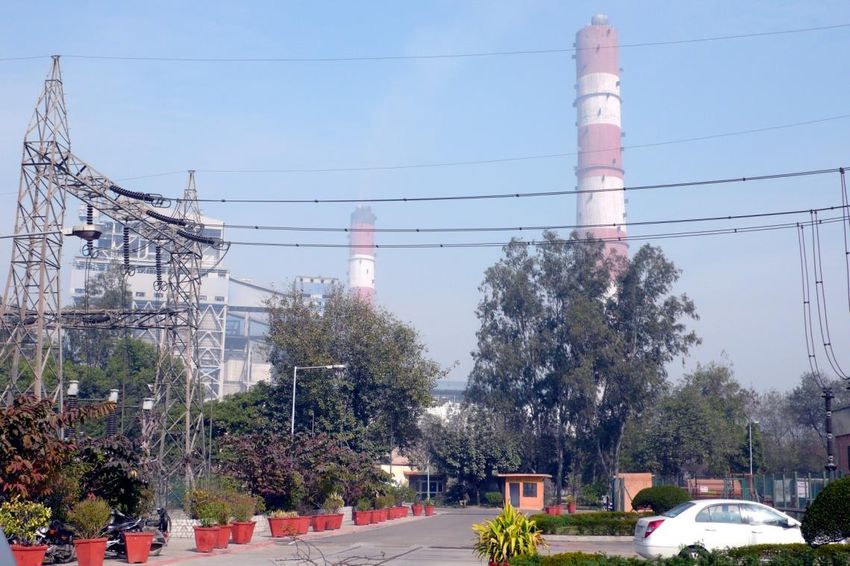
India ranks third in world coal production after USA and China. The majority of the coal
production, approximately 70%, is used for thermal power generation. Coal combustion is the major
source of anthropogenic mercury emissions in India.
Ministry of Environment & Forests, UNEP and CSIR-CIMFR have entered into a Small Scale
Funding Agreement (SSFA) to undertake a project titled “Characterization of the coal fired power
sector in India, assessment of the mercury contents in coal fed to power plants and calculation of
mercury emissions from the Sector”. In accordance with UNEP Governing Council priorities
identified in Decisions 24/3 and 25/5 and with the goal of the reduction of mercury emissions from
coal partnership area under the UNEP Global Mercury Partnership, the project aims to present
national information on coal types and coal usage, characterize coal-fired power sector in India and
develop an emission inventory for the coal fired energy sector and present other relevant
information to improve accuracy of future emission inventories for the sector.
1.1 Project Objectives
The project has the followings objective:
(i) Assessment of Mercury content of coal fed to coal fired power plants;
(ii) Direct measurement of the emissions of mercury from the flue gas of selected power
plants based on the capacity, vintage, fuel types, emission control systems, including
the partitioning and speciation of mercury in the combustion products;
(iii) Estimation of the Mercury emission factors based on the information gained during this
project and comparison with relevant published emission factors; and
(iv) Calculation of mercury emissions from the coal fired power sector in India based on
developed emissions factors.
101.2 Major tasks of the study:
Task 1.Coal information
(i) Collection of information on the amount of coal consumed (for electricity
production) by coal source, available information on coal analysis (including Hg, As,
Se, Cl, Br, Ca, and Na content);
(ii) Collection of available information (or estimation) on the coal consumption
(projected coal use) for electricity generation for the target years 2020;
(iii) Collection and chemical analysis of samples of coal from power plants to broadly
cover coals from the major coalfields of India. Parameters for analyses include
proximate, ultimate and determination of mercury, arsenic, selenium, sodium,
calcium and chlorine content following relevant national and international Standards;
(iv) Collection and analyses of washery samples (feed coals and products); and
(v) Inter-calibration of analyses to be carried out on selected coal samples.
Task 2. Power plant information:
(i) Collection of national and provincial information on installed power plant capacity
and electricity generation by coal combustion in 2008, including the approximate
of power plants;
(ii) Collection of national and provincial information on air pollution control configuration
and its typical operational efficiency;
(iii)Collection of national and provincial information on any available results of
measurements of mercury emissions from power plants; and
(iv) Mercury emission measurements at selected power plants: Direct measurements of
emissions in three coal based power plants adopting international accredited
methods (flue gas measurements Ontario Hydro Method-ASTM D6784-02).
Measurements to be carried out on one boiler unit (500 MW/200MW series) in each
power plant.
In summary, the work at these power plants includes:
Measurement of mercury concentration in flue gas;
Measurement of Suspended Particulate Matter (SPM) concentration in the flue
gas; and
Assessment of the partitioning of mercury in different combustion pathways and
also mercury speciation (particulate, elemental and oxidized) in flue gas.
Task 3. Mercury emission inventories and future estimates
i) Develop mercury emission factors based on data sets from selected power plants;
ii) The emission inventories will be shared by a network of experts and stakeholders
for comments; and
11iii) Develop future mercury emission estimates (scenario for 2020).
Task 4. Information seminar
An information seminar, including a workshop on the “Process Optimization
Guidance for Reducing Mercury Emissions from Coal Combustion in Power Plants (POG)”
to be organized by CSIR-CIMFR to disseminate information to relevant stakeholders
(policymakers, administrative staff in the power plant sector)
1.3 Deliverables
a) Mercury emission factors (g/tonnes) of the studied coals;
b) Mercury emissions (gaseous and particulates) from the coal-fired power plants in India and
speciation of mercury species in the flue gas;
c) Mercury concentrations in other combustion products (Fly ash, Bottom ash) of the power
plants; and
d) A technical report presenting results.
122.0 Overview of Indian coal sector
2.1 Characteristics of Indian coal
Coal, in general and Indian coal of Gondwana origin in particular, is heterogeneous in
nature. The term Gondwana originally denoted a geological system comprising a great succession
of mainly fresh water sediments in the stratigraphy of the Indian subcontinent. The characteristics of
these coals influenced by the origin and mode of formation are dissimilar to that of the coals of
Northern Hemisphere in some respects.
The physico-chemical characteristics of Indian Gondwana coals of Permian period (210-270
million years) are different from the carboniferous coals (deposited 50-100 million years earlier
than Gondwana coals) mainly due to the environment of deposition and post depositional features.
This difference is significantly reflected in the composition of the petrographic constituents such as
vitrinite, exinite and inertinite present in the coals. As most of the coals were deposited under
oxidising condition they are poor in vitrinite (between 20-45%) and rich in inertinite (sometimes as
high as 70%) with low content of exinite. Because of their low vitrinite content, Gondwana coals
are comparatively low in hydrogen and high in nitrogen. The substantial proportions of low
reflecting micro-components of inertinite group (mainly semi-fusinite and fusinite) with their
relatively greater porosity allow higher “in-situ” moisture retention and result in lesser heating
values. Most of India's coal is characterised by high ash content, but the coals has other useful
qualities such as low sulphur content (generally 0.5%), low iron content in ash, high fusion
characteristics of ash and low chloride content.
The volatile matter of the Gondwana coals, compared to carboniferous coals of the same
maturity, is relatively low due to low vitrinite content. Although most of the Gondwana coals
reached the bituminous stage, the majority falls at the lower end of this class (mean reflectance
about 0.6%) ideally suitable for combustion purpose. Another typical feature is the relatively high
proportion of inter grown mineral matter besides inter banded stone layers. An indication of the
variability of quality parameters of the major thermal coal resources of the country, based on
available data at CSIR-CIMFR are given in Table 1.
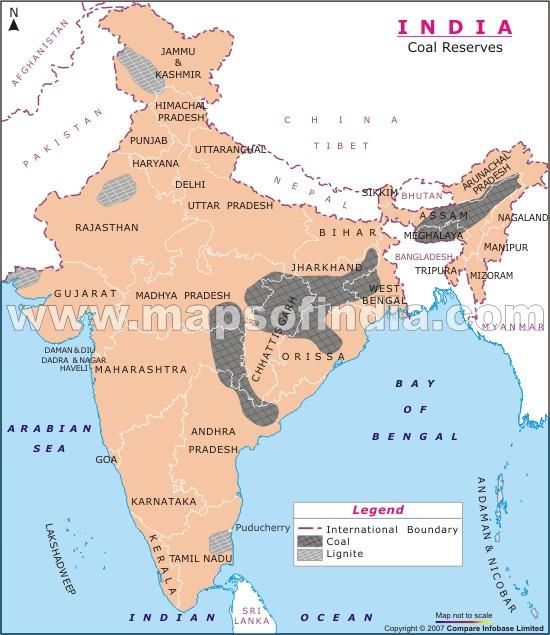
2.2 Coal reserves
India having good reserve of coal and lignite stands eighth in the world in terms of estimated
coal reserves and third in terms of volume of production. About 90% coals are of Permian
Gondowana formation. South Africa, South America, Australia also has coal reserves formed in the
same era. Coal deposits are mainly confined to eastern and south central parts of the country (see
Map 1). The states of Jharkhand, Orissa, Chhattisgarh, West Bengal, Andhra Pradesh, Maharashtra
and Madhya Pradesh account for more than 99% of the total coal reserves in the country. About
88% of the total coal production in the country is produced by Coal India Ltd. (CIL) which is the
largest producer of coal in the country. CIL has seven coal producing subsidiary companies; viz.
Central Coalfields (CCL), Eastern Coalfields (ECL), Bharat Coking Coal (BCCL), Northern
Coalfields (NCL), Western Coalfields (WCL), Southern Eastern Coalfields (SECL), Mahanadi
Coalfields (MCL) and the Central Mine Planning and Design Institute Limited (CMPDIL), which is
entrusted with the job of providing total research and consultancy support to the industry. The only
other major producer outside of CIL is the Singerani Collieries Company (SCCL) that is located in
Andhra Pradesh. The locations of the major reserves of the Indian coals are shown in Map 1.
13Table 1: Variability of coal quality of the major sources
Coal Field M A VM FC GCV C H S N CaO Na2O Pb As Hg
Weight % Kcal/k Weight % Weight % mg/kg
g in ash
Air Dried Basis
Min 0.8 23.5 15.7 26.0 3280 34.8 2.3 0.24 0.00 0.03 0.20 12.40 2.40 0.08
Central
Max 8.4 46.5 29.8 43.1 5635 57.7 3.7 0.60 1.60 4.21 0.78 42.20 9.20 0.36
Coalfields
Limited Average 4.6 35.4 25.2 35.3 4438 46.6 3.0 0.48 0.99 1.63 0.40 26.62 4.06 0.20
Min 2.5 32.4 20.8 21.3 2585 28.9 2.3 0.18 0.56 0.11 0.17 22.50 0.90 0.12
Mahanadi
Max 8.3 52.8 28.7 37.5 4460 47.5 3.4 0.87 1.10 1.47 0.61 52.50 3.50 0.29
Coalfields
Limited Average 5.9 40.1 25.0 29.0 3779 40.3 2.9 0.46 0.82 0.82 0.29 38.50 2.45 0.20
Min 5.2 17.4 22.5 25.4 3541 38.8 2.8 0.00 0.57 0.11 0.13 17.90 0.60 0.08
Northern
Max 10.0 42.4 30.0 45.4 5545 60.0 3.9 0.51 1.12 1.99 1.80 38.70 9.70 0.49
Coalfields
Limited Average 7.1 31.5 27.0 34.5 4437 47.1 3.3 0.37 0.87 0.83 0.71 28.49 3.64 0.21
Singareni Min 4.5 17.1 20.8 27.6 3311 35.6 2.0 0.30 0.80 0.49 0.27 22.40 2.30 0.08
Colliery
Max 8.9 46.5 29.5 50.2 5681 60.5 3.3 2.20 1.20 7.01 0.44 41.40 6.60 0.22
company
Limited Average 6.6 33.5 25.0 34.9 4444 46.5 2.7 1.00 1.02 2.86 0.33 32.08 4.47 0.14
Min 1.5 18.9 13.7 16.9 2104 23.0 1.2 0.30 0.50 0.29 0.20 10.10 1.80 0.05
Western
Max 9.1 60.8 29.7 43.3 5379 55.1 3.5 2.20 1.20 3.29 0.70 48.80 8.90 0.40
Coalfields
Limited Average 6.6 34.5 24.3 34.7 4323 45.1 2.6 0.98 0.96 1.53 0.33 30.67 5.35 0.21
South Min 2.2 15.0 20.8 27.8 3555 36.6 2.2 0.70 0.20 0.14 0.13 12.20 2.30 0.06
Eastern Max 9.1 43.2 27.8 52.8 6345 63.1 3.7 1.30 1.40 6.46 2.76 36.30 10.50 0.31
Coalfields
Limited Average 6.2 25.4 24.4 44.0 5318 54.4 3.0 1.09 0.70 1.32 1.11 20.27 5.28 0.14
( M=Moisture; A=Ash; VM=Volatile Matter; FC=Fixed Carbon; C=Carbon; H=Hydrogen;
N=Nitrogen; S=Sulphur; GCV=Gross Calorific Value)
The total estimated reserve of coal in India as on 31.03.2010 was around 277 billion tonnes
and that of lignite was 40 billion tonnes (Figure 1), of which 80% was in the southern State of
Tamil Nadu. Other states with lignite deposits are Gujarat, Jammu and Kashmir, Rajasthan, Kerala,
and the union territory of Pondicherry.
14Map 1: Locations of the Major Coal Reserves (not to scale)
Figure 1- Reserves of coal and lignite
152.3 Pattern of Coal Consumption
Coal is the dominant energy source in India, accounting for more than half of the country's
requirements. 70% of India's coal production is used for power generation, with the remainder being
used by heavy industry and public use. Domestic supplies satisfy most of India's coal demand. The
estimated total consumption of raw coal by industry, including power sector, has increased from
71.2 million tonnes during 1970-71 to 586.07 million tonnes during 2009-10. Consumption of
lignite increased from 3.39 million tonnes in 1970-71 to 34.42 million tonnes in 2009-10.
Consumption of Lignite is highest in electricity generation sector, accounting for about 80% of the
total lignite consumption.
Industry-wise estimates of consumption of coal shows that from the year 1975-76 electricity
generation is the biggest consumer of coal, followed by steel industries. Estimated coal
consumption for electricity generation increased from 23 million tonnes during 1975-76 to 417.56
million tonnes during 2011-12. Similarly, the estimated consumption of coal by steel sector and
washery increased from 19 million tonnes to 41 million tonnes, a two times increase, during the
same period. The coal consumption profile for the year 2008-09 is shown in Figure 2.
38.05 19.85
2.16
381.06 105.45
Electricity
Steel
Cement
Paper
Others
Figure 2: Coal Consumption profile (million tonnes) of 2008-09
162.4 Coal washeries
Coal washing is an important component in the total ‘coal- energy’ chain. Raw coals coming
from mines are washed to produce a clean product of the desired quality for different end users.
Washing of coking coals to meet the needs of the steel sector has a long history in this subcontinent
but thermal coal washing for the power sector is yet to mature to the desired level. A coal washery
does not normally form part of coal mine in India. As on 31st March, 2010, a total of 52 washeries,
both public sector unit (PSU) and private, were operating in the country. The total installed washing
capacity was 126 million tonnes per year, for both coking (29.69 million tonnes per annum) and
non-coking coal (96.32 million tonnes per annum). The capacity and the locations of some of the
major non coking washeries are given in Table 2.
Table 2: Installed capacity of major non coking coal washeries in India (as of 31st March,
2010)
SI.NO Washery & Operator Location Capacity (million
tonnes)
(A) Coal India Ltd.( CIL)
1 Dugda-I,CIL Jharkhand 2.50
2 Madhuban,CIL Jharkhand 2.50
3 Piparwar, CIL Jharkhand 2.50
4 Gidi,CIL Jharkhand 6.50
5 Kargali,CIL Jharkhand 2.72
6 Bina, CIL Uttar Pradesh 4.50
(A.)CIL Total 21.22
(B) Private
1 Dipka, Aryan Coal beneficiation Pvt. Ltd. Chhattisgarh 12.00
2 Gevra, Aryan Coal beneficiation Pvt. Ltd. Chhattisgarh 5.00
3 Panderpauni, Aryan Coal beneficiation Pvt. Ltd. Maharastra 3.00
4 Chakabuwa, Aryan Energy Pvt. Ltd. Chhattisgarh 4.00
5 Talcher, Aryan Energy Pvt. Ltd. Orissa 2.00
6 Wani, Kartikay Coal Washeries Pvt. Ltd. Maharastra 2.50
7 Ramagundam, Gupta Coalfield & Washeries Ltd. Andhra Pradesh 2.40
8 Sasti, Gupta Coalfield & Washeries Ltd. Maharastra 2.40
9 Tamnar, Jindal Steel & Power Ltd. Chhattisgarh 6.00
10 Ghugus, Bhatia International Ltd. Maharastra 4.00
11 Wani, Bhatia International Ltd Maharastra 3.00
12 Ib Valley, Global Coal Mining (P) Ltd. Orissa 3.25
13 Bilaspur, Gupta Coalfield & Washeries Ltd Chhattisgarh 3.50
14 Gondegaon, Gupta Coalfield & Washeries Ltd Maharastra 2.40
15 Majri, Gupta Coalfield & Washeries Ltd Maharastra 2.40
16 Talcher, Global Coal Mining (P) Ltd. Orissa 2.50
17 Punwat, Punwat, Indo Unique Flame Ltd. Maharastra 2.40
Private others 15.35
(B) Private Total 75.10
Total non-coking (for power sector) (A+B) 96.32
173.0 Power Generation Sector in India
3.1 Installed generating capacity of electricity
The total installed capacity for electricity generation in the country has increased from
16271 MW as on 31.03.1971 to 199877 MW as on 31.03.2012. By the end of March 2012, thermal
power plants accounted for 65.8% of the total installed capacity in the country, with an installed
capacity of 131603 MW. This is followed by hydro power plants with an installed capacity of
38990 MW, accounting for 19.5% of the total installed Capacity. The share of nuclear energy is
only 2.4% (4780 MW).
The geographical distribution of installed generating capacity of electricity as of 31st March,
2012 indicates that Western Region (both central and state sector) accounted for the highest share
(32.21%) followed by Southern Region (26.38%), Northern Region (26.97%), Eastern Region
(13.15%) and North Eastern Region (1.2%). There are more than 90 thermal power plants across the
length and breadth of the country using coal as the main fuel resource. The share of generation
capacity by the state sector, central sector and private sector are 43 %, 30% and 27% respectively.
The locations of the major coal based power stations in the country are given in the Map 2.
18Map 2: Locations of the Thermal Power Plants (not to scale)
The trends in energy production in the country by primary sources and the installed
electricity generation capacity are shown in Figures 3 and 4 respectively.
19Figure 3: Primary energy sources in India (source-Energy statistics-2011)
Figure 4: Installed electricity generation capacity in India
(Source-Energy statistics-2011)
203.2 Coal fired power plant in India
At present, coal based power plants accounts for about 55% of the total installed capacity in
the country. Existing coal-fired power plants in India are mostly based on pulverized coal fired
system with subcritical steam conditions, having unit sizes ranging typically from 30 MW to 500
MW. However, few units of 600 MW are also in operation. About nine units (660/800 MW) based
on supercritical technology have been commissioned by March 2012. The total installed capacity of
different boiler unit sizes and their gross generation from 2007-08 to 2010-11 is given in Table 3
and Table 4. The source (imported or Indian) wise coal consumption by the power sector is given in
Figure 5. The distribution of untreated, washed and imported coals fed to the coal fired plants in the
year 2010 is given in Figure 6.
Table 3: Boiler unit sizes and installed power plant capacity
Capacity of Installed power plant capacity
boiler units 2007-08 2008-09 2009-10 2010-11
(MW)
500 18500 20000 20990 22480
300-330 - 1500 2430 5220
250 4250 5500 7750 9000
210 28980 29610 29820 29820
195-200 4795 4795 4990 4990
100-150 9160 8860 9695 9645
25-99 4884.50 4649.50 4462 4402
Table 4: Unit size wise electricity generation
Capacity of Gross generation (million kWh)
boiler units 2007-08 2008-09 2009-10 2010-11
(MW)
500 133668.14 144265 154453.09 161637.17
300-330 - 6834.55 13513.47 28622.33
250 29079.03 36228.31 5424.93 62687.35
210 210342.55 210112.15 209483.37 200464.66
195-200 34836.80 33895.43 34559.69 33903.7
100-150 44315.55 42036.67 45818.21 44973.28
25-99 23309.64 24656.55 22795.14 21407.68
21Source wise Coal Consumption in Power sector
450000
400000
Others
350000
Imported
300000 SECL
x100MT
250000 ECL
200000 WCL
SCCL
150000
NCL
100000
MCL
50000
BCCL
0 CCL
2003 2004 2005 2006 2007 2008 2009 2010 2011
Year
Figure 5: Coal consumption in the power sector (source wise)
Imported
7.3% washed
7.4%
Untreated(In
digenous)
85.3%
Figure 6: Share of Indigenous, imported & washed coal (2010) in the power sector
223.3 Air pollution control equipment in the power plants
Due to high ash level and low calorific values of Indian coals, the dust load of the flue gases are
generally very high. The electrical resistivity of typical Indian fly ashes lies in the range 109 to 1012
ohm. m. The high ash resistivity and dust load need higher efficiency of particulate capture devices.
Almost all the coal/ lignite based power plants in India are equipped with electrostatic precipitators
with typical operational efficiencies of particulate capture of more than 99.0 per cent.
The following power plants have installed additional air pollution control devices (APCDs) :
o Koradi TPS of Maharastra have installed fabric filters along with electrostatic precipitator;
o Trombay Power Plant and Dhanu Power Plants have installed wet flue gas desulphurization;
and
o A few pulverized coal fired power plants have employed ammonia conditioning and SO3
dosing to enhance efficiency of ESP.
4.0 Present Study
In tune with the project objectives, the present study was focused on three broad tasks:
i) Quality assessments and estimation of mercury concentrations of the coals being fed to
coal power plants;
ii) Assessing the reduction potential of mercury through coal washing in the existing
commercial coal washeries; and
iii) Mercury emissions measurement at three pulverized coal fired power plants.
4.1 Coal analysis
Twenty three power plants have been selected by Central Electricity Authority (CEA) taking
into account the locations and feed coal sources. Most of the power plants in the country receive
coals from multiple mine sources that are located at different coalfields of the country.
The methodology adopted in collection of coal samples, solid residues, flue gases and
suspended particulate matter; sample preparation/ dissolution; testing and analytical techniques are
according to the relevant National and International Standards the details of which are given in
Table 5.
23Table 5. The methods adopted for collecting, preparing and analyzing samples
Activity Sample Procedures
Collection of samples Coal Indian Standard IS : 436 ( Part l/Set 1) – 1964:
Methods for sampling of coal and coke sampling of
coal: Manual Sampling
Indian standard IS 436(Part I/Sec 2)-1976 Methods for
sampling of coal and coke: Part I Sampling of coal
Section 2: Mechanical Sampling
ISO 13909-2001Hard coal and coke- Mechanical
sampling-Part 1: General Information
Sample preparation Coal ASTM D2013 - Standard Practice of Preparing Coal
Samples for Analysis
Chemical analysis Coal Indian standard IS 1350 Part I to Part V for proximate
analysis, gross calorific value, total sulphur, carbon &
hydrogen, nitrogen and chlorine content in coal.
Chemical analysis Coal ash Indian standard IS 1355:1984 Methods of
determination of chemical composition of ash of coal
and coke
Indian standard IS 1727:1967 Methods of tests for
pozzolanic materials
Mercury analysis Coal ASTM D3684-1978: Standard Test Method for Total
Mercury in Coal by the Oxygen Bomb
Combustion/Atomic Absorption Method Combustion
Residues by Acid Extraction or Wet Oxidation/Cold
Vapor Atomic Adsorption
ISO 15237: Solid mineral fuels-Determination of total
mercury content of coal
Mercury analysis Coal and EPA Method 7473 - Mercury in Solids and Solutions
solid by Thermal Decomposition, Amalgamation, and
residue Atomic Absorption Spectrophotometry
ASTM D6414 - Standard Test Method for Total
Mercury in Coal and Coal Combustion Residues by
Acid Extraction or Wet Oxidation/Cold Vapor Atomic
Adsorption
Analyses of arsenic Coal ISO 11723, Solid Mineral Fuels- Determination of
and selenium arsenic and selenium in coal- Hydride generation
method
Flue gas Flue gas & ASTM D6784-2002 Standard test method for
sampling(gaseous and SPM elemental, oxidized, particle bound and total mercury
particulate) and in flue gas generated from coal fired stationary sources
analysis ( Ontario Hydro Method)
24A total of sixty six coal samples ( sub-bituminous and bituminous) from twenty three power
plants spread across the country were collected and characterized in terms of the proximate,
ultimate, heat value, heavy metal and chlorine contents and major oxides. The coal samples were
collected from the outlet of coal bunkers before they are fed to the mill. Out of these sixty six coal
samples analyzed, only two were washed coal, used, at Dadri and Unchahar power plants. The
estimated average values of the quality parameters for the coal samples are shown in Tables 6 and
7. The mercury and chlorine contents of the feed coals of the respective power plants are given in
Table 8.
Table 6 : Quality parameters of the coals fed to Power Plants
Coal Source CCL BCCL MCL NCL WCL ECL SECL SCCL
Weight % Air dried basis
Moisture 7.8 1.0 8.2 9.4 7.5 5.3 6.1 5.2
Ash 33.0 41.4 40.9 37.4 37.8 29.6 28.0 31.4
VM 23.0 15.9 23.8 23.3 23.4 25.8 26.1 26.4
FC 36.2 41.7 27.1 29.9 31.3 39.2 39.8 37.0
C 42.3 43.0 35.6 40.3 42.1 46.9 50.2 46.2
H 2.7 2.6 2.5 2.6 2.9 3.0 3.1 2.9
N 0.9 1.0 0.9 0.8 0.9 1.2 1.1 0.9
S 0.5 0.4 0.5 0.3 0.7 0.5 0.5 1.0
GCV(kcal/kg) 4111 4875 3570 3835 4562 4450 5008 5110
Table 7: Major and Minor Elements
Coal Source(Air dried basis) CCL BCCL MCL NCL WCL ECL SECL SCCL
Na g/tonne 1005.4 355.4 427.2 17.8 271.3 560.4 280.7 430.3
Ca (Weight % in dry ash) 0.38 0.42 1.05 0.92 0.55 0.58 0.46 0.87
Cl g/tonne 356.9 93.4 167.8 266.0 70.3 100.2 92.7 79.5
Hg g/tonne 0.22 0.08 0.20 0.06 0.12 0.08 0.10 0.12
As g/tonne 0.86 1.45 0.95 1,15 1.92 1.30 1.44 1.58
Se g/tonne 3.22 1.52 2.14 5.76 1.32 1.20 1.22 0.48
25Table 8: Mercury content of the feed coals to power plants
coal source Mercury Chloride
Sr. No Power Plant No Air dried basis
of samples (g/tonne) (g/tonne)
1 Ropar PANAM, Captive 1 0.207 106
2 Lehra Mohabbat PANAM, Captive 1 0.148 42
3 Yamuna Nagar CCL 1 0.243 254
4 Unchahar NTPC CCL 1 0.192 80
5 Bhatinda,GNDTP CCL 1 0.215 97
6 Kahalgaon NTPC BCCL,ECL 3 0.014-0.055 64-146
7 Farakka NTPC BCCL,ECL 7 0.053-0.154 33-255
8 BkTPP, WBPDCL ECL,BCCL,MCL 10 0.015-0.192 35-143
9 Feroz Gandhi TPP BCCL 1 0.117 74
10 Budge Budge,CESC ECL,MCL,BCCL 4 0.05-0.183 55-135
11 SgTPP,WBPDCL ECL,MCL,BCCL 4 0.02-0.214 55-190
12 Raichur SCCL; MCL;WCL 3 0.141-0.185
13 Ennore TPS MCL 2 0.307-0.342 140-155
14 Khaperkheda TPS WCL,SECL,MCL 5 0.051-0.167 30-285
15 Talcher STPS NTPC MCL 4 0.205-0.303 212-266
16 Singrauli, NTPC NCL 2 0.055-.065 213-319
17 Ramagundam NTPC SCCL,SECL 2 0.097-0.144 53-106
18 Satpura, MPPGCL WCL,SECL,MCL 1 0.123 80
19 Kolaghat, WBPDCL ECL 1 0.105 145
20 Korba(W), CSEB SECL 1 0.176 85
21 Talcher TPS MCL 3 0.173-0.229 106-155
22 Kota,STPS, Rajasthan SECL 4 0.003-0.215 53-124
23 Dadri, NTPC CCL(Washed & Raw) 4 0.223-0.257 66-1489
4.2 Mercury emissions measurement in power plants
Direct emissions measurement was carried out in one boiler unit at three pulverized coal fired power
plants. The unit generation capacities of the boiler units are 210 MW, 250 MW and 500 MW. The power
plants are:
1. Talcher STPP, National Thermal Power Corporation, (Public sector);
2. Korba (West), Chhattisgarh Electricity Board (Chhattisgarh State owned);
3. Budge Budge, Calcutta Electric Supply Corporation (private sector).
All the three power plants are equipped with electrostatic precipitator (ESP) for particulate
capture. The measured average flue gas temperature at the outlet of the ESP’s are 150 OC (Talcher STTP),
130 OC (Korba) and 127 OC (Budge Budge). Representative samples of crushed coal (20 mm top size),
pulverized coal (gas (upstream of ESP) was iso-kinetically pulled through a quartz fibre filter and a series of chilled
impinges. The filter retains particulate present in the gas stream and vapour phase components of the flue
gas are absorbed in impinger liquids. The collection of flue gas samples and that of suspended particulate
matter (SPM) were performed simultaneously. The duration of sample collection ranged between 2-3
hours. The results shown in Table 9 are the average values of three runs in each boiler units.
In Budge Budge power plant, the sampling of flue gas was done at 91 metre elevation in the stack.
In the other two power plants the gas sampling was done in the ducts at the outlet of ESP.
Table 9: Mercury concentrations in flue gas samples and combustion products
LOI of Fly Fr. of Hg
Unit ash Solid Products Flue emitted
Capacity (Weight %) Mercury concentrations(dry basis) Gas Speciation (average)
Bottom Mill 3
Fly ash SPM μg/NM Hg 2+ Hg0
Power Plants ash rejects
g/t g/t g/t g/t % %
Talcher
STPP, NTPC 500MW 0.64 0.097 0.006 - 0.066 14.84 30.8 60.8 0.81
Korba (W)
CEB 210 MW 0.85 0.158 0.011 1.373 0.057 11.50 11.3 88.1 0.61
Budge Budge
CESC 250 MW 2.05 0.242 0.017 0.143 0.105 4.24 41.60 58.1 0.27
(LOI= Loss on Ignition)
4.3 Previous study at NTPC coal based power plants
A similar study was carried by this Institute earlier in seventeen boiler units at three super
thermal power plants of NTPC having unit sizes 200, 210 and 500 MW with a total generation
capacity of 5260 MW. The results are presented in Table 10.
Table 10: Distribution of Mercury in Flue Gas and Other Combustion Products at NTPC coal
based power plants
Distribution of Fr. of Hg
Unit Feed coal Mercury in combustion products emitted
Capacity mercury (%) Speciation (average)
Bottom Flue
Fly ash SPM Hg 2+ Hg0
Power Plants ash Gas
g/t % % % % % %
200MW/ Not
Singrauli STPP 500MW 0.140 26.29 detected 0.69 73.71 30.08 68.98 0.73
6X210
MW/ 0.60
Vindhyachal 2X500
STPP MW 0.138 38.63 1.13 0.39 60.24 30.09 69.26
Rihand 2X500
STPP MW 0.17 48.50 0.70 2.51 48.4 38.20 56.61 0.48
274.4 Washery samples
The feed and the products of five coal washeries were sampled and analysed for their
Mercury content. The washeries located in three different states of Jharkhand, UttarPradesh and
Chattisgarh are of diferent capacity and use different washing schemes. The equipment are mainly
Jig, ROM Jig, and Heavy Medium washers. In most of the cases the reduction of mercury was
observed through cleaning as evident from the results given in Table 11.
Study conducted in the five non-coking coal commercial washeries clearly indicates that
significant reductions of mercury concentrations are achieved as a co benefit.The highest mercury
reduction of 39.8% is achieved in Bina washery and the lowest reduction in mercury level of 13.1%
is observed in case of JSPL washery. It is evident from Table 11 that there is no direct relation
between the reductions in ash contents and the reductions in mercury concentrations in the product.
The results indicats that reductions in mercury contents are highly coal specific. It depends not only
on the nature of association and distribution of mercury in coal matrix, but also on the washing
process adopted.
Table 11: Distribution of Mercury in the Washery products
Coal Washery Samples M A Hg(mg/kg)
Weight % (air dried basis) Air dried basis
Piparwar Feed coal 4.8 40.2 0.215
CCL Clean coal 4.6 33.5 0.185
Rejects 4.2 55.1 0.198
Kargali Feed coal 0.9 45.6 0.132
CCL Clean coal 1.1 33.8 0.099
Rejects 0.6 67.3 0.105
Gidi Feed coal 2.0 47.2 0.125
CCL Clean coal 4.5 32.6 0.102
Rejects 2.0 65.0 0.104
JSPL Feed coal 5.8 48.4 0.222
Private Clean coal 7.3 31.9 0.193
Middlings 2.8 66.2 0.240
Rejects 1.6 79.0 0.526
Bina Feed coal 3.6 42.9 0.093
NCL Clean coal 4.3 36.6 0.056
Rejects 1.5 76.1 0.096
(Clean coal, rejects,middlings- the three products of a washery.)
4.5 Inter-calibration of analyses on selected coal samples
For validation of estimated Mercury concentrations in coal samples, eight numbers of coal
samples (six from power plants & two from coal washeries) along with two standard reference coal
samples with certified Mercury contents (Table 12) were subjected to inter-laboratory testing. Coal
28samples were analyzed for Mercury contents at CSIR-NIO (CSIR-National Institute of
Oceanography), Vishakhapatnam, India (Table 13).
Table 12 Certified mercury concentrations of reference coal samples
Certified reference coal sample Certified mercury content(dry basis), μg/kg
BCR-182( European Commission) 40.0 ±7.0
NIST(USA) SRM-2693 37.3 ± 7.7
Table 13: Method adopted and instrument used by the laboratories
Laboratory Method Instrument
CSIR-CIMFR US EPA Method 7473 Tri-cell DMA-80 (Milestone, Italy)
CSIR-NIO US EPA Method 7473 Tri-cell DMA-80(Milestone, Italy)
Table 14 shows the replicate values for the mercury contents of the coal samples as obtained
by CSIR-CIMFR and CSIR-NIO.
Table 14: Inter laboratory variability of mercury concentrations
Sample No Mercury content estimated by CSIR-NIO Mercury content estimated by CSIR-CIMFR(dry
(dry basis) μg/kg basis) μg/kg
Rep-1 Rep-2 Rep-3 Average Rep-1 Rep-2 Rep-3 Average
BCR-182 36.7 43.4 40.4 40.2 40.6 43.8 42.8 42.2
SRM-2693 34.1 34.1 32.8 33.7 40.2 37.3 38.4 38.6
16 62.1 62.5 61.3 61.9 66.3 64.1 64.6 65.0
18 96.0 93.3 99.7 96.3 97.9 96.7 97.3 97.3
30 122.0 129.5 128.5 126.7 126.6 142.8 131.4 133.6
57 178.1 169.4 178.4 175.3 183.2 177.5 192.8 184.5
59 104.8 111.8 110.1 108.9 111.1 115.3 112.9 113.1
67 71.8 72.7 62.8 69.1 61.5 60.6 58.2 60.1
W/8 94.9 96.5 91.0 94.1 99.8 103.2 102.4 101.8
W/9 108.1 107.7 108.1 108.0 122.6 113.8 108.3 114.9
The results indicate that the mercury concentrations of coal samples as determined by
triplicate measurements by the two laboratories are comparable and the precision obtained for the
standard reference coal samples lies within the acceptable uncertainty limits.
295.0 Mercury emission factor and Emission Inventory
The coal samples studied under this project activity show wide variability in terms of ash per
cent, gross calorific value (GCV) and the mercury content. The minimum and maximum value of
the mercury content is 0.003 g/tonne and 0.34 g/tonne. The average value of mercury content of 66
feed coal samples to TPS coming from eight coalfields is 0.14 g/tonne. The average value of 0.14
g/tonne has been considered as the input factor of the coals being used by the power sector and has
been used to estimate the mercury emission inventory in this study.
The average mercury input factors (concentration, g/tonne) of the different coalfields are
shown in Table 7 and the source wise coal consumption data are shown in Figure 5.
To estimate the mercury emissions from the power sector, the methodology provided in
UNEP Tool Kit has been used. In the UNEP Tool Kit methodology, for coal combustion, the default
output distribution factor for mercury to air is considered as 0.9 for those power plants which have
an ESP for particulate capture.
The mercury release from the power sector has been estimated using the following equations.
Emissions factor = Input factor * output distribution factor to air
Estimated Mercury Release (tonne/year) = Activity rate * Emissions factor
Activity rate = Amount of coal fed to power plants in a year (tonne/year)
Input factor = Mercury Input Factor of coal (Hg concentration in coal, g/tonne)
Output Distribution factor to air = 0.9 (As per UNEP Tool kit for plants having General ESP). The
results for the period 2003 to 2011 are depicted in Figure 7.
30Figure 7: Trend of Mercury in feed coals and emission from the thermal Power stations
60.0
50.0
40.0
Hg in tons
30.0 Hg in feed
20.0 Hg emission,
UNEP ODF value-
0.9)
10.0 Hg emission,
Measured ODF -
0.58
0.0
2003 2004 2005 2006 2007 2008 2009 2010 2011
Year
As mercury content in coals are subject to significant variation, there is a high degree of
uncertainty in this estimate since the bulk of the emissions are estimated using emission factors
obtained with limited number of coal samples. It needs to be mentioned that use of the default value
of the output distribution factor of 0.9 is likely to give a higher estimate of the emissions. Implicit in
the default value 0.9 is the assumption that the volatile mercury are entirely carried in the flue gas
and depending on the efficiency of the existing air pollution control system a fraction of the
mercury is retained and 90 % is released in the air. This default value considers only 10% retention
of mercury in the solid combustion products. Previous study in 17 boiler units and the present
measurements carried out in three boiler units in the country using high ash coals show that a
significant portion of the Mercury is retained in the fly ash. Such observations have also been
reported in literature. Hence the default factor needs to be modified in the Indian context.
From the Mercury emissions study carried out in three power plants (Table 9) and earlier
study in three other plants (Table 10) the fraction of feed coal mercury emitted to air were found to
be 0.81, 0.61 and 0.27, 0.73, 0.60, and 0.48. The measurements were carried in boiler units of
different generation capacity and the very limited Mercury emissions data do not provide an
objective basis for arriving at an average output distribution factor. However, the emissions results
clearly indicate that the output distribution factor (ODF) can be much lower than the UNEP default
factor of 0.9. Considering the data of the present study as shown in Table 9 and the archive data as
depicted in Table 10, a tentative value of the mean Output Distribution Factor(ODF) of 0.58 has
been arrived at for the coal based power plants in the country. This estimated figure, however,
requires further refinement based on detailed study on large number of power plants considering the
capacity, vintage and Air Pollution Control Device. The projected estimates based on the UNEP
default value of 0.9 and the estimated mean value of 0.58 is shown in Figure 7. It is apparent that
31use of the lower value of ODF can significantly lower down the projected estimates of mercury
emissions from the Indian power sector.
5.1 Partitioning of Mercury and Mercury Speciation
The results of the emissions measurement carried out in three power plants are shown in Table
9. Considering the quantity of fly ash generated from the high ash Indian coals and the mercury
content in the fly ash, a significant proportion of feed coal mercury is retained in the fly ash. The
Mercury concentrations in the bottom ash samples are not significant. This is also noted that there is
considerable enrichment of Mercury in mill rejects. This reflects the probable association of coal
Mercury with the hard minerals present in coal like pyrite, siderite etc.
Results from Table 9 reveal that a major portion of the emitted Mercury is in elemental form.
This may be attributed to low chloride concentrations of the feed coals leading to lower conversions
of mercury vapors to the oxidized form. It is also observed that the fraction of Mercury emitted in
relation to input Mercury increases with the increase in the dust load at the outlet of ESP. It is also
observed that the Mercury content of fly ash is a function of its loss on ignition. Loss on ignition is
a measure of unburned carbon content of fly ash.
5.2 Future Mercury Emission Estimate
Based on the projected coal consumption in power sector in the year 2016 and 2021, the
Mercury emissions from this sector has been estimated using the developed Mercury emission
factor of coal as 0.14 g/tonne. The projected Hg emissions are estimated considering 0.9 as the
distribution factor to air. The figures are shown in Table 15.
Table 15. Projected estimates of mercury emissions from power sector
Year 2016 2021
Projected Coal Consumption(tonne) 730,000,000 1,180,000,000
Projected Hg Emissions( tonne) 91.99 148.7
using UNEP ODF of 0.9 (default value)
Projected Hg Emissions(tonne) using ODF of 0.58 59.28 95.82
(estimated value)
With efficiency improvements, use of increased washed coal , efficiency improvements of
existing APCDs, installation of high efficiency air pollution control equipment the mercury
emission in 2016 and 2021 will be lower than these estimated values.
326.0 Global Inventory of Mercury in coal and mercury emissions
The average mercury concentrations of coals of the major coal producing countries like
USA, China, South Africa, Russia, Brazil and Australia are in the range of 0.11 to 0.31 g/tonne. In
this study, the average mercury content of Indian coals for the power sector has been found to be
0.14 g/tonne. The mercury concentration in coals of different countries is given in Table 16.
Table 16: Mercury contents in raw coals across the world
Country Coal Type Av. Mercury Range Reference
Content (g/tonne)
g/tonne
India Bituminous/Sub 0.14 0.003-0.34 This study
bituminous
China Bituminous/Sub- 0.17 0.01-2.25 UNEP, 2011
bituminous/
Anthracite/ Lignite
USA Lignite 0.15 0.03-1.0 US EPA 1997
Bituminous 0.21Table 17: Mercury emission inventory of ten select countries
No. Country Total(tpa) Category
Stationary Industry Other sources
combustion production
1 China 604.7 474.1 130.6 n.d
2 South Africa 256.7 82.6 174.1 n.d
3 India 149.9 133.0 16.9 n.d.
4 Japan 143.5 49.6 61.3 32.6
5 Australia 123.5 109.6 13.8 0.1
6 USA 109.2 60.4 23.6 25.2
7 Russia 72.6 26.5 24.4 21.7
8 Kazakhstan 43.9 36.9 7.0 n.d
9 Korea (DR) 46.0 38.5 7.5 n.d
10 Saudi Arabia 40.7 39.0 1.7 n.d.
Total 1590.7 1050.2 460.9 79.6
n.d. = no data available tpa=tonnes per anum
The largest Hg emitter countries in 2000, (ref: Pacyna, E. G.; Pacyna, J. M.; Steenhuisen, F.;
Wilson, S., Global anthropogenic mercury emission inventory for 2000. Atmospheric Environment
2006, 22 (40), 4048-4063)
Table 18: Global mercury emission inventory
(Ref: Global Mercury emissions to the atmosphere from anthropogenic and natural sources N.
Pirrone, S. Cinnirella, X. Feng, et al. Atmos. Chem. Phys. Discuss., 10, 4719–4752, 2010)
34In the two references, Mercury emissions from stationary combustion in India has been
shown to lie between 124.6 -133.0 tonne per year. This figure is much above the estimate made in
this study where the total Mercury emissions from thermal power plants from the year 2003-2010
varies between 29.07-41.22 tonne/year using ODF value of 0.9. Based on the estimated ODF value
of 0.58, the emission is found to vary between 18.73-26.56 tonne/year
7.0 References
1. Goodarzi, F. Speciation and mass-balance of mercury from pulverized coal fire power plants
burning western Canadian subbituminous coals. Journal of Environmental Monitoring 2004,
6 (10), 792-798.
2. Pacyna, E. G.; Pacyna, J. M.; Steenhuisen, F.; Wilson, S., Global anthropogenic mercury
emission inventory for 2000. Atmospheric Environment 2006, 22 (40), 4048-4063.
3. Pacyna, E. G.; Pacyna, J. M.; Sundseth, K.; Munthe, J.; Kindbom, K.; Wilson, S.; Steenhuisen,
F.; Maxson, P., Global emission of mercury to the atmosphere from anthropogenic sources in
2005 and projections to 2020. Atmospheric Environment
4. Global mercury emissions to the atmosphere from anthropogenic and natural sources N.
Pirrone, S. Cinnirella, X. Feng, et al. Atmos. Chem. Phys. Discuss., 10, 4719–4752, 2010
5. Mercury emissions from industrial sources in India and its effects in the environment, A.B.
Mukherjee, Prasun Bhattacharya et. al., Springer, Chap. 4, 81-112, 2009.
6. United Nations Environmental Programme, Chemicals, Toolkit for identification and
quantification of mercury releases, November 2005
7. Global emission of mercury to the atmosphere from anthropogenic sources in 2005 and
projections to 2020 E.G. Pacyna, J.M. Pacyna, et. al. Atmospheric Environment(2010) volume
44, issue 20, 2487-2499
8. Technical background report to the Global Atmospheric Mercury Assessment (2008)
AMAP/UNEP Chemicals Branch.
9. Ghosh, S.B., Das, M.C., Roy, R.R., Banerjee, N.N., 1994. Mercury in Indian coals. Indian J.
Chem. Technol. 1, 237– 240.
10. Mercury in coal: a review Part I Ya. E. Yudovich*, M.P. Ketris International Journal of Coal
Geology 62 (2005) 107– 134
11. CPCB, “Mercury balance in thermal power plants”, Annual Report, 2001
12. Mercury in India: Usage and releases, www.toxicslink.org
13. Central Electricity Authority’s (CEA) Review of Performance of Thermal Power Station
3514. CEA’s General Review
15. CEA Baseline CO2 emission database, Version 7
16. Energy Statistics 2011 Ministry of Statistics and Programme Implementation, Govt. of India.
www.mospi.gov.in
17. “Indian Coal Volumes” published by Central Fuel Research Institute, India.
18. Annual reports, Office of Coal Controller, Ministry of coal.
19. UNEP reports, 2011.
20. Studies on Mercury in Coal and Combustion Products of Super Thermal Power Stations of
NTPC in Singrauli Region, June 2006.
***
36You can also read