NELSON AND TASMAN THE CLIMATE AND WEATHER OF - 2nd edition G. R. Macara - NIWA
←
→
Page content transcription
If your browser does not render page correctly, please read the page content below
THE CLIMATE AND WEATHER OF
NELSON AND TASMAN
2nd edition         G. R. Macara
© 2016. All rights reserved. The copyright for this report, and for the data, maps, figures and other information
(hereafter collectively referred to as “data”) contained in it, is held by NIWA. This copyright extends to all forms
of copying and any storage of material in any kind of information retrieval system.

While NIWA uses all reasonable endeavours to ensure the accuracy of the data, NIWA does not guarantee or
make any representation or warranty (express or implied) regarding the accuracy or completeness of the data,
the use to which the data may be put or the results to be obtained from the use of the data. Accordingly, NIWA
expressly disclaims all legal liability whatsoever arising from, or connected to, the use of, reference to, reliance
on or possession of the data or the existence of errors therein. NIWA recommends that users exercise their own
skill and care with respect to their use of the data and that they obtain independent professional advice relevant
to their particular circumstances.

NIWA SCIENCE AND TECHNOLOGY SERIES
NUMBER 71

ISSN 1173-0382

Note to Second Edition
This publication replaces the first edition of New Zealand Meteorological Service Miscellaneous Publication 115
(3), written in 1965 by J. F. de Lisle and I. S. Kerr. It was considered necessary to update the first edition, incor-
porating more recent data and updated methods of climatological variable calculation.
THE CLIMATE AND WEATHER OF
THE NELSON AND TASMAN
DISTRICT
2nd edition           G. R. Macara
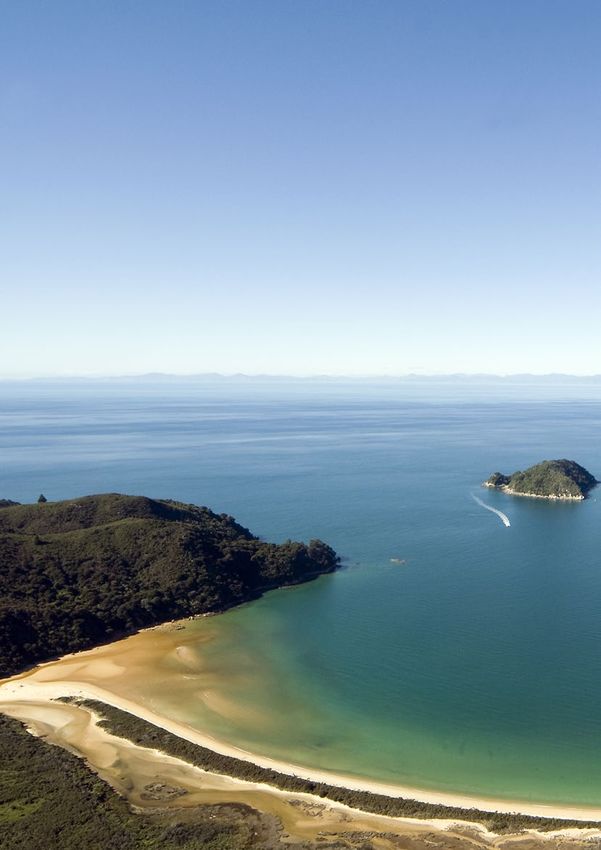
Photo: ©mychillybin.co.nz/ Vibeke Friis
CONTENTS
SUMMARY                                            6

INTRODUCTION                                       7

TYPICAL WEATHER SITUATIONS IN NELSON AND TASMAN    9
   Fine weather spells                             9
   Heavy rain                                     10
   Brief periods of rain                          10

CLIMATIC ELEMENTS                                 13
   Wind                                           13
   Rainfall                                       15
     Rainfall distribution                        15
     Rainfall frequency and intensity             18
     Recent extreme events in Nelson and Tasman   20
     Periods of low rainfall                      20
   Temperature                                    21
     Sea surface temperature                      21
     Air temperature                              22
     Earth temperatures                           25
     Frosts                                       26
   Sunshine and solar radiation                   27
     Sunshine                                     27
     Solar radiation                              28
     UV (ultra-violet) radiation                  28
   Other elements                                 29
     Thunderstorms and hail                       29
     Fog                                          29
     Snow                                         29

DERIVED CLIMATOLOGICAL PARAMETERS                 31
  Vapour pressure and relative humidity           31
  Evapotranspiration and soil water balance       32
  Degree-day totals                               34

ACKNOWLEDGEMENTS                                  38

REFERENCES                                        38

                                                       5
SUMMARY
Nelson City and Tasman District are located in
the most north-westerly part of the South Island
and generally are the first to be influenced by
weather systems moving onto the island from the
north. The area is well exposed to these systems,
whereas it is sheltered a great deal from systems
arriving from the south. The region is situated in
the latitudes of prevailing westerlies, and parts
around the north-western tip (e.g. Farewell
Spit) often experience strong winds, but the
winds are lighter elsewhere. Rainfall is fairly
evenly distributed across the year, although
February and March are typically the driest
months of the year whereas the wettest months
are observed in winter or spring. Parts of the
Tasman Mountains receive in excess of 6000 mm
of annual rainfall. Nelson and the Waimea Plain
are the driest areas of the region, and are well
sheltered from rain-bearing systems arriving
from the west and south. Here, annual rainfall
totals of approximately 1000 mm are recorded.
Dry spells of more than two weeks are quite
common, particularly in eastern and inland
locations. Temperatures are mild compared with
the rest of the country, with the region’s close
proximity to the sea resulting in a relative lack
of extreme high and extreme low temperatures.
Temperatures exceeding 30°C are rare in coastal
areas. Frosts are quite common in the cooler
months, however they occur less frequently
than most other South Island locations. Nelson
and Tasman are renowned for receiving a great
deal of sunshine, particularly in Nelson City
itself where average annual sunshine hours
(approximately 2,400 hours) are among the
highest recorded in New Zealand.
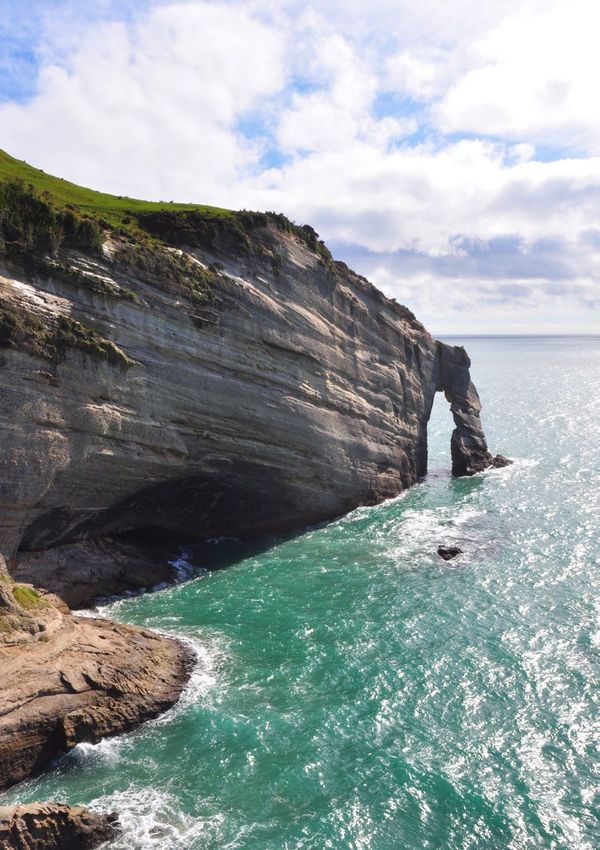
Photo: ©mychillybin.co.nz/Ray J Salisbury
6
INTRODUCTION
New Zealand spans latitudes 34 to 47
degrees south, and so lies within the
Southern Hemisphere temperate zone. In
this zone, westerly winds at all levels of
the atmosphere move weather systems,
which may also be either decaying or
developing, eastwards over New Zealand
giving great variability to its weather.
These prevailing westerlies sometimes
abate, and air from either tropical or polar
regions may reach New Zealand with
heavy rainfalls or cold showery conditions,
respectively. The features of Nelson City
and Tasman District’s climate which
differentiate it from that of other areas in
central New Zealand can be accounted for
by the topography of the area. The Waimea
Plain lies north-east to south-west in
orientation, and is open to Tasman Bay.
Together with the coastal strip around
Golden Bay and the Takaka Valley, they
form the only extensive lowland areas
in the region. The plains are sheltered
both from the prevailing westerly winds
and from winds from an easterly and
southerly direction. This results in a
sunny, mild climate, which is less windy       Figure 1. Map of Nelson City and Tasman District, showing the places
than most other areas in New Zealand           mentioned in this publication.
but prone to frost in sheltered locations.
The rainfall, which is typically adequate
for spring pasture growth, is liable to be
insufficient in summer and early autumn
when extended dry spells and occasionally
drought can occur.

The Nelson City and Tasman District area
(Figure 1) is comprised of the coastal
margins of the north-western South
Island, from low elevation locations
adjacent to the Tasman Sea, Golden Bay
and Tasman Bay, to higher elevations
farther south including the Tasman             Note that all numbers given in the following tables are calculated
Mountains and Nelson Lakes National            from the 1981-2010 normal period (a normal is an average
Park. The landscapes of the regions are        or estimated average over a standard 30-year period), unless
diverse, which combined with the variety       otherwise stated. Also note that throughout this publication,
of activities available make the regions a     ‘Nelson and Tasman’ is used to define the entire region shown in
popular tourist destination.                   Figure 1, comprising Nelson City and Tasman District.

                                                                                                                      7
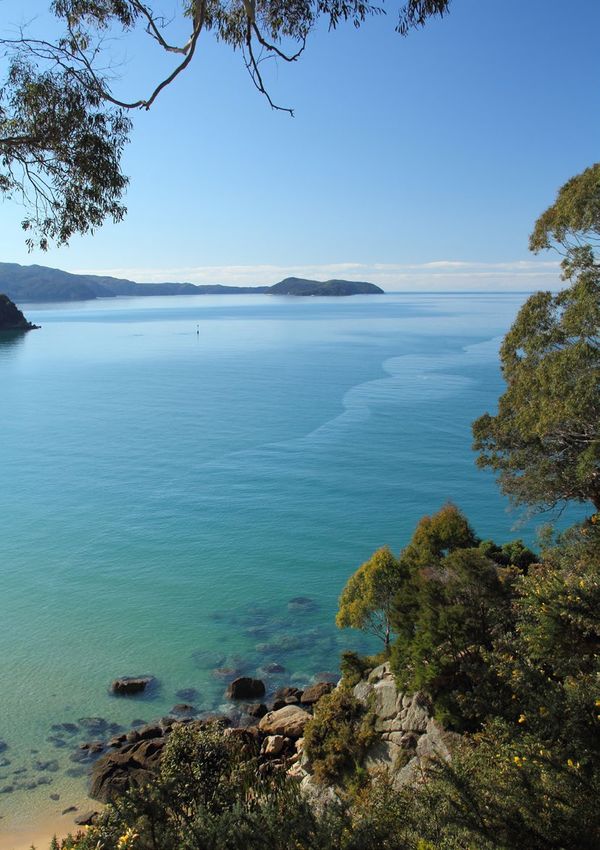
8
Photo: ©mychillybin.co.nz/Rob Lynch
TYPICAL WEATHER
SITUATIONS IN NELSON AND
TASMAN

New Zealand lies in the zone of mid-latitude westerlies       different weather situations are possible in Nelson and
where a succession of depressions (lows) and                  Tasman, they tend to fall into only a few characteristic
subtropical anticyclones (highs) generally progress           categories: (a) fine weather spells, (b) heavy rain, and
eastwards over the country. Often, a trough of low            (c) showery weather.
pressure separates two highs, and it usually contains a
frontal system, which extends into one or more lows on        Fine weather spells
the southern side of the highs. As the highs move east,       Prolonged spells of fine weather of five days or more
New Zealand experiences a regular weather sequence,           are usually associated with a large anticyclone moving
which has a period of about a week. The path followed         slowly eastwards over New Zealand. If a depression
by the centre of an anticyclone may be to the north of        develops to the north or north-east of the North Island
New Zealand, across the country, or occasionally to           a ridge of high pressure may still extend over the upper
the south. The first type of track is more likely in winter   South Island when the anticyclone is centred far to the
and spring and the other types are more likely in             east or south-east. This type of situation is shown in
summer and autumn. It is unusual for an anticyclone           Figure 2. Fine, sunny weather and light winds typically
to move from Australia across the Tasman Sea and              prevail over Nelson and Tasman during such periods,
out to the east without a change in its intensity, speed      although there are some exceptions. For example,
and direction of movement. These changes are closely          fresh sea breezes can occur along coastal areas,
related to developments in the low-pressure trough            especially during summer. Additionally, anticyclones
which is an unstable region where vigorous storms             support the development of low cloud or fog in inland
sometimes form. The storms are depressions which              parts of Tasman, chiefly during May to September.
typically form in the north-west Tasman Sea. From
there they tend to move in a south-east direction,
growing in intensity as they move, and frequently cross
or pass near the North Island. Another less frequent
type of storm which may affect New Zealand is the
ex-tropical cyclone which forms in the south-west
Pacific in the months from November to April. The air
in an ex-tropical cyclone is still warm and moist by the
time the storm reaches New Zealand due to its long
passage over tropical waters, and the resulting rainfall
may be especially heavy.

The weather in Nelson and Tasman is dominated by
migratory anticyclones and intervening troughs of low
                                                              Figure 2. Mean sea level pressure analysis for 1200 hrs NZST on
pressure. The majority of anticyclones passing over           19 November 1960.
New Zealand are centred to the north of Cook Strait,
and the wind flow in the lower atmosphere over Nelson
and Tasman is generally from a westerly quarter.
However, at the surface the wind direction is modified
by topographical influences. For example, a general
westerly flow over central New Zealand produces
strong north-west winds through the funnel of Cook
Strait, but in Tasman Bay the wind direction swings
around to the north or north-east. Although many

                                                                                                                                9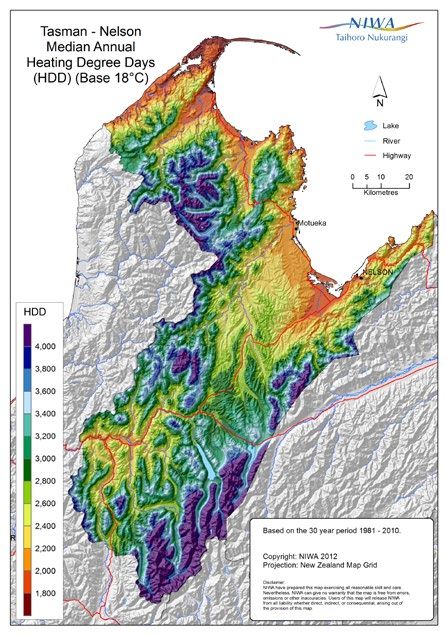
Heavy rain
     Prolonged periods of heavy rain occur most commonly
     when there is a large, slow-moving anticyclone east
     of New Zealand and a deep depression in the eastern
     Tasman Sea. This results in a strong northerly flow of
     air over New Zealand, which may be warm and moist if
     the air is of tropical origin. The period of 17 to 19 May
     1965 (Figure 3) was typical of this type of situation.
     Rain began to fall in Nelson around midday on 17 May
     and continued for approximately two days, reaching
     its greatest intensity on the morning of 18 May. Total
     rainfall for the period in Nelson was 42.7 mm, and
                                                                  Figure 3. Mean sea level pressure analysis for 0600 hrs NZST on
     Takaka recorded 60.7 mm. The hills and ranges of the         19 May 1965.
     region provided shelter for locations farther south,
     such that Murchison only recorded 7.1 mm of rain
     during this time.

     Brief periods of rain
     Brief periods of rain in Nelson and Tasman are
     typically associated with the northward passage of a
     cold front over New Zealand. In western parts the rain
     may last for several hours and amount to 10 to 25 mm
     or more. In eastern parts the duration and amount
     of rainfall is likely to be much less, and occasionally
     there may be no rain at all. Such a situation is shown
     in Figure 4. Here, a cold front lying in the trough of low
     pressure between two eastward moving anticyclones
     was situated just north of the South Island at 6 p.m. on
     26 April 1965. Nelson remained dry for much of the day       Figure 4. Mean sea level pressure analysis for 1800 hrs NZST on
                                                                  26 April 1965.
     on 26 April, until 3.4 mm of rain was recorded between
     5 p.m. and 7 p.m. Only 0.4 mm of rain was recorded
     over the remainder of the night. Farther north-west,
     Takaka recorded a total of 7.4 mm of rain on 26 April.

10
Photo: ©mychillybin.co.nz/Martin Little 11
Photo: ©mychillybin.co.nz/Daile McCarthy
CLIMATIC ELEMENTS
Wind
Wind direction over New Zealand in the
zone directly above the Earth’s surface
may be interpreted from a mean sea
level pressure (MSLP) map, following the
general principle that in the Southern
Hemisphere air flows in a clockwise
direction around a depression (or a ‘low’),
and in an anticlockwise direction around
an anticyclone (or a ‘high’). As such, MSLP
maps can be used to indicate the general
wind direction at the Earth’s surface.
However, actual wind direction and speed
at a particular locality is modified by the
influence of friction and topography. Sea
breezes develop along coastal parts of
Nelson and Tasman when synoptic-scale
pressure gradients are weak, and are
generated by air temperatures over land
becoming higher than air temperatures
over the sea. These sea breezes may
develop throughout the year, but are most
common in summer and least common
in winter. Figure 5 shows mean annual
                                                        Figure 5. Mean annual wind frequencies (%) of surface wind directions from
wind frequencies of surface wind based on
                                                        hourly observations at selected Nelson and Tasman stations. The plot shows
hourly observations from selected Nelson                the directions from which the wind blows, e.g. the dominant wind direction at
and Tasman locations.                                   Farewell Spit is from the west.

Mean wind speed data (average wind
speeds are taken over the 10 minute
period preceding each hour) are available
for a number of Nelson and Tasman
locations, and these illustrate the several
different wind regimes of the region
(Table 1). Mean wind speeds are highest
at exposed coastal locations such as
Farewell Spit, and lowest at inland and
sheltered locations. There is notable                   Tasman, where wind speeds are typically highest from around
variability in mean monthly wind speeds                 mid-spring (October) to mid-summer (January), and lowest from
over the course of a year in Nelson and                 mid-autumn to the end of winter (April to August).

Table 1. Mean monthly and annual wind speed (km/hr) for selected Nelson and Tasman locations, from all available data.

 Location                         Jan    Feb     Mar      Apr    May     Jun     Jul    Aug     Sep    Oct     Nov    Dec     Ann
 Farewell Spit                    21.3   19.7    20.0     19.0   19.6    19.9   19.9    19.7    22.3   24.7    25.1   22.6    21.2
 Nelson                           14.3   12.4    12.3     10.0    9.6    8.8     8.3     9.6    11.7   14.2    14.9   14.8    11.7
 St Arnaud                         9.1    8.4    8.3      6.8     6.6    6.5     6.9     6.2    6.8     8.7    8.7     8.1     7.6
 Murchison                         7.9    7.6    6.9      6.0     5.9    6.2     6.0     6.5    7.4     8.4    9.2     8.1     7.2
 Motueka                           5.6    5.1    4.9      4.1     4.0    4.0     4.2     4.5    5.1     5.9    6.1     5.9     5.0

                                                                                                                                        13
Table 2 gives the seasonal distribution and frequency
of occurrence of strong winds (defined as having a
daily mean wind speed of greater than 30 km/hr). For
example, of all strong winds recorded at Nelson, 30%
(nine strong wind days, on average) occur in summer.
As a further example, Farewell Spit and Motueka share
the same distribution of strong winds in winter, with
25% of their respective annual strong winds being
recorded in that season. However, Farewell Spit has
an average of 16 strong wind days in winter, compared
to less than one such day in Motueka. This highlights
that although a similar seasonal distribution of strong
winds may be observed between different locations in
Nelson and Tasman, the actual number of strong wind
days per season at those locations may be considerably
different. St Arnaud and Murchison are well sheltered
by the surrounding mountains, and strong wind days
at these locations are exceptionally rare. As shown in
Tables 1 and 2, spring and summer are typically the
windiest seasons throughout the region.
Table 2. Seasonal distribution and frequency (mean number of days) of strong winds (daily mean wind speed > 30 km/hr) recorded at
selected Nelson and Tasman locations, from all available data.
Location Summer Autumn Winter Spring Annual
Distribution Frequency Distribution Frequency Distribution Frequency Distribution Frequency Frequency
Farewell Spit 23% 15 20% 13 25% 16 32% 21 65
Nelson 30% 9 21% 6 13% 4 36% 11 30
Motueka 26% 0.6 17% 0.4 25% 0.6 31% 0.7 2
St Arnaud 0% 0 0% 0 0.6% 0.6 0% 0 0.6
Murchison 0% 0 0% 0 0% 0 0% 0 0
Diurnal variation in wind speed is well-marked, with 20
Mean wind speed (km/hr)
highest wind speeds occurring mid-afternoon before St Arnaud Nelson
15
decreasing overnight. This is because heating of
the land surface is most intense during the day, and 10
stronger winds aloft are brought down to ground level
by turbulent mixing. Cooling at night generally restores 5
a lighter wind regime. Table 3 gives average wind
0
speeds at three-hourly intervals for selected locations, 0 3 6 9 12 15 18 21
whilst Figure 6 visually highlights the typical diurnal Hour of day
variation of wind speed observed throughout Nelson Figure 6. Mean wind speed at selected hours of the day for
and Tasman. Nelson and St Arnaud.
Table 3. Mean wind speed (km/hr) at three-hourly intervals of the day.
Location 0000 0300 0600 0900 1200 1500 1800 2100
Farewell Spit 19.7 18.8 18.2 18.5 21.5 24.0 22.8 20.6
Motueka 4.4 4.0 3.9 5.7 7.0 8.3 7.1 5.2
Murchison 5.9 5.5 5.4 5.9 7.5 9.4 9.5 7.9
Nelson 8.4 7.7 7.2 8.8 15.5 19.5 15.6 10.1
St Arnaud 6.6 5.8 5.7 5.9 8.7 10.4 9.7 7.9
14Gusty winds are relatively infrequent throughout most Table 4. Mean number of days per year with gusts exceeding 61
lowland Nelson and Tasman locations, occurring km/hr (33 knots) and 94 km/hr (50 knots) for selected locations.
more frequently in the mountain ranges and exposed Gusts Gusts
Location
coastal locations. Nelson experiences an average of >61 km/hr >94 km/hr
38 days per year with wind gusts exceeding 61 km/ Farewell Spit 106 4
hr, considerably less than Farewell Spit where on Nelson 38 0.7
average 106 such days per year are recorded (Table St Arnaud 6 0
4). Maximum gusts recorded at Nelson and Farewell
Spit are listed in Table 5. The highest gust recorded in Table 5. Highest recorded wind gusts at Farewell Spit and
Nelson, from all available data.
Nelson was 139 km/hr on 12 March 1975.
Location Gust (km/hr) Direction Date
Farewell Spit 127.8 W 17/05/1977
Nelson 139.0 ESE 12/03/1975
Rainfall
Rainfall distribution
Nelson and Tasman’s median annual
rainfall is shown in Figure 7, which
clearly illustrates how rainfall is affected
by topography and exposure to the
main rain-bearing airflows from the
west. Rainfall is highest in the Tasman
Mountains which have both high elevation
and western exposure. This is the result
of orographic enhancement. Specifically,
moisture-laden air masses passing over
the Tasman Sea are forced to rise over the
western ranges. As these air masses rise,
they cool rapidly, causing the stored water
vapour to condense, resulting in rainfall.
The air masses continue eastwards, but
they hold significantly less moisture once
beyond the western ranges. As a result,
there is a marked decrease eastwards in
median annual rainfall. Nelson and the
Waimea Plain are the driest areas of the
region, as they are well sheltered from
rain-bearing systems arriving from the
west and south. Here, annual rainfall
totals of around or just below 1000 mm
Figure 7. Nelson and Tasman median annual total rainfall, 1981–2010.
are typically recorded.
Table 6 lists monthly rainfall normals and the wettest months are observed in winter or spring. The
percentage of annual total for selected locations. distribution of monthly rainfall is shown in Figure 8.
Rainfall is fairly evenly distributed throughout the year The 10th percentile, 90th percentile, and mean rainfall
at all locations, although February and March are values for each month are shown along with maximum
typically the driest months of the year whereas the and minimum recorded values for several stations.
15Table 6. Monthly and annual rainfall normal (a; mm), and monthly distribution of annual rainfall (b; %) at selected Nelson and
Tasman locations, for the period 1981 – 2010.
Location Jan Feb Mar Apr May Jun Jul Aug Sep Oct Nov Dec Ann
a 258 200 210 239 304 326 246 302 324 399 276 288 3371
Collingwood
b 8 6 6 7 9 10 7 9 10 12 8 9
a 92 69 77 94 118 148 102 108 138 98 80 89 1212
Farewell Spit
b 8 6 6 8 10 12 8 9 11 8 7 7
a 138 133 165 107 155 173 169 144 184 207 153 206 1934
Lake Rotoroa
b 7 7 9 6 8 9 9 7 9 11 8 11
a 138 108 117 128 142 198 144 169 170 218 166 159 1856
Matakitaki
b 7 6 6 7 8 11 8 9 9 12 9 9
a 82 86 95 106 116 141 131 144 122 117 99 104 1341
Motueka
b 6 6 7 8 9 11 10 11 9 9 7 8
a 121 83 94 125 127 171 145 141 156 169 142 147 1620
Murchison
b 7 5 6 8 8 11 9 9 10 10 9 9
a 77 64 71 81 82 92 78 82 85 87 78 84 959
Nelson
b 8 7 7 8 9 10 8 9 9 9 8 9
a 121 105 111 110 121 144 115 124 147 162 124 164 1548
St Arnaud
b 8 7 7 7 8 9 7 8 9 10 8 11
a 131 118 141 156 162 203 196 183 197 198 159 168 2012
Takaka
b 7 6 7 8 8 10 10 9 10 10 8 8
Farewell Spit Murchison Nelson
100 200 300 400 500
100 200 300 400 500
100 200 300 400 500
Rainfall (mm)
Rainfall (mm)
Rainfall (mm)
0
0
0
J FMAMJ J A S OND J FMAMJ J A S OND J FMAMJ J A S OND
Collingwood Takaka
1200
1200
Highest Monthly Total
90 Percentile Value
900
900
Rainfall (mm)
Rainfall (mm)
600
600
Mean
300
300
10 Percentile Value
Lowest Monthly Total
0
0
J FMAMJ J A S OND J FMAMJ J A S OND
Figure 8. Monthly variation of rainfall for selected Nelson and Tasman locations from all available data.
Rainfall variability is further indicated by rainfall time period that is longer than one month beginning
deciles, as given in Tables 7, 8 and 9. The 10th with the month stated. For example, using the table
percentile values show the accumulated rainfalls for Nelson (Table 8), it can be seen that in the three
that will normally be exceeded in nine out of ten month period beginning in January, 104 mm or more
years, whilst the 90th percentile values indicate the of rainfall can be expected in nine years in ten, while a
accumulated falls that will normally be exceeded in total of 353 mm or more should occur, on average, in
only one year in ten. The tables include periods from only one year in ten.
one month to twelve months (annual), with each
16Table 7. Rainfall means and deciles at monthly, 3-monthly, 6-monthly, 9-monthly and annual intervals for Murchison from all
available data.
Jan Feb Mar Apr May Jun Jul Aug Sep Oct Nov Dec
Murchison
1 month
90th 194 166 148 216 242 280 225 221 246 256 275 228
Mean 116 97 98 130 138 151 134 137 143 162 144 139
10th 35 24 44 43 60 74 45 50 61 76 49 65
3 months
90th 438 481 512 555 562 557 595 651 597 586 567 497
Mean 313 326 368 418 422 422 414 443 450 444 400 353
10th 192 210 235 282 305 281 236 279 267 281 254 246
6 months
90th 926 951 967 1031 1073 1096 1112 1054 1041 980 982 922
Mean 732 747 788 832 863 871 859 845 805 756 726 723
10th 559 573 627 662 669 639 627 606 594 561 547 565
9 months
90th 1422 1442 1510 1532 1496 1472 1426 1427 1431 1429 1424 1395
Mean 1146 1187 1236 1277 1266 1228 1174 1174 1176 1176 1148 1144
10th 920 919 944 1009 1018 912 901 951 955 935 917 955
Annual
90th 1920
Mean 1593
10th 1290
Table 8. Rainfall means and deciles at monthly, 3-monthly, 6-monthly, 9-monthly and annual intervals for Nelson from all available
data.
Jan Feb Mar Apr May Jun Jul Aug Sep Oct Nov Dec
Nelson
1 month
90th 149 142 146 174 170 159 151 161 146 167 145 159
Mean 73 67 74 87 94 92 88 93 88 90 77 82
10th 14 8 18 25 32 32 27 33 29 26 26 28
3 months
90th 353 362 388 372 408 405 382 415 359 369 370 348
Mean 215 229 255 273 275 274 270 272 256 249 231 221
10th 104 136 138 159 176 166 148 157 148 131 129 114
6 months
90th 651 682 740 735 728 719 707 680 636 638 644 676
Mean 487 503 530 543 547 529 520 505 477 465 460 475
10th 320 339 354 378 378 336 360 348 300 305 315 307
9 months
90th 1005 1027 1075 1069 1019 999 960 947 936 934 941 1004
Mean 759 775 785 793 780 751 738 735 733 736 731 746
10th 547 557 523 560 575 512 510 522 519 539 554 544
Annual
90th 1321
Mean 1010
10th 756
17Table 9. Rainfall means and deciles at monthly, 3-monthly, 6-monthly, 9-monthly and annual intervals for Takaka from all available
data.
Jan Feb Mar Apr May Jun Jul Aug Sep Oct Nov Dec
Takaka
1 month
90th 259 221 252 317 317 342 319 305 288 327 285 277
Mean 138 111 130 168 192 186 189 183 181 196 161 160
10th 35 16 29 41 93 62 67 74 73 71 44 51
3 months
90th 615 597 730 810 787 723 750 794 821 822 722 624
Mean 383 408 486 543 562 558 554 562 540 518 462 412
10th 206 213 276 332 371 369 369 361 358 298 243 218
6 months
90th 1224 1258 1303 1334 1415 1466 1444 1399 1305 1251 1199 1155
Mean 929 976 1044 1092 1126 1103 1083 1032 950 909 881 905
10th 676 672 741 837 803 783 765 739 653 556 592 613
9 months
90th 1852 1908 1994 2101 1929 1944 1889 1814 1860 1844 1819 1836
Mean 1481 1535 1585 1617 1600 1521 1475 1442 1432 1453 1441 1462
10th 1118 1119 1149 1205 1176 1106 1070 1046 1092 1080 1135 1151
Annual
90th 2577
Mean 2006
10th 1539
Rainfall frequency and intensity
Table 10 lists the average number of days per month Heaviest short period rainfalls in Nelson and Tasman
with at least 0.1 mm (a ‘rain day’) and at least 1 mm (a are typically recorded at relatively high elevations in
‘wet day’) of rain for selected locations. The number of river catchments, which often occur when persistent
rain and wet days recorded at a given station tends to northerly/northwesterly airflows are established as a
be higher towards the south of the region, and lower trough approaches the South Island. For remaining
near the coast of Tasman Bay. The average number areas of Nelson and Tasman, heavy short period
of rain days each year varies from 130 days at Nelson rainfalls occur with the passage of a depression over
to 179 days at Matakitaki. Nelson and Motueka exhibit or close to the region (e.g. Figure 3), or in association
the lowest number of wet days in the region, with 95 with slow moving fronts, especially when the air has
and 101 wet days recorded on average respectively, originated from tropical regions. In Table 11, maximum
compared with 143 wet days at Matakitaki. A seasonal short period rainfalls for periods of 10 minutes to 72
variation of rain days and wet days is present in most hours with calculated return periods are given for
Nelson and Tasman locations, with a maximum Nelson and Takaka. Also listed in this table are the
occurring in spring. This may be attributed to the maximum rainfalls expected in 2, 5, 10, 20, and 50
seasonal changes in the general circulation of the years. Depth-duration frequency tables for Nelson
Southern Hemisphere. Specifically, westerly air flows and Tasman locations are available from NIWA’s High
over New Zealand may be intensified by development Intensity Rainfall Design System (HIRDS). HIRDS uses
and southward movement of the belt of subtropical the index-frequency method to calculate rainfall return
anticyclones which in turn are associated with changes periods. For more information on methods and to use
in the principal upper-air hemispheric jet stream. The the tool, see http://hirds.niwa.co.nz/.
seasonal changes in the general circulation of the
Southern Hemisphere result in a maximum frequency
of disturbed westerly situations in spring (Reid, 1980).
18Table 10. Average monthly rain days (a; days where at least 0.1 mm rainfall is measured) and wet days (b; days where at least 1 mm
rainfall is measured) at selected Nelson and Tasman locations.
Location Jan Feb Mar Apr May Jun Jul Aug Sep Oct Nov Dec Ann
a 10 9 10 11 14 14 14 15 16 17 13 14 159
Collingwood
b 10 9 9 10 13 14 13 14 15 16 11 13 148
a 8 7 9 10 12 13 13 13 12 13 11 10 133
Farewell Spit
b 7 6 7 9 10 11 11 11 10 11 9 9 112
a 13 11 12 12 16 16 15 16 18 19 15 17 179
Matakitaki
b 10 8 9 10 12 14 12 12 14 15 12 14 143
a 8 7 9 10 12 13 13 13 14 13 11 10 132
Motueka
b 6 5 7 8 9 9 10 10 11 10 8 8 101
a 12 10 11 13 14 14 14 15 16 17 15 15 167
Murchison
b 10 8 9 11 12 11 11 12 13 14 13 13 138
a 9 8 9 10 11 11 11 13 12 13 12 11 130
Nelson
b 7 6 7 7 8 8 8 9 9 9 8 8 95
a 9 8 9 10 12 12 13 13 13 14 12 12 137
Takaka
b 7 6 8 9 10 11 11 11 12 11 10 10 117
Table 11. Maximum recorded short period rainfalls and calculated return periods (or average recurrence intervals, ARI) from HIRDS.
Location 10min 20min 30min 1hr 2hrs 6hrs 12hrs 24hrs 48hrs 72hrs
Nelson a 16.5 22.3 29.5 43.0 62.8 118.9 137.3 143.7 159.5 179.5
Mar Apr Feb Jan Jan Jan Jan Jan Aug Aug
b 1963 1990 1964 1985 1985 1985 1985 1985 1970 1970
c 43 28 34 30 50 100+ 89 32 27 31
d 7.5 11.3 14.2 21.3 28.2 43.9 58.1 76.8 88.9 96.9
e 9.8 14.6 18.5 27.8 36.4 56.1 73.6 96.6 111.9 121.9
f 11.6 17.4 22.1 33.1 43.2 65.9 86.1 112.5 130.2 141.9
g 13.8 20.6 26.1 39.1 50.8 77 100.1 130.2 150.7 164.2
h 17.1 25.6 32.4 48.6 62.8 94.2 121.7 157.2 182 198.3
Takaka a 29.0 42.0 53.0 69.1 78.4 156.8 260.7 396.5 606.6 618.7
Jul Jul Oct Oct Oct Dec Dec Dec Dec Dec
b 1990 1990 2013 2013 2013 2011 2011 2011 2011 2011
c 100+ 100+ 100+ 59 23 40 85 100+ 100+ 100+
d 7.7 12.9 17.3 28.9 42.2 77.1 112.7 164.8 190.9 208.1
e 10.1 16.8 22.6 37.7 54.6 98.3 142.3 206.2 238.9 260.4
f 12 20 27 45 64.8 115.4 166.1 239.2 277.2 302.1
g 14.2 23.7 32 53.3 76.3 134.7 192.7 275.8 319.6 348.3
h 17.7 29.5 39.8 66.4 94.3 164.4 233.5 331.6 384.2 418.8
a: highest fall recorded (mm)
b: month and year of occurrence
c: calculated return period of a (years)
d: max fall calculated with ARI 2 years (mm)
e: max fall calculated with ARI 5 years (mm)
f: max fall calculated with ARI 10 years (mm)
g: max fall calculated with ARI 20 years (mm)
h: max fall calculated with ARI 50 years (mm)
19Recent extreme events in Nelson and Tasman greatly exceeding any previous record at this site.
Nelson and Tasman have experienced numerous The event was also the largest 48-hour accumulation
extreme weather events, with significant damage and ever recorded in an urban area in New Zealand, with
disruption caused by heavy rain and flooding. The an estimated return period of 500 years. A state of
events listed below are among the most severe rainfall emergency was declared on 14 December, and the
and flooding events to have affected the Nelson and National Crisis Management Centre at Parliament was
Tasman region in recent times. activated. More than 200 landslides occurred across
the region, with Collingwood, Cable Bay, Totaranui
April 2013: A complex low pressure system in the
and Ligar Bay isolated due to landslides cutting off
Tasman Sea directed a warm and moist airmass over
access roads to those areas. In Nelson and Pohara,
New Zealand. This clashed with a cold southeasterly
160 and 30 houses were evacuated due to flooding or
airmass, which generated considerable instability
landslides, respectively. Insurance claims from the
and resulted in torrential rainfalls across Nelson
event totalled $16.8 million. This event was the primary
and Tasman, particularly in Richmond and Stoke.
contributor to record-breaking December rainfall
The rainstorm was one of the most intense ever
totals throughout the region. Nelson received more
recorded in the region. The maximum 1-hour rainfall
than six times and Takaka received more than eight
total during the storm was 101 mm in the Roding
times their normal December rainfall (the highest
catchment area near Richmond, a rainfall total which
December totals there since records began in 1941
has a 500-year return period in this area. The highest
and 1976, respectively).
24-hour rainfall total recorded during the event was
216 mm, recorded at the Tasman District Council Periods of low rainfall
office in Richmond. Landslides caused a number of
Periods of fifteen days or longer with less than 1 mm
road closures throughout the region, and an estimated
of rain on any day are referred to as ‘dry spells’. Dry
90 homes were flooded. The worst affected area was
spells are quite common in most areas of Nelson and
along Orphanage Creek in Stoke, with many shops
Tasman, however they occur relatively infrequently
suffering stock damage and roads left covered in
in the western-most parts of the region. Dry spells
mud and debris. There was also serious damage to
throughout Nelson and Tasman typically occur when a
the roads and paths within the Saxton Field sports
persistent (blocking) anticyclone becomes established
complex, forcing its closure for more than a week.
over the South Island. Table 12 outlines the dry spell
December 2011: An active front associated with a frequency and duration for Nelson and Takaka. On
low pressure system was preceded by a strong and average, a dry spell occurs once every four months
very humid northeasterly flow, which transported air in Nelson, and once every six months in Takaka. The
directly from the sub-tropics to New Zealand. The front longest dry spell was 40 days, recorded in Nelson
moved very slowly eastwards across New Zealand, during May and June in 2008. Table 13 shows the
resulting in very heavy rainfall across Nelson and seasonal distribution of dry spells at Nelson and
Tasman. Some exceptionally large rainfall totals were Takaka. Dry spells occur most frequently in summer
recorded across the region. In Takaka, nearly 400 mm and least frequently in spring at both locations.
was recorded in just 24 hours and 607 mm in 48 hours,
Table 12. Average dry spell (at least 15 consecutive days with less than 1 mm rainfall per day) frequency and duration at Nelson and
Takaka, from all available data.
Location Frequency Mean duration (days) Max duration (days) Max duration date
Nelson One every 4 months 20 40 13/5/2008 to 21/6/2008
Takaka One every 6 months 19 35 9/2/2014 to 15/3/2014
Table 13. Seasonal distribution (%) of dry spells at Nelson and Takaka, from all available data.
Location Summer Autumn Winter Spring
Nelson 34% 28% 20% 18%
Takaka 36% 32% 18% 14%
20Temperature
Sea surface temperature
Monthly mean sea surface temperatures (SST) off Nelson air temp Murchison air temp Sea surface temp
20
the coast of Nelson are compared with mean air 18
temperature for Nelson and Murchison in Figure 16
14
Temperature (°C)
9. There is a lag in the increase of sea surface 12
temperatures when compared to air temperatures 10
8
from July to September. This may be at least in 6
part attributed to the greater heat capacity of the 4
2
sea compared to land, which results in the sea 0
Jan Feb Mar Apr May Jun Jul Aug Sep Oct Nov Dec
surface temperatures taking longer to increase and Month
decrease in response to changing seasons compared
to land-based areas. Nelson records higher mean Figure 9. Mean monthly air temperature (Nelson and
Murchison) and estimated sea surface temperatures (off the
air temperatures in winter compared to the inland coast of Nelson).
location of Murchison. This may be partly attributed
to the moderating influence of the sea on overnight
minimum temperatures near the coast. Figure 10
shows the mean sea surface temperatures for the New
Zealand region for February and August, which are
the warmest and coolest months with respect to sea
surface temperatures.
A) MEAN FEBRUARY SST (°C) B) MEAN AUGUST SST (°C)
Figure 10. Monthly mean sea surface temperatures (°C) for: a) February; b) August. Source: NIWA SST Archive, Uddstrom and
Oien (1999).
21Air temperature
Nelson and Tasman typically observe afternoon lower temperatures are recorded at higher elevation
temperatures reaching between 20°C and 23°C locations. Low elevation locations have a median
in summer, and overnight temperatures falling to annual temperature of between 11°C and 13°C.
between -1°C and 5°C in winter (Figure 11). Similar Median annual temperatures of below 4°C occur at
daily maximum temperatures are recorded throughout high elevations along the Ella, Travers and St Arnaud
Nelson and Tasman, with the notable exception of Ranges which are located towards the south of the
high elevation areas where temperatures become region. Figure 13 gives the monthly temperature
increasingly lower as elevation increases. In winter, regime (highest recorded, mean monthly maximum,
daily minimum temperatures become lower as mean daily maximum, mean, mean daily minimum,
distance from the coast and elevation increases. Figure mean monthly minimum, and lowest recorded) for
12 shows the median annual average temperature in selected Nelson and Tasman locations.
Nelson and Tasman, and clearly demonstrates that
Figure 11. Left: Nelson and Tasman median summer (December, January and February) average daily maximum temperature;
Right: Nelson and Tasman median winter (June, July and August) average daily minimum temperature, 1981-2010.
Photo: ©mychillybin.co.nz/Mark Meredith
22Figure 12. Nelson and Tasman median annual average
temperature, 1981–2010.
Farewell Spit Motueka Murchison
40
40
40
30
30
30
Temperature (oC)
Temperature (oC)
Temperature (oC)
20
20
20
10
10
10
0
0
0
−10
−10
−10
J FMAMJ J A S OND J FMAMJ J A S OND J FMAMJ J A S OND
Nelson Takaka
40
40
Highest Recorded
30
30
Temperature (oC)
Temperature (oC)
Mean Monthly Maximum
20
20
Mean Daily Maximum
Mean
10
10
Mean Daily Minimum
0
0
Mean Monthly Minimum
−10
−10
Lowest Recorded
J FMAMJ J A S OND J FMAMJ J A S OND
Figure 13. Monthly variation in air temperatures for selected Nelson and Tasman locations from all available data.
Table 14 shows that the average daily temperature contrast, the inland location of Murchison observes
range, i.e. the difference between the daily maximum considerable variation in average daily temperature
and minimum temperature, varies minimally over range over the course of the year: the range is highest
the course of the year at locations near the coast. In in February and lowest in June.
23Table 14. Average daily temperature range (Tmax – Tmin, °C) for selected Nelson and Tasman locations.
Location Jan Feb Mar Apr May Jun Jul Aug Sep Oct Nov Dec Ann
Farewell Spit 8.1 8.1 7.8 7.6 7.2 7.0 7.2 7.3 7.3 7.2 7.6 7.5 7.5
Motueka 11.5 11.6 11.6 11.5 11.6 11.5 11.5 11.2 11.0 11.1 11.3 10.9 11.4
Murchison 14.4 14.6 13.4 11.7 9.2 7.7 8.8 10.6 11.4 11.9 13.0 13.0 11.6
Nelson 9.3 9.4 9.5 9.9 10.2 10.6 10.7 10.0 9.6 9.2 9.2 8.9 9.7
Takaka 11.5 11.5 11.8 11.3 11.5 11.4 11.1 10.7 10.9 11.1 11.2 10.7 11.2
Figure 14 and Table 15 further highlight the diurnal of many air temperature observations recorded over
temperature range, showing the median hourly mean the previous hour. As such, both the daily maximum
air temperature for January and July at Nelson and and minimum air temperatures calculated from hourly
Takaka. Overnight air temperatures at Takaka remain values are damped, resulting in a reduced diurnal
lower than Nelson in January and July, which may temperature range (Table 15) compared to the absolute
be attributed to the influence of cold air drainage daily temperature range (Table 14) recorded at Nelson
down the Takaka valley. Note that hourly mean air and Takaka.
temperature at a given time is calculated as the mean
Table 15. Median hourly mean air temperatures for January and July at Nelson and Takaka.
00 01 02 03 04 05 06 07 08 09 10 11
January 17.0 16.5 16.1 15.5 15.1 14.8 14.5 14.2 15.1 16.7 18.1 19.5
July 6.1 5.8 5.4 5.2 4.8 4.8 4.5 4.5 4.2 4.5 6.2 8.2
Nelson 12 13 14 15 16 17 18 19 20 21 22 23
January 20.5 21.1 21.4 21.5 21.5 21.5 21.3 20.5 19.8 19.0 18.1 17.5
July 9.9 11.4 12.0 12.3 12.0 11.0 9.6 8.5 7.8 7.1 6.7 6.5
00 01 02 03 04 05 06 07 08 09 10 11
January 15.0 14.3 13.7 13.3 12.6 12.3 12.0 12.1 13.3 16.1 18.0 19.5
July 5.1 4.9 4.8 4.6 4.4 4.2 3.7 3.6 3.6 4.3 6.6 9.1
Takaka
12 13 14 15 16 17 18 19 20 21 22 23
January 20.5 20.8 21.3 21.7 21.6 21.3 21.3 20.6 20.0 18.7 16.9 15.8
July 11.3 12.6 12.8 12.5 11.9 11.2 9.0 7.4 6.5 6.0 5.9 5.6
Nelson (January) Takaka (January) Nelson (July) Takaka (July)
Maximum air temperatures in excess of 25°C occur 25
relatively frequently at low elevation inland locations,
20
particularly in Murchison, where an annual average
Temperature (°C)
15
of 47 such days occur (Table 16). Maximum air
temperatures in excess of 30°C rarely occur in Nelson 10
and Tasman, with the exception of Murchison where 5
the maximum temperature exceeds 30°C on an 0
0 1 2 3 4 5 6 7 8 9 10 11 12 13 14 15 16 17 18 19 20 21 22 23
average of six days each year. Minimum temperatures Time (hours)
below 0°C occur very frequently at St Arnaud and Lake
Rotoroa, but are rare at Farewell Spit. The highest Figure 14. Median hourly mean air temperatures at Nelson and
Takaka in January and July.
air temperature recorded in Nelson and Tasman to
date is 36.8°C at Murchison on 5 February 2005. This the temperature reaching at least 30.0°C on each of
temperature occurred in the middle of an extremely the eighteen days: an extraordinary occurrence for a
hot spell in Murchison between 24 January and 10 New Zealand location. St Arnaud recorded the lowest
February 2005. During these eighteen days, the air temperature in Nelson and Tasman; -10.1°C on 16
average daily maximum temperature was 32.9°C, with August 2011.
24Table 16. Highest and lowest recorded air temperatures, average number of days per year where maximum air temperature exceeds
30°C and 25°C, and average number of days per year where the minimum air temperature falls below 0°C, for selected Nelson and
Tasman locations from all available data.
Highest Annual days Annual days Lowest Annual days
Location
recorded (°C) max temp > 30°C max temp > 25°C recorded (°C) min temp < 0°C
Farewell Spit 29.5 0 3 -2.0 0.5
Lake Rotoroa 30.1 0.09 12 -7.1 60
Motueka 36.2 0.4 21 -6.2 32
Murchison 36.8 6 47 -8.8 37
Nelson 36.3 0.2 8 -6.6 31
St Arnaud 31.4 0.4 11 -10.1 87
Takaka 33.0 0.6 19 -5.5 19
Earth temperatures
Earth (soil) temperatures are measured once daily at air temperature. The 10 cm earth temperatures
9 a.m. at several Nelson and Tasman locations. Earth are lower than the mean air temperature except
temperatures are measured at varying depths and are during late-spring and summer. The annual earth
important for determining the growth and development temperature cycle at 100 cm depth is more damped
of plants. Different plants have different rooting and lagged than at shallower depths. As a result,
depths and as such, earth temperatures are routinely earth temperatures at 100 cm remain above mean air
monitored at 10, 20, 30, and 100 cm depths. Table 17 temperature at all times of the year. Diurnal variation
lists mean monthly earth temperatures for a number of earth temperatures (not shown) decreases with
of standard depths. At the coastal Nelson location, increasing depth, such that earth temperatures may
higher winter earth temperatures are observed when show little-to-no diurnal variation at 100 cm depth.
compared to the inland location of St Arnaud.
Figure 15 shows how earth temperatures change
throughout the year at Nelson, compared with mean
Table 17. Monthly and annual mean 9 a.m. earth temperatures (°C) at varying depths from the ground surface for selected Nelson
and Tasman locations.
Location Jan Feb Mar Apr May Jun Jul Aug Sep Oct Nov Dec Ann
Motueka
10 cm 19.5 18.9 16.0 11.9 7.7 4.7 3.8 5.6 8.8 12.3 15.6 18.3 11.9
20 cm 21.1 20.8 17.9 13.7 9.4 6.0 5.0 6.8 10.0 13.4 16.7 19.5 13.4
30 cm 21.8 21.6 18.9 14.8 10.5 7.0 5.8 7.6 10.8 14.1 17.4 20.1 14.2
100 cm 19.2 19.8 18.8 16.5 13.5 10.4 8.4 8.7 10.5 12.8 15.3 17.5 14.3
Nelson
10 cm 18.3 18.0 15.7 12.1 8.4 5.6 4.5 5.9 8.7 11.9 14.7 17.1 11.7
20 cm 19.2 19.1 17.2 13.8 10.2 7.2 5.9 7.3 9.7 12.7 15.3 17.7 12.9
30 cm 20.0 20.1 18.3 15.1 11.6 8.5 7.0 8.3 10.6 13.4 16.1 18.4 13.9
100cm 18.5 19.2 18.4 16.5 13.8 11.1 9.2 9.4 10.8 12.9 15.0 17.0 14.3
St Arnaud
10cm 16.0 15.9 13.7 10.3 6.9 3.8 2.5 3.7 6.5 9.3 12.1 14.5 9.6
20cm 16.6 16.7 14.6 11.0 7.7 4.5 3.0 4.2 6.9 10.0 12.5 14.8 10.2
30cm 17.1 17.4 15.4 11.8 8.5 5.2 3.6 4.8 7.4 10.5 13.1 15.4 10.8
25Frosts 10 cm 100 cm Air temp
20
Frost is a local phenomenon and both its frequency
of occurrence and intensity can vary widely over 15
Temperature (°C)
small areas. Frosts occur most frequently in winter
during periods of anticyclonic conditions, primarily 10
for two reasons. Firstly, clear skies associated with 5
anticyclones enhance the rate of radiative cooling
during the night. Secondly, anticyclones are associated 0
Jan Feb Mar Apr May Jun Jul Aug Sep Oct Nov Dec
with light winds, which reduces the amount of Month
turbulent mixing of air. Cold air is relatively dense,
so when there is a lack of turbulent mixing it tends Figure 15. Monthly mean 9 a.m. earth temperature at different
depths from the ground surface, and monthly mean air
to sink towards the Earth’s surface. Therefore, areas temperature, from all available data at Nelson.
most likely to experience frost are flat areas, where
relatively cold air is not able to drain away on calm
nights, and in valleys and basins, where relatively cold
air pools after descending from higher elevation areas
-1.0°C or lower. Both types of frost are quite common
nearby. Under such conditions, temperature inversions
in Nelson and Tasman in the cooler months, but they
(where the air temperature increases with elevation)
occur less frequently than most other South Island
are common.
regions. Table 18 lists for selected locations the mean
There are two types of frost recorded. Air frosts occur daily grass minimum and extreme grass minimum
when air temperature measured by a thermometer temperatures, and the average number of days each
in a screen 1.3 m above the ground falls below 0°C. month with ground and air frosts. Ground frosts occur
Ground frosts are recorded when the air temperature more frequently than air frosts, and both types occur
2.5 cm above a closely cut grass surface falls to most frequently at the inland location of St Arnaud.
Table 18. Frost occurrence and grass minimum temperatures at selected Nelson and Tasman locations from all available data.
Location Jan Feb Mar Apr May Jun Jul Aug Sep Oct Nov Dec
Motueka a 9.1 9.0 7.2 4.0 1.1 -1.3 -2.0 -0.5 1.7 3.8 5.7 8.3
b -1.5 -1.8 -3.1 -6.0 -9.1 -9.4 -10.5 -8.9 -7.2 -5.8 -3.3 -1.6
c 0.02 0.05 0.5 4 12 18 20 16 9 3 0.7 0.1
d 0 0 0 0.2 3 10 12 6 1 0.2 0 0
Nelson a 9.1 9.1 7.4 4.2 1.4 -1.2 -2.0 -0.5 1.5 3.9 5.6 8.0
b -1.7 -2.8 -5.0 -10.2 -10.2 -13.0 -9.7 -9.4 -8.1 -6.1 -5.8 -3.2
c 0.01 0.1 0.7 4 11 18 21 17 10 4 1 0.3
d 0 0 0.01 0.1 3 9 11 6 1 0.2 0.01 0
St Arnaud a 6.6 6.4 4.9 1.9 -0.8 -3.4 -4.1 -2.9 -0.6 1.4 3.3 5.7
b -5.0 -5.4 -7.9 -8.7 -11.6 -13.9 -14.7 -13.8 -13.9 -9.9 -6.7 -5.4
c 0.5 0.7 2 9 15 20 23 20 14 10 4 1
d 0.1 0.1 0.8 4 12 18 21 17 10 5 2 0.4
a: mean daily grass minimum (°C)
b: lowest grass minimum recorded (°C)
c: mean number of ground frosts per month
d: mean number of air frosts per month
26Sunshine and solar radiation
Sunshine
Sunshine hours are highest along the
coast and slightly inland of Tasman Bay,
where annual sunshine totals of around
2,400 hours are typical (Figure 16). Nelson
is frequently one of the top-four sunniest
locations in New Zealand on an annual
basis. Annual sunshine hours tend to
decrease towards the south of the region,
especially at high elevation mountainous
areas where increased cloudiness reduces
the annual sunshine totals experienced.
Figure 17 shows the monthly mean,
maximum, and minimum recorded bright
sunshine hours for selected Nelson and
Tasman locations. Note that the lower
sunshine hours recorded in the winter
months tends to reflect the northerly
declination of the sun, as opposed to
signalling an increase in cloudiness
during those times.
Figure 16. Median annual sunshine hours for Nelson and Tasman, 1981–2010.
Motueka Nelson
Bright Sunshine (hours)
Bright Sunshine (hours)
300
300
200
200
100
100
0
0
J F M A M J J A S O N D J F M A M J J A S O N D
Takaka
Highest Recorded
Bright Sunshine (hours)
300
200
Mean
100
Lowest Recorded
0
J F M A M J J A S O N D
Figure 17. Mean, highest and lowest recorded monthly bright sunshine hours for selected Nelson and Tasman locations from all
available data.
27Solar radiation
Solar radiation observations of greater than 10 years
are available for only a few Nelson and Tasman sites.
Table 19 presents the mean daily global (i.e. direct
and diffuse) solar radiation for Motueka, Nelson and
Takaka. Insolation is highest in January and lowest in
June at all locations.
Table 19. Mean daily global solar radiation (MJ/m2/day) for selected Nelson and Tasman locations from all available data.
Location Jan Feb Mar Apr May Jun Jul Aug Sep Oct Nov Dec Ann
Motueka 24.2 21.0 17.0 11.1 7.7 6.0 6.8 9.4 13.4 18.1 22.6 23.6 15.1
Nelson 24.4 21.6 17.2 11.5 8.0 6.0 6.7 9.7 13.6 18.2 22.5 23.4 15.2
Takaka 24.8 21.2 16.7 11.2 7.9 6.1 6.8 9.3 13.6 18.3 23.2 23.0 15.2
UV (ultra-violet) radiation
Figure 18 shows an example of a UV forecast for
Nelson, indicating the UV levels and times of the
day where sun protection is required. UV levels in
Nelson are higher than New Zealand’s southern-
most locations, but lower than those experienced in
northern-most areas. All Nelson and Tasman locations
observe significantly higher UV levels in summer than
in winter.
Figure 18. UV Index forecast for Nelson, January and July. Source: https://www.niwa.co.nz/our-services/online-services/uv-ozone
28Other elements
Thunderstorms and hail
Thunderstorms are a relatively infrequent occurrence at any time of the year in Nelson and Tasman, it is
in Nelson and Tasman, with seven and four days recorded most frequently during late-autumn and
of occurrence per year in Nelson and St Arnaud, winter. For example, of the annual average of 17 days
respectively (Table 20). Hail is also uncommon in with fog at Nelson Airport, 10 days (60%) are recorded
Nelson and St Arnaud, with both locations observing between May and August.
an average of just two days of occurrence per
year, respectively. Due to the localised nature of Snow
thunderstorm and hail occurrence, it is possible Snowfalls occur frequently in the mountains and high
that not all severe convection events are detected at elevation inland locations of Nelson and Tasman, but
each station. Thunderstorms in Nelson and Tasman are very rare at low elevations. Table 20 shows the
are associated with bouts of high intensity rainfall, average number of days each year that snowfall occurs
lightning, hail, and wind squalls which sometimes at Nelson (0.1 days/year equates to 1 day/10 years)
cause considerable localised flooding and damage and St Arnaud. Snow doesn’t usually settle at coastal
to vegetation and crops. Severe hailstorms may be locations, however settled snow may last longer
classified as those which cause damage and/or have than a day or two at a time at higher elevation inland
hailstones of at least 0.5 cm in diameter. One such locations after particularly heavy snowfall events.
severe hailstorm struck parts of the Tasman District Seasonal snowfields typically begin to accumulate in
on 4 November 2014, with the worst-affected areas the mountains in late autumn, and persist through to
around Lower Moutere, Motueka and Riwaka. The late-spring.
worst of the hailstorm lasted approximately 20 minutes In August 2011, low pressure to the east of the New
and resulted in significant damage to apple and Zealand and an anticyclone to the south of the Tasman
kiwifruit crops: an estimated 15 to 20 orchards were Sea resulted in a very cold southerly airflow across
seriously affected with many crops deemed a complete most of New Zealand. Snow fell to low elevations
write-off. In some cases hail nets that were used in many areas which very rarely record snowfall,
to protect the orchards collapsed under the weight including in Nelson and Tasman. Snow reportedly
of hail, with trees subsequently breaking under the fell and settled throughout the region, including at
weight of the collapse nets. Motueka recorded 5.4 mm Motueka, Kaiteriteri and Appleby in the evening of 24
of rainfall in the hour between 10 p.m. and 11 p.m. August. Snow also reportedly settled to 100 metres
above sea level in the hills surrounding Golden Bay.
Fog
Farther inland, St Arnaud was isolated for a time due
The most common type of fog in inland parts of Nelson
to the closure of State Highway 63.
and Tasman is radiation fog, formed when the air
cools to its dew-point on clear nights, allowing the
water vapour in the air to condense. Near the coast,
advection fog can occur, where sea fog spreads onto
the land as evening cooling proceeds. The average
number of days per year with fog for Nelson and St
Arnaud is listed in Table 20. Although fog can occur
Photo: ©mychillybin.co.nz/Rob Lynch
Table 20. Average number of days each year with snow, thunder,
hail and fog recorded at Nelson and St Arnaud, from all
available data. The elevation of each station above mean sea
level is also shown.
Fog Thunder Hail Snow
Nelson Airport (2 m) 17 7 2 0.1
St Arnaud (634 m) 11 4 2 8
29Photo: ©mychillybin.co.nz/Cherie Palmer
DERIVED CLIMATOLOGICAL
PARAMETERS
Apart from elements such as temperature and rainfall               masses from different sources, being greatest in warm
which can be measured directly, it has been found                  air masses that have tropical origins and lowest in
that parameters calculated from several elements                   cold, polar-derived air masses. Vapour pressure can be
have some important uses, especially in industry.                  important in determining the physiological response of
Parameters which define the overall suitability of the             organisms to the environment (very dry air, especially
climate for agriculture, horticulture, architectural and           if there is a pre-existing soil moisture deficit, can
structural designs, and contracting, etc., are vapour              cause or increase wilting in plants). Mean monthly 9
pressure, relative humidity, evapotranspiration (leading           a.m. vapour pressures for several locations are given
to soil water balance), degree-days (thermal time),                in Table 21, which shows that vapour pressures are
and rainfall extremes. Some of these and their uses                lowest in the winter months.
are discussed in the following paragraphs. Note that
                                                                   Relative humidity relates the amount of water present
short-term high intensity rainfalls have already been
                                                                   in the atmosphere to the amount of water necessary
addressed in this publication.
                                                                   to saturate the atmosphere. Unlike vapour pressure,
                                                                   relative humidity is dependent on the air temperature.
Vapour pressure and relative humidity
                                                                   This is because as air temperature increases,
Vapour pressure and relative humidity are the two                  the capacity of the atmosphere to hold water also
parameters most frequently used to indicate moisture               increases. Therefore, relative humidity often displays
levels in the atmosphere. Both are calculated from                 large diurnal variation. Table 22 highlights this diurnal
simultaneous dry and wet bulb thermometer readings,                variation, showing 9 a.m. relative humidity is higher
although a hygrograph may be used to obtain                        than that recorded at 3 p.m. at corresponding times
continuous humidity readings.                                      of the year. Highest relative humidity is typically
Vapour pressure is the part of the total atmospheric               experienced in the winter months due to lower air
pressure that results from the presence of water                   temperatures.
vapour in the atmosphere. It varies greatly with air

Table 21. Mean monthly and annual 9 a.m. vapour pressure (hPa) at selected Nelson and Tasman locations from all available data.
 Location                                   Jan    Feb    Mar    Apr    May    Jun    Jul   Aug    Sep    Oct    Nov    Dec    Ann
 Farewell Spit                              15.4   15.6   15.0   13.5   11.6   10.1   9.5   10.2   11.2   11.9   12.7   14.6   12.6
 Motueka                                    14.8   15.0   14.1   11.9   9.5    8.0    7.6   8.4    9.8    10.9   12.2   13.8   11.3
 Murchison                                  14.0   14.1   12.7   11.2   9.7    7.9    7.3   8.0    9.2    10.3   11.2   12.8   10.6
 Nelson                                     14.6   15.0   14.0   12.2   10.1   8.2    7.8   8.8    9.9    11.1   12.0   13.7   11.4
 St Arnaud                                  12.1   12.2   11.3   9.6    8.0    6.8    6.2   6.7    7.7    8.7    9.6    11.2   9.2
 Takaka                                     14.9   14.9   13.2   11.8   10.1   8.5    7.9   8.9    10.1   11.0   11.9   14.1   11.4
                                                                                                                                      Photo: ©mychillybin.co.nz/Cherie Palmer

                                                                                                                                                        31
Table 22. Mean monthly and annual 9 a.m. (a) and 3 p.m. (b) relative humidity (%) at selected Nelson and Tasman locations.
Location Jan Feb Mar Apr May Jun Jul Aug Sep Oct Nov Dec Ann
a 77 79 79 80 82 84 84 84 80 78 76 78 80
Farewell Spit
b 66 66 67 72 75 76 71 74 69 69 65 72 70
a 75 81 81 84 88 90 90 87 79 75 75 74 82
Motueka
b 61 65 64 69 68 70 66 69 71 65 62 65 66
a 84 85 88 92 94 95 95 93 87 83 80 79 88
Murchison
b 47 48 51 60 72 80 75 65 59 54 47 50 59
a 73 77 80 83 88 90 90 87 80 76 73 73 81
Nelson
b 64 64 63 66 67 70 65 70 66 67 63 70 66
a 80 83 83 84 88 90 88 85 80 79 78 80 83
St Arnaud
b 50 52 55 57 63 68 64 62 57 54 47 54 57
a 78 83 82 83 87 90 87 86 80 80 75 77 82
Takaka
b 60 61 60 65 65 67 65 65 64 61 58 62 63
Evapotranspiration and soil water
balance
Evapotranspiration is the process
where water held in the soil is gradually
released to the atmosphere through a
combination of direct evaporation and
transpiration from plants. A water balance
can be calculated by using daily rainfalls
and by assuming that the soil can hold
a fixed amount of water with actual
evapotranspiration continuing at the
potential rate until total moisture depletion
of the soil occurs. The calculation of water
balance begins after a long dry spell when
it is known that all available soil moisture
is depleted or after a period of very heavy
rainfall when the soil is at field capacity.
Daily calculations are then made of
moisture lost through evapotranspiration
or replaced through precipitation. If the
available soil water becomes insufficient
to maintain evapotranspiration then a
soil moisture deficit occurs and irrigation
becomes necessary to maintain plant
growth. Runoff occurs when the rainfall
exceeds the field capacity (assumed to be
150 mm for most New Zealand soils).
Mean monthly and annual water balance
values for a number of Nelson and
Figure 19. Median annual days of wilting point deficit for Nelson and Tasman,
Tasman locations are given in Table 23. 1981–2010.
Soil moisture deficit peaks in summer
throughout Nelson and Tasman, with
32highest soil moisture deficit observed in Nelson,
whereas runoff peaks in the winter months. Figure 19
shows region-wide variability in days of soil moisture
deficit per year, which further illustrates the dryness of
Nelson and the Waimea Plain compared to other parts
of the region.
Potential evapotranspiration (PET) has been calculated
for Motueka and Nelson using the Penman method
(Penman, 1948). The monthly mean, minimum, and
maximum PET values for these locations are listed in
Table 24.
Table 23. Mean monthly and annual water balance summary for a soil moisture capacity of 150 mm at selected Nelson and Tasman
locations.
Location Jan Feb Mar Apr May Jun Jul Aug Sep Oct Nov Dec Ann
Farewell Spit DE 68 49 26 8 0 0 0 0 0 0 23 37 212
ND 14 12 9 5 1 0 0 0 0 0 5 8 54
RO 1 13 2 27 41 114 82 82 49 35 13 7 467
NR 0 0 0 2 4 10 9 9 6 3 1 1 45
Matakitaki DE 9 19 9 0 0 0 0 0 0 0 6 10 53
ND 2 5 3 0 0 0 0 0 0 0 1 3 15
RO 33 15 8 53 121 187 121 115 145 156 65 50 1070
NR 3 1 1 4 10 15 11 11 11 11 4 4 84
Motueka DE 73 63 26 7 1 0 0 0 0 2 29 50 250
ND 15 15 9 5 1 0 0 0 0 1 6 11 62
RO 6 8 11 48 77 117 120 113 68 52 19 12 651
NR 0 0 1 2 5 8 8 8 6 4 1 1 43
Nelson DE 90 69 34 10 1 0 0 0 0 6 41 64 317
ND 18 16 11 6 1 0 0 0 0 2 9 13 77
RO 3 0 3 14 41 62 61 58 31 20 7 6 306
NR 0 0 0 1 3 6 6 6 3 2 1 0 28
Takaka DE 35 42 14 2 0 0 0 0 0 0 11 19 124
ND 7 10 5 1 0 0 0 0 0 0 3 4 31
RO 35 17 39 105 144 185 168 171 142 131 84 66 1287
NR 1 1 2 4 7 10 9 9 8 6 4 2 64
DE: average amount of soil moisture deficit (mm)
ND: average number of days on which a soil moisture deficit occurs
RO: average amount of runoff (mm)
NR: average number of days on which runoff occurs
33You can also read