Towards an understanding of surface effects: testing of various materials in a small volume measurement chamber and its relevance for atmospheric ...
←
→
Page content transcription
If your browser does not render page correctly, please read the page content below
Atmos. Meas. Tech., 13, 119–130, 2020
https://doi.org/10.5194/amt-13-119-2020
© Author(s) 2020. This work is distributed under
the Creative Commons Attribution 4.0 License.

Towards an understanding of surface effects: testing of various
materials in a small volume measurement chamber and its
relevance for atmospheric trace gas analysis
Ece Satar1,2 , Peter Nyfeler1,2 , Céline Pascale3 , Bernhard Niederhauser3 , and Markus Leuenberger1,2
1 Climateand Environmental Physics, Physics Institute, University of Bern, Bern, Switzerland
2 Oeschger Centre for Climate Change Research, University of Bern, Bern, Switzerland
3 Gas Analysis Laboratory, Federal Institute of Metrology METAS, Bern, Switzerland

Correspondence: Ece Satar (ece.satar@climate.unibe.ch)

Received: 29 April 2019 – Discussion started: 29 July 2019
Revised: 21 October 2019 – Accepted: 10 November 2019 – Published: 13 January 2020

Abstract. A critical issue for the long-term monitoring of at-      spheric measurements are well suited. The investigated coat-
mospheric trace gases is precision and accuracy of the mea-         ings were not superior to untreated aluminum or to stainless
surement systems employed. Both measuring and prepar-               steel at the tested pressure ranges, whereas under changing
ing reference gas mixtures for trace gases are challenging          temperature aluminum showed better performance for CO2
due to, for example, adsorption and desorption of the sub-          (< 0.05 µmol mol−1 change in measured amount fractions)
stances of interest on surfaces; this is particularly critical at   than stainless steel (> 0.1 µmol mol−1 ). To our knowledge,
low amount fractions and/or for reactive gases. Therefore, to       this study is one of the first attempts to investigate surface
ensure the best preparation and measurement conditions for          effects of different materials in such a setup for the above-
trace gases in very low amount fractions, usage of coated ma-       mentioned gases.
terials is in demand in gas metrology and atmospheric mea-
surement communities. This study focuses on testing poten-
tial adsorption and desorption effects for different materials
or coatings that are currently used or that may be relevant         1   Introduction
in the future for the measurements of greenhouse gases. For
this study we used small volume chambers designed to be             Long-term atmospheric monitoring of trace gases requires
used for adsorption studies. Various materials with or with-        great attention to precision and accuracy. In order to achieve
out coatings were loaded into the small cylinder to test their      a high level of compatibility for data obtained at different
adsorption and desorption behavior. We used the aluminum            sites and/or at different times, the World Meteorological Or-
cylinder as the measurement chamber and glass, aluminum,            ganization (WMO) has recommended compatibility goals for
copper, brass, steel and three different commercially avail-        measurements of trace gases within its Global Atmosphere
able coatings as test materials. Inserting the test materials       Watch (GAW) Programme (2016). These challenging limits
into the measurement chamber doubles the available geo-             can be achieved not only by regular calibration with stan-
metric area for the surface processes. The presented exper-         dard gases of known composition, but also by limiting any
iments were designed to investigate the pressure dependency         cause of amount fraction alteration. During their relatively
of adsorption up to 15 bar and its temperature dependency           long lifetime, on the order of decades, standard gas cylin-
up to 80 ◦ C for the test materials placed in the measurement       ders may not be stable due to diffusion, leakage, regulator ef-
chamber. Here, we focused on the species CO2 , CH4 , CO and         fects, gravimetric fractionation and surface processes (Keel-
H2 O measured by a cavity ring-down spectroscopy analyzer.          ing et al., 2007; Langenfelds et al., 2005). The latter, which
Our results show that the materials currently used in atmo-         encompass adsorption and desorption, are also dependent
                                                                    on temperature, pressure and surface properties. Currently

Published by Copernicus Publications on behalf of the European Geosciences Union.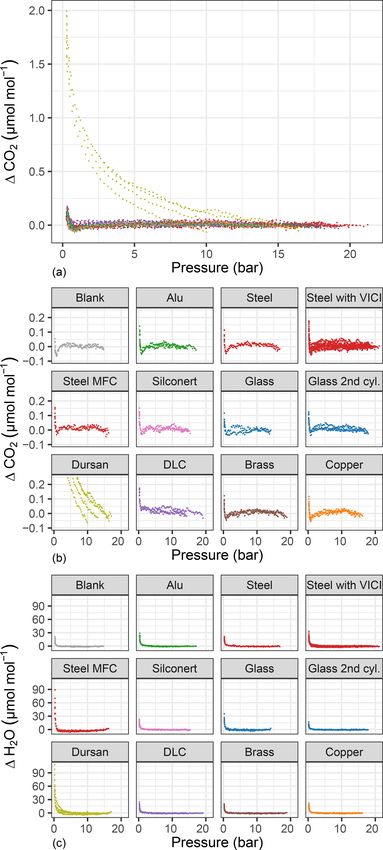
120                                                               E. Satar et al.: Towards an understanding of surface effects

there exists only limited data and a few attempts to quan-          surface losses are critical especially for more reactive gases
tify these surface processes for CO2 and CH4 (Leuenberger           during the preparation of the standards. In the gas metrology
et al., 2015; Miller et al., 2015; Brewer et al., 2018; Schibig     community, this issue has already been investigated in more
et al., 2018). These studies use Langmuir (1918) adsorption         detail, i.e., for species such as ammonia using test tubes with
theory (Leuenberger et al., 2015; Schibig et al., 2018) and         various coatings (Vaittinen et al., 2014), for propane and ben-
Rayleigh fractionation (Schibig et al., 2018) to explain the        zene (Lee et al., 2017), and for monoterpenes in cylinders
enrichment in the amount fractions towards the end of the           (Allen et al., 2018). In their study, Vaittinen et al. (2014) ob-
cylinder lifetime with respect to different flow rates.             served that some of the commercial coatings reduced the ad-
   Key results of the abovementioned studies point out              sorption loss on the stainless steel surface by a factor of 10
that the adsorption behavior is pressure- and temperature-          or more. The atmospheric measurement community makes
dependent. All mentioned studies used larger volume (10,            use of inert coatings of a chemically protective barrier of
29.5 or 50 L) cylinders, which were already in use as standard      amorphous silicon (SilcoTek Corporation) in air core appli-
cylinders. Their approach on filling varied from compressing        cations (Karion et al., 2010; Andersen et al., 2018), where the
natural air (Schibig et al., 2018) to gravimetric preparation       surface-to-volume ratio is large. Diamond-like carbon (DLC)
in synthetic air or in nitrogen (Brewer et al., 2018). In their     coatings are not yet commonly used in trace gas analysis but
study, neither Brewer et al. (2018) nor Schibig et al. (2018)       have found their place in many applications in a range vary-
observed that their passivation treatment for the aluminum          ing from wear and corrosion protection of magnetic storage
cylinder decreased the surface interaction of CO2 .                 media to biological implantations (Grill, 1999).
   Langmuir (1918) defines adsorption as the time lag be-              This study contributes to the limited literature on the
tween the condensation of a molecule and its evaporation            discussion of surface effects of different materials for the
from a surface. The simplest relation which can be linked to        species CO2 , CH4 , CO and H2 O. It is one of the first at-
adsorption is the pressure dependency. At higher pressures,         tempts to systematically investigate the differences among
the gas molecules are pressed to the cylinder walls, where          various materials in a reproducible way using a relatively
they are adsorbed to the cylinder surface. As the pressure          small custom-made aluminum measurement chamber requir-
decreases during the lifetime of a cylinder, these molecules        ing less gas and time for the measurements. In this study,
are desorbed from the surface and lead to an enhancement            we briefly introduce the setup and the established procedure
in the amount fraction of the gas. Changes in temperature           for the measurements. Then, we proceed with eight material
also affect the equilibrium amount fraction of the adsorbed         loadings to the measurement chamber and test their response
molecules by varying temperature-dependent rate constants           to pressure and temperature variations.
of adsorption and desorption.
   In this study, we aim at distinguishing these effects among
various materials under controlled conditions in a previously       2     Data and methods
characterized measurement chamber (Satar et al., 2020). We
limited ourselves to a selection of materials ranging from          2.1    Measurement setup and used materials
materials frequently used in the atmospheric measurement
community to commercially available coatings. Aluminum              In order to understand the adsorption and desorption behav-
cylinders are now the state of the art for the measurements of      ior of various materials, high-pressure (up to 130 bar) and
greenhouse gases such as CO2 and CH4 (WMO, 2018). Al-               small-volume (5 L) cylinders of aluminum and steel were de-
though not recommended anymore for the abovementioned               signed. These cylinders served as measurement chambers in
species, some steel cylinders may still be in use. Addition-        which various test materials can be inserted. Since the alu-
ally, stainless steel pieces are very commonly used as tubing       minum cylinder showed smaller effects with respect to sur-
and in pressure regulators, and they are in contact with the        face effects in the previous study (Satar et al., 2020), we
measured gases. Some regulators are made of brass (WMO,             have chosen to use the aluminum cylinder only for the ma-
2018), and copper is commonly used as seals in vacuum ap-           terial experiments in order to minimize the background ef-
plications of atmospheric trace gas measurements (Behrens           fect related to the measurement chamber. More information
et al., 2008). Moreover, commercially available coatings are        and details on the filling history of the cylinders were previ-
increasingly interesting for both atmospheric measurement           ously explained (Satar et al., 2020). Here we provide a brief
and metrology communities, since with the improvement of            summary: the aluminum cylinder is made of the aluminum
experimental techniques, the demand for higher precision            alloy AlMg1SiCu (EN AW-6061), and its composition is
and accuracy in trace gas analysis is growing.                      specifically chosen so that it corresponds to the aluminum
   The affinity of adsorption and desorption deviates largely       commonly used in the atmospheric measurement commu-
for different species on various surfaces. Some coatings may        nity. This custom-made cylinder consists of three pieces: a
provide inert, corrosion-resistant, or hydrophobic surfaces         body part in the middle with two caps on the sides (Fig. 1a).
and enable usage of metals instead of polymers with ambigu-         These pieces are joined by 12 necked-down bolts on each
ous outgassing effects. According to the current literature,        side, and Inconel X750 seals with a silver coating are placed

Atmos. Meas. Tech., 13, 119–130, 2020                                                   www.atmos-meas-tech.net/13/119/2020/
E. Satar et al.: Towards an understanding of surface effects 121
amount of pure CO gas was injected into a known vol-
ume (60 mL) and was pushed into the sample cylinder us-
ing another compressed air mixture as carrier gas. For ex-
ample, after spiking the mother mixture, the composition
of LUX3575 was 428.59 µmol mol−1 , 1083.73 nmol mol−1 ,
2132.93 nmol mol−1 and < 15 µmol mol−1 for CO2 , CO,
CH4 and H2 O.
Material loadings into the cylinder were conducted as fol-
lows: glass pieces were inserted in order to avoid sharp
metal–metal contact points between the sample pieces and
the cylinder inner surface. These consisted of a ladder and
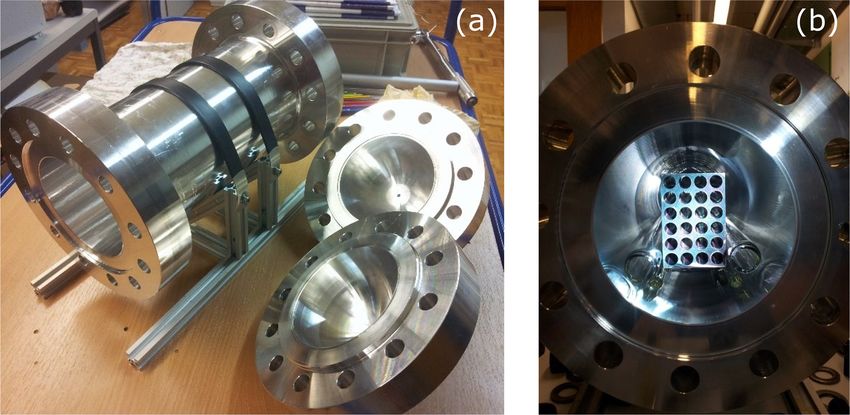
Figure 1. (a) Custom-made cylinder of three pieces. (b) Material
two rod-shaped glass pieces (Fig. 1b). Then, on top of the
loading into the cylinder. The metal blocks are placed on the glass
ladder-shaped glass piece, two metal blocks were placed.
ladder, and two rod-shaped glass pieces support the material from
the sides. Each metal block has the dimensions 100 × 74 × 50 mm and
has 24 drill holes of 1 cm in diameter. The two blocks
have in total comparable (factor of 1.17) geometric area to
the cylinder inner surface. Aluminum (AlMgSi1), copper
in the caps. It is equipped with four stainless steel bellows (CuETP), brass (CuZn39Pb3), steel (316L), and three dif-
sealed valves (SS-4H from Swagelok), where the wetted sur- ferent commercially available coatings on steel (SilcoNert®
faces are solely of stainless steel and do not include any 2000, Dursan® , and CERODEM® diamond-like carbon)
polymers. The connections are from stainless steel and all were used as test materials. Glass pieces and metal blocks
tubing is of electropolished stainless steel with a 0.25 in. without coatings underwent a cleaning procedure consisting
outer diameter. At the outlet, the cylinders are equipped of an ultrasonic bath with a diluted solution of a mildly alka-
with dual-stage pressure regulators made of a stainless steel line commercial cleaning agent (Deconex HT1201) and vac-
body with a polychlorotrifluoroethylene (PCTFE) seat (64- uum oven drying at 120 ◦ C.
3441KA412 from Tescom). Pressure transducers are used at Since the cylinder was exposed to outside air in between
low (PTU-S-AC6-31AC from Swagelok) and high (PTU-S- loadings of different materials, a specific cleaning proce-
AC160-31AC from Swagelok) pressure sides of the pressure dure was applied to eliminate water vapor. The measurement
regulators. Temperature sensors spanning a range from −35 chamber was first pumped down to 0.05 mbar using a dry pis-
to +100 ◦ C (AF25.PT100 from Thermokon) are placed on ton vacuum pump (EcoDry M15 from Leybold), then filled
the outer cylinder surfaces. All measured temperature and with 2 bar of N2 and pumped again while heating with a heat
pressure data were read and logged by a signal converter gun. After three fill–pump–heat cycles of 30 min each, the
(midi logger GL820 from Graphtec). On the measurement cylinder was filled with N2 and left for cooling overnight.
line between the pressure regulator and the Picarro cavity During these heating cycles, the surface temperature of the
ring-down spectroscopy analyzer (CRDS) G2401 either an sample cylinder increased up to 60 ◦ C. The following morn-
electropolished stainless steel 0.25 in. tubing, a mass flow ing, the cylinder was pumped down to 0.05 mbar and filled
controller (358 series from ANALYT-MTC) or a multiport with compressed air through expansion. The desired pressure
valve (EMT2CSD6MWE from VICI AG) was placed. in the small cylinder was achieved by repeating the expan-
The fillings were done using compressed air from sion step several times. An hour was allowed for equilibra-
high-pressure 50 L aluminum cylinders (LUX3586 and tion prior to starting the measurements.
LUX3575). These two cylinders are called the mother cylin-
ders and their air content the mother mixture from here on. 2.2 Measurement sequence and data collection
A mother cylinder was directly connected to a small expan-
sion volume (0.5 L) made of stainless steel (316L-HDF4- Figure 2 shows a scheme of the measurement setup. For each
500 from Swagelok). In addition to the mother mixture, an- material loading, temperature and pressure experiments were
other mixture of comparable content and from a cylinder conducted using the same procedure as before (Satar et al.,
of comparable material and equipment to the mother cylin- 2020). The experiments were conducted using a Picarro
der was measured to check the stability of the measure- G2401 CRDS analyzer enabling measurements of CO2 , CO,
ment device. This mixture (from cylinder LUX3579) is re- CH4 and H2 O. According to the specification sheet of the an-
ferred to as the working gas. All three cylinders were filled alyzer, the 5 min, 1σ standard deviation is < 0.2 µmol mol−1 ,
by Carbagas, Switzerland, with compressed air according < 1.5 nmol mol−1 , < 0.5 nmol mol−1 and < 50 µmol mol−1
to their own protocol. The filling history of the cylinders for the species CO2 , CO, CH4 and H2 O, respectively. In
is known only to the extent that the cylinders were filled order to investigate the material’s pressure dependency, the
with compressed air only. In order to test for higher amount cylinder was filled through expansion from the mother cylin-
fractions of CO, the mother mixtures were spiked: a known der to around 15 bar and was evacuated through the Picarro
www.atmos-meas-tech.net/13/119/2020/ Atmos. Meas. Tech., 13, 119–130, 2020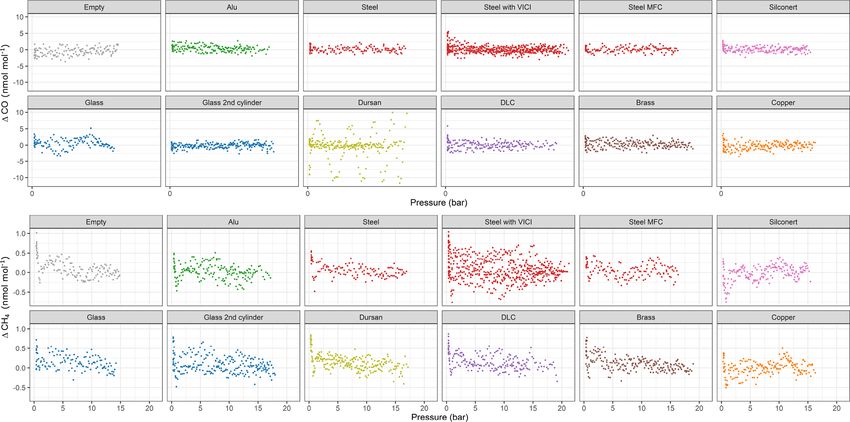
122                                                                   E. Satar et al.: Towards an understanding of surface effects

Figure 2. Schematic of the experimental setup. The aluminum cylinder is placed in the oven (denoted by the red box). The cylinder is filled
through the expansion volume from the mother cylinder. At the outlet of the cylinder, the dashed lines show the three possible paths into the
analyzer: through the rotary valve, direct tubing or mass flow controller (MFC). The equipment related to the cleaning procedure is denoted
in blue.

analyzer. Each sample material loading had at least three                   In order to investigate the temperature dependency, the
replicates for both temperature and pressure runs with the ex-           cylinder was placed into a climate cabinet (Angelantoni ACS
ception of the blank cylinder (Table 1). Bracketing each mea-            Challenge 600) at the Swiss Federal Institute of Metrology
surement, the working gas cylinder was measured to check                 (METAS). The temperature of the cabinet was set to −10, 20,
the stability of the measurement device. The measurement                 50 and 80, with 30 ◦ C increments, heated or cooled within
sequence for an individual loading was established in the fol-           an hour (Fig. 3). The temperature was kept constant for 4 h
lowing order: the first two runs were pressure experiments.              at each level, of which during the last 35 min the material
These were followed by three cycles of temperature experi-               loaded cylinder was measured. These measurements were
ments. Lastly, the cylinder underwent the third pressure ex-             bracketed by working gas measurements which had not expe-
periment. This order enables the detection of any changes                rienced any temperature changes. A multiport valve was used
in pressure response after heating cycles. Table 1 shows an              to switch between the small cylinder and the working gas. A
overview of the experiments presented in this study.                     full temperature cycle lasted 34 h. For the data analysis, for
   For the pressure dependency experiments, data analysis                each temperature step the first 10 min of the measurements
was based on Satar et al. (2020). There was no flow regu-                were not included in order to allow time for equilibration; the
lation after the pressure regulator prior to the analyzer in-            mean of the remaining 25 min was calculated. Then, differ-
let. At the beginning of the experiment the flow rate was                ences for each temperature level were calculated with respect
220 mL min−1 (standard temperature and pressure, STP),                   to the measurements at 20 ◦ C.
and towards the end of the experiment it decreased to
15 mL min−1 (STP). The endpoint of the experiments was
set to a fixed internal parameter of the measurement device              3     Results
called the “outlet valve”. This value can easily be linked to
the outflow from the instrument, which corresponds to about              3.1    Pressure experiments
15 mL min−1 at STP. For better comparability among the
measurements, measured amount fractions were subtracted                  In Fig. 4, an overview of all measured species is shown.
from the mean of the first hour of measurements for each run.            For each run, we calculated the amount fraction differences
In order to eliminate instrumental noise, 5 min means of these           with respect to the initial amount fraction and selected the
differences were calculated. In this study, all reported val-            maximal difference. The maximal difference was chosen to
ues are in amount fraction differences (1CO2 , 1CH4 , 1CO,               highlight the maximum possible effect related to desorp-
1H2 O).                                                                  tion. Since all data were processed using the same crite-

Atmos. Meas. Tech., 13, 119–130, 2020                                                         www.atmos-meas-tech.net/13/119/2020/
E. Satar et al.: Towards an understanding of surface effects 123
Table 1. An overview of data included in this study. The pressure values indicate the pressure in the small cylinder at the beginning of each
replicate run.
Experiment Type Pressure (bar) Number of replicates Mother cylinder
Blank Pressure 13.9; 13.9 2 LUX3575
Blank Temperature 15.8; 15.0; 16.7 3 LUX3586
Glass Pressure 13.3; 13.0 2 LUX3586
Glass Temperature 15.3; 14.7; 14.5 3 LUX3586
Aluminum Pressure 13.6; 13.0; 16.3 3 LUX3575
Aluminum Temperature 15.3; 14.7; 14.7 3 LUX3586
Steel Pressure 16.0; 15.4 2 LUX3586
Steel with VICI Pressure 16.4 - 20.3 7 LUX3586
Steel MFC Pressure 15.5; 15.0 2 LUX3586
Steel Temperature 12.7; 18.5; 18.3 3 LUX3586
SilcoNert® 2000 Pressure 14.5; 13.7; 14.0 3 LUX3586
SilcoNert® 2000 Temperature 13.9; 14.0; 16.1 3 LUX3586
Glass Pressure 17.1; 16.7; 16.0 3 LUX3575
Glass Temperature 16.8; 16.9; 16.7 3 LUX3575
Dursan® Pressure 16.3; 9.2; 15.5; 12.3 4 LUX3575
Dursan® Temperature 15.8; 15.5; 15.0 3 LUX3575
DLC Pressure 13.0; 13.5; 18.3 3 LUX3575
DLC Temperature 13.9; 19.6; 19.5 3 LUX3575
Copper Pressure 15.4; 14.9; 13.4 3 LUX3575
Copper Temperature 15.5; 14.7; 14.6 3 LUX3575
Brass Pressure 18.1; 17.3; 15.4 3 LUX3575
Brass Temperature 18.4; 17.3; 16.9 3 LUX3575
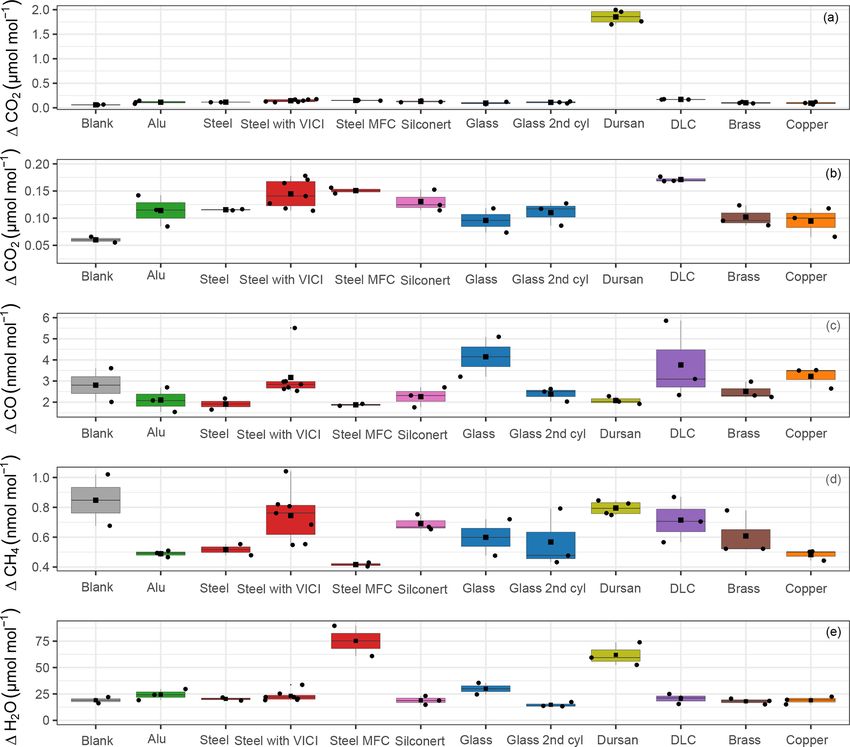
they are denoted by the black points. In Fig. 4a and b, CO2
amount fractions are plotted: Fig. 4a includes all materi-
als, whereas Fig. 4b is a zoomed-in image aiming to dis-
tinguish smaller differences among the material loadings.
For CO2 , we were able to detect significant changes only
for Dursan® , where the final amount fraction was about
10 times higher than all other materials. For CO and CH4 ,
the maximum difference in the amount fractions did not ex-
ceed 6 and 1 nmol mol−1 , respectively. According to the an-
alyzer (Picarro G2401) specification sheet, the 5 min, 1σ
precision of the instrument is < 1.5 and < 0.5 nmol mol−1 ,
whereas the 5 min standard deviation of measured data cor-
responded to 5 and 0.2 nmol mol−1 for CO and CH4 , re-
spectively. Therefore, we have concluded that no significant
change was observed in the final amount fractions for any of
Figure 3. Temperature cycle set at the climate cabinet. the materials during the course of the pressure experiments
for the species CO and CH4 . For H2 O, steel with mass flow
controller and Dursan® loading showed significantly higher
rion, the effects originating from the analyzer are canceled maximal amount fractions, corresponding to about 3-times-
out and we focus on the differences between the materials. higher enhancements than other species.
We grouped replicate runs of each material loading together In order to highlight the changes during the emptying
and showed the calculated maximal differences in the box- of the measurement chamber, we show differences of the
plots. The median is denoted by the horizontal line, whereas measured amount fractions from the initial amount fraction
the mean is shown by the square. Since for most cases only (1CO2 and 1H2 O) with respect to pressure for each material
three replicates are present, the first quartile is the mean of loading (Fig. 5). Figure 5a shows all materials together for
the minimum and the median, whereas the third quartile is CO2 , whereas in Figure 5b and c individual runs are grouped
the mean of the median and the maximum value. For clar- together for each material loading. As indicated in Fig. 2,
ity, data points used for the box plots are also shown and
www.atmos-meas-tech.net/13/119/2020/ Atmos. Meas. Tech., 13, 119–130, 2020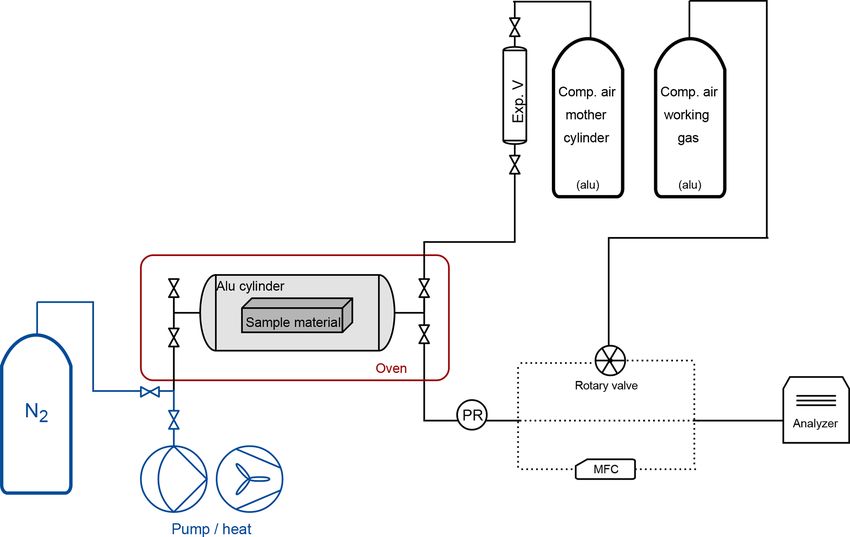
124                                                                  E. Satar et al.: Towards an understanding of surface effects

Figure 4. Box plots for all materials for the species (a) CO2 , (b) zoomed-in image for CO2 , (c) CO, (d) CH4 and (e) H2 O. The y axes show
the maximal amount fraction difference relative to the initial amount fraction. Horizontal lines in each box plot shows the median, whereas
the square in the center of the box is the mean of the maximal amount fractions of the replicates.

we made some changes to the measurement line in order                   taining no CO and CO2 such as synthetic air or N2 would be
to distinguish whether different equipment upstream of the              worthwhile.
analyzer had an influence on the measurements. Therefore,                   For CO2 measurements, the amount fraction differ-
for the steel loading, we show results of the pressure experi-          ences for all materials except Dursan® were less than
ments with a mass flow controller and a multiport valve. For            0.17 µmol mol−1 , with slight differences among the various
CO2 , only Dursan® showed a significant difference as high              loadings. Of this difference, 0.05 µmol mol−1 is related to the
as 1.85 ± 0.14 µmol mol−1 in the final amount fractions. The            blank cylinder (background effect). The blank cylinder corre-
enrichment in the measurements started significantly earlier            sponded to the “14 bar after heating” case presented in Satar
and followed a distinctly different evolution compared to all           et al. (2020). More information on the blank cylinder and its
other tested materials. We do link this enhancement to des-             filling history is provided in the abovementioned publication.
orption from the surface of the material. Besides being resis-          It is also crucial to consider that, during all material block ex-
tant to adsorption of corrosive and reactive media, the coating         periments, glass pieces were also present in the small mea-
layer consists of amorphous silicon, oxygen and carbon (Sil-            surement chamber. When the material runs were compared
coTek Corporation). The desorption from the material to the             to the experiments with glass, except the DLC loading, the
gas mixture is most probably a combination of both desorp-              remaining differences were on the order of 0.02 µmol mol−1 ,
tion of newly adsorbed molecules after the filling and des-             which corresponded to the 5 min standard deviation of the
orption of already existing carbon in the form of CO2 on the            measured data. Moreover, during the evacuation of the mea-
coating. In order to distinguish this difference, fillings con-         surement chamber with the DLC loading, a slightly increas-

Atmos. Meas. Tech., 13, 119–130, 2020                                                       www.atmos-meas-tech.net/13/119/2020/
E. Satar et al.: Towards an understanding of surface effects 125
ing trend of −0.004 µmol mol−1 bar−1 was observed. For
the steel loaded cylinder, the experiments where a multiport
valve was upstream of the analyzer showed slightly more
variation both for final amount fractions and during the pres-
sure run, whereas the mass flow controller employed did not
have a significant effect on the CO2 measurements.
H2 O measurements (Fig. 5) showed greater differ-
ences than CO2 measurements, corresponding to 19.05 ±
2.84 µmol mol−1 for the blank cylinder. Compared to
other materials, Dursan® loading and the measurements
with the mass flow controller showed significantly higher
final amount fractions of 73.71 ± 12.55 and 75.22 ±
14.45 µmol mol−1 , respectively. The difference observed for
the mass flow controller was most probably related to a mem-
ory effect combined with Teflon tape, since it was used for
humid air prior to these measurements. Similar to the CO2
response of Dursan® loading, the increase in H2 O amount
fraction is most probably a combination of both desorption
of newly adsorbed molecules and desorption from the coated
layer. It is unlikely that the enrichment of H2 O is related to
the mother mixture since all other materials resulted in sig-
nificantly lower amount fraction differences.
Since CO and CH4 (Fig. 4c–d) showed no distinct differ-
ences in amount fractions with decreasing cylinder pressure,
we include their analog plots in Fig. A1 for completeness.
Under these extreme conditions of cylinder evacuation, the
observed effects were minimal for most of the investigated
materials. However, the Dursan® loading showing a differ-
ence revealed that the measurement chamber and the estab-
lished procedure were successful in detecting changes.
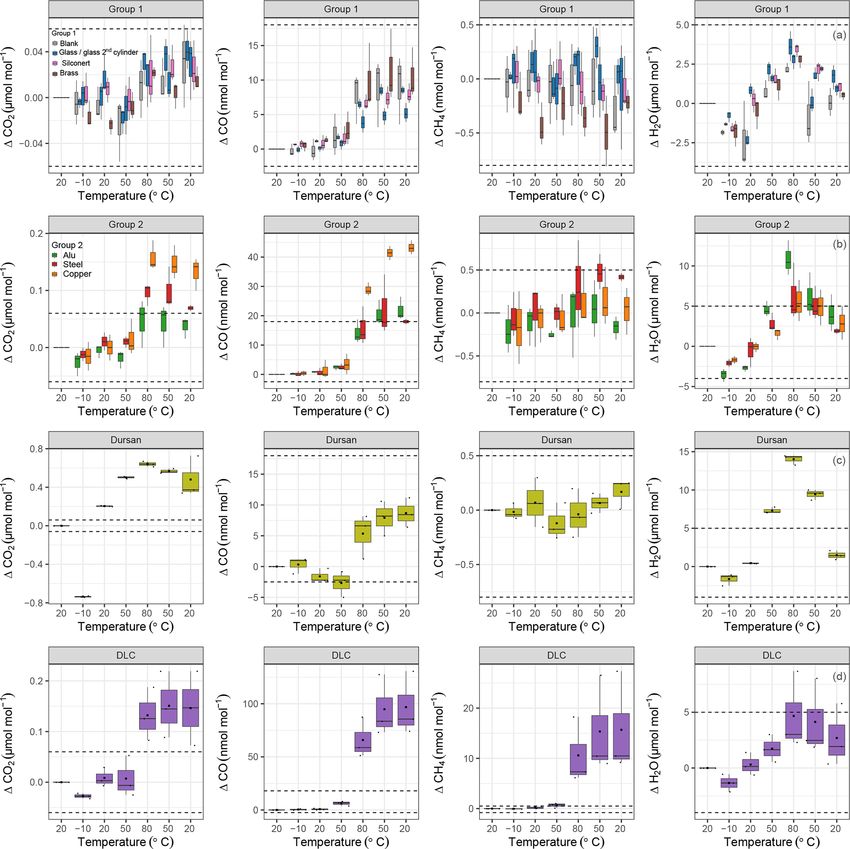
3.2 Temperature experiments
Based on the results of the pressure tests, the temperature
experiments were conducted within a pressure range for
which no pressure effect should occur, with the exception
of Dursan® . In order to graphically distinguish the temper-
ature effect on various materials, data were split into four
different groups (Fig. 6): group 1 corresponded to materials
showing the least response; group 2 were materials show-
ing a significant temperature response; and group 3 and 4
corresponded to Dursan® and DLC separately, since they
showed differences an order of magnitude higher for some
of the measured species. Note that all x axes in Fig. 6
correspond to a temperature cycle. Blank cylinder, glass,
SilcoNert® 2000 and brass loadings (Fig. 6a) showed the
least response to temperature variations between −10 and
80 ◦ C. For CO2 , the observed mean differences per mate-
Figure 5. Amount fraction difference relative to the start of the ex- rial were less than 0.05 µmol mol−1 . However, this difference
periment for (a, b) CO2 and (c) H2 O with respect to pressure for all was as high as 11 nmol mol−1 for CO. At 80 ◦ C, there was
tested materials. (a) shows all materials together, whereas in (b, c) a clear change in the amount fractions of CO, whereas this
each material is plotted separately. Consistent color codes are used step change was not as clear in CO2 measurements. The rea-
throughout the study. son for this behavior is most probably related to the cylin-
der itself, which points to an irreversible chemical reaction,
since the enhancement in amount fraction remained promi-
www.atmos-meas-tech.net/13/119/2020/ Atmos. Meas. Tech., 13, 119–130, 2020126 E. Satar et al.: Towards an understanding of surface effects nent even when the cylinder was cooled back down to 20 ◦ C. effect of less than 0.25 µmol mol−1 . Even when this differ- For CH4 , temperature variations resulted in nonsignificant ence was considered, the temperature effect of this material amount fraction differences, and they stayed in a narrow was an order of magnitude greater than group 1 materials at range from −0.75 to 0.5 nmol mol−1 . All material loadings 80 ◦ C. Whereas at 20 ◦ C at the end of the temperature cy- showed an effect with respect to H2 O measurements. This cle, the pressure contribution was as high as 0.5 µmol mol−1 . effect was reversible: lower H2 O amount fractions were ob- CO and CH4 did not show any significant difference in their served at colder temperatures and higher amount fractions at response compared to group 1 and group 2 materials. H2 O higher temperatures. This is an indication of adsorption and measurements were higher than in the other groups but re- desorption, in which at colder temperatures the desorption versible. rate is lower, and the system equilibrates at lower amount The DLC loading clearly showed a different temperature fractions in the gas mixture. As the temperature increases, response compared to all other materials, especially with re- the desorption rate increases, resulting temporally in higher gard to the variability of its replicates. CO2 showed a mean amount fractions in water vapor. For the first group of ma- difference of 0.15±0.04 µmol mol−1 compared to the begin- terials, H2 O measurements were within the range of −5 to ning of the cycle. For CO and CH4 , the differences from 5 µmol mol−1 . After cooling the cylinder to 20 ◦ C, a slight the starting amount fractions were 10 and 20 times larger change of 1 µmol mol−1 compared to the initial amount frac- than the differences observed for other tested materials. At tion was observed. each temperature cycle, the measured CO difference at 80 ◦ C Figure 6b shows steel, aluminum and copper. These load- decreased for the first and last cycle; this difference corre- ings showed a more significant temperature response com- sponded to 87 and 51 nmol mol−1 , respectively. This feature pared to group 1. Note that the dashed lines represent the was observed in CH4 and H2 O measurements as well. During ranges from the first group of materials. For CO2 , all mate- the first temperature cycle at 80 ◦ C, CH4 and H2 O showed an rials showed a clear increase when the temperature was in- increase of 18 nmol mol−1 and 8 µmol mol−1 , whereas dur- creased to 80 ◦ C. This increase corresponded to 0.16 ± 0.02, ing the third temperature cycle CH4 and H2 O showed an in- 0.10±0.01 and 0.05±0.02 µmol mol−1 for copper, steel and crease of 6 nmol mol−1 and 3 µmol mol−1 , respectively. This aluminum, respectively. After cooling back to 20 ◦ C, the behavior in DLC measurements showed that the underlying amount fraction increase in aluminum and steel dropped reason of the enhancement in the amount fractions was the back to less than 0.07 µmol mol−1 , whereas for copper the substances on the surface of the DLC coating, which were difference persisted and was 0.13 ± 0.02 µmol mol−1 . For depleted by repeated heating. According to Grill (1999), ther- CO, the effects were even more significant. At 80 ◦ C, 1CO mal relaxation of the DLC film may occur at temperatures as for the copper loading increased to 29 ± 1 nmol mol−1 , and low as 100 ◦ C. it was followed by 16 ± 4 and 14 ± 2 nmol mol−1 for alu- Moreover, it should be noted that, during the set of the minum and steel, respectively. Aluminum and steel load- measurements presented in this study, the aluminum cylinder ings reached their maximum increase at 50 ◦ C after cooling experienced the temperature cycle 30 times. This presumably down from 80 ◦ C and stayed at that level even with further resulted in a change of the background effect over the course cooling. The increase in CO amount fraction for the cop- of the presented analysis in the range of 0.04 µmol mol−1 . We per loading continued and reached 43 ± 1 nmol mol−1 . This measured the blank cylinder at the very beginning and at the might be an indication of an irreversible chemical reaction end of the material set. The blank cylinder result shown in the happening after the threshold of 80 ◦ C which uses copper Fig. 6a is a mean of the former and latter temperature experi- as a catalyst. This is further supported by the fact that the ments, which therefore resulted in a higher variation. Due to amount fraction enhancement after each temperature cycle the observed variation, we did not subtract the background was reproducible. Similarly to the first group, CH4 mea- to avoid disturbing other measurements. More detailed in- surements of the second group stayed in the narrow win- formation on heating experiments and its consequences were dow of −0.75 to 0.5 nmol mol−1 . For H2 O, group 2 mate- presented in Satar et al. (2020). rials showed a slightly greater effect than group 1 materials, with a mean of 7.55±2.88 µmol mol−1 at 80 ◦ C, and reached 11 ± 1 µmol mol−1 for aluminum. After cooling to 20 ◦ C, a 4 Discussion difference over 2 µmol mol−1 compared to the beginning was observed. The presented setup enabled the investigation of surface ef- Figure 6c–d show Dursan® and DLC on separate panels fects under extreme conditions which favored adsorption and for each of the measured species. For CO2 , Dursan® showed desorption. Compared to common usage in the atmospheric differences as high as 0.64 ± 0.02 µmol mol−1 . A fraction of measurement and gas metrology communities, our study has this difference was related to the pressure decrease of the differed in cylinder size, geometric-surface-to-volume ra- cylinder from 15 to 5 bar. However, during most of the tem- tios, and pressure and temperature ranges. Previous studies perature cycle including measurements at 80 ◦ C, the pressure (Leuenberger et al., 2015; Brewer et al., 2018; Schibig et al., in the cylinder was over 9.5 bar, corresponding to a pressure 2018) investigating surface effects in compressed gas cylin- Atmos. Meas. Tech., 13, 119–130, 2020 www.atmos-meas-tech.net/13/119/2020/
E. Satar et al.: Towards an understanding of surface effects                                                                            127

Figure 6. Temperature experiments grouped according to temperature response. (a) Group 1 materials are blank cylinder (gray), glass
(blue), SilcoNert® 2000-coated steel (pink), and brass (brown). (b) Group 2 materials are aluminum (green), stainless steel (red), and copper
(orange). (c) Dursan® (light green) and (d) DLC (purple) coatings on stainless steel. Dashed lines indicate the same ranges for each species.
The x axes correspond to the temperature cycles (cf. Fig. 3), and the y axes show the amount fraction differences relative to the first
measurement block at 20 ◦ C.

ders have used (50, 10 or 29.5 L) cylinders. The geometric               minum cylinder further increased the surface area. There-
surface of the small (5 L) aluminum cylinder used in this                fore, the setup allows one to test materials under increased
study is 0.18 m2 , which results in a surface-to-volume ratio            surface-to-volume ratios in which the surface effects should
of 35.7 for the unloaded cylinder. Compared to 29.5 L Luxfer             be stronger and dominant. However, despite our efforts of
cylinders, the small cylinders are estimated to be more prone            increasing the surface material the effects were minor.
to adsorption by 40 %. Inserting material blocks into the alu-

www.atmos-meas-tech.net/13/119/2020/                                                           Atmos. Meas. Tech., 13, 119–130, 2020
128                                                                E. Satar et al.: Towards an understanding of surface effects

   In addition to the properties of the materials, pressure and         These experiments show that all coatings do not necessar-
temperature play a role on surface effects. The following as-        ily enable more passive surfaces and might result in enhance-
sumption lies behind the pressure experiments: if the mate-          ments when exposed to pressure and temperature changes.
rial has adsorbed a significant amount of gas while filling the      Materials currently used by the atmospheric measurement
cylinder, this should be desorbed towards the end of the ex-         community for storing standard gases are well suited under
periments controlled by desorption. The onset of the desorp-         80 ◦ C, which are typical utilization temperatures. Moreover,
tion for all tested materials except Dursan® and partly DLC          the materials presented in this study are not only relevant for
was observed well below atmospheric pressures.                       measurements of standard gases, but also of interest for other
   Increasing temperature is expected to facilitate desorption       gas handling and measuring applications.
by providing the required energy to desorb the gas molecules
from the surface and mix into the gas phase. On the contrary,
cooling the cylinder and its content favor adsorption, and it        Data availability. Data can be obtained upon request. Please con-
is expected that this results in a decrease in the measured          tact Markus Leuenberger (markus.leuenberger@climate.unibe.ch).
amount fraction.
   Testing pieces cut from the aluminum and steel cylinders
commonly used in the community would be a valuable ad-
dition to enable direct comparison between the commonly
used cylinder materials and the produced material blocks at
low pressures and high temperatures. Moreover, in order to
observe significant surface effects, materials of very high sur-
face areas can be inserted into the measurement chamber.
Some ideas would be using thin metal plates, metal spheres
or metal pieces resulting from manufacturing processes (e.g.,
metal chips).

5   Conclusions

We have presented the pressure- and temperature-dependent
response of the species CO2 , CH4 , CO and H2 O with respect
to glass, aluminum, copper, brass, steel and three different
commercially available coatings on stainless steel (Dursan®
, SilcoNert® 2000 and DLC). For the pressure response, un-
der the circumstances of our experimental setup and proce-
dure, within the absolute pressure range varying from 15 bar
to 200 mbar, we were only able to detect changes for CO2
in the loading with Dursan® -coated stainless steel reach-
ing 2 µmol mol−1 enrichment in the amount fractions. All
other materials showed effects less than 0.17 µmol mol−1 for
CO2 . Under exposure to temperatures from −10 to 80 ◦ C,
the responses of glass, brass and SilcoNert® 2000-coated
steel were minimal, whereas DLC and Dursan® showed dis-
tinctly different temperature effects than all other tested ma-
terials. For most materials, including stainless steel, copper,
aluminum, DLC and Dursan® , a step change in the measured
amount fractions was observed after 80 ◦ C.

Atmos. Meas. Tech., 13, 119–130, 2020                                                    www.atmos-meas-tech.net/13/119/2020/
E. Satar et al.: Towards an understanding of surface effects                                                                  129

Appendix A

Figure A1. Amount fraction differences compared to the start of the experiment for CO and CH4 for all tested materials.

www.atmos-meas-tech.net/13/119/2020/                                                         Atmos. Meas. Tech., 13, 119–130, 2020
130                                                                   E. Satar et al.: Towards an understanding of surface effects

Author contributions. ML and ES designed the project. ES per-           Grill, A.: Diamond-like carbon: state of the art, Diam. Relat. Mater.,
formed all measurements and wrote the draft of the paper. CP and          8, 428–434, https://doi.org/10.1016/S0925-9635(98)00262-3,
BN helped with the selection of gases to be studied and provided          1999.
access to the laboratories and technical units of METAS. PN helped      Karion, A., Sweeney, C., Tans, P., and Newberger,
set up the measurement system and solved technical problems. All          T.: AirCore: An Innovative Atmospheric Sampling
were actively involved with the final version of the paper.               System, J. Atmos. Ocean. Tech., 27, 1839–1853,
                                                                          https://doi.org/10.1175/2010JTECHA1448.1, 2010.
                                                                        Keeling, R. F., Manning, A. C., Paplawsky, W. J., and Cox,
Competing interests. The authors declare that they have no conflict       A. C.: On the long-term stability of reference gases for at-
of interest.                                                              mospheric O2 /N2 and CO2 measurements, Tellus B, 59, 3–14,
                                                                          https://doi.org/10.1111/j.1600-0889.2006.00228.x, 2007.
                                                                        Langenfelds, R. L., van der Schoot, M. V., Francey, R. J.,
Acknowledgements. This project is supported by a research con-            Steele, L. P., Schmidt, M., and Mukai, H.: Modifica-
tract (F-5232.30052) between the Swiss Federal Institute of Metrol-       tion of air standard composition by diffusive and sur-
ogy (METAS) and the University of Bern as well as the SNF                 face processes, J. Geophys. Res.-Atmos., 110, D13307,
project Klima- und Umweltphysik: Isotope im Erdklimasystem                https://doi.org/10.1029/2004JD005482, 2005.
(icoCEP)(SNF-200020_172550). The authors would like to thank            Langmuir, I.: The adsorption of gases on plane surfaces of
the workshop of the University of Bern for the production of the          glass, mica and platinum, J. Am. Chem. Soc., 40, 1361–1403,
cylinders, as well as METAS Gas Analysis Laboratory and METAS             https://doi.org/10.1021/ja02242a004, 1918.
workshop for their technical support during this work.                  Lee, S., Kim, M. E., Oh, S. H., and Kim, J. S.: Determination
                                                                          of physical adsorption loss of primary standard gas mixtures
                                                                          in cylinders using cylinder-to-cylinder division, Metrologia, 54,
                                                                          L26 to L33, https://doi.org/10.1088/1681-7575/aa87b8, 2017.
Financial support. This research has been supported by the Federal
                                                                        Leuenberger, M. C., Schibig, M. F., and Nyfeler, P.: Gas adsorp-
Institute of Metrology METAS (grant no. F-5232.30052) as well as
                                                                          tion and desorption effects on cylinders and their importance
Isotope im Erdklimasystem (icoCEP; SNF-200020_172550).
                                                                          for long-term gas records, Atmos. Meas. Tech., 8, 5289–5299,
                                                                          https://doi.org/10.5194/amt-8-5289-2015, 2015.
                                                                        Miller, W. R., Rhoderick, G. C., and Guenther, F. R.: Inves-
Review statement. This paper was edited by Brigitte Buchmann              tigating Adsorption/Desorption of Carbon Dioxide in Alu-
and reviewed by three anonymous referees.                                 minum Compressed Gas Cylinders, Anal. Chem., 87, 1957–
                                                                          1962, https://doi.org/10.1021/ac504351b, 2015.
                                                                        Satar, E., Nyfeler, P., Bereiter, B., Pascale, C., Niederhauser, B.,
                                                                          and Leuenberger, M.: Investigation of adsorption and desorption
References                                                                behavior of small-volume cylinders and its relevance for atmo-
                                                                          spheric trace gas analysis, Atmos. Meas. Tech., 13, 101–117,
Allen, N. D. C., Worton, D. R., Brewer, P. J., Pascale, C., and
                                                                          https://doi.org/10.5194/amt-13-101-2020, 2020.
  Niederhauser, B.: The importance of cylinder passivation for
                                                                        Schibig, M. F., Kitzis, D., and Tans, P. P.: Experiments with CO2 -
  preparation and long-term stability of multicomponent monoter-
                                                                          in-air reference gases in high-pressure aluminum cylinders, At-
  pene primary reference materials, Atmos. Meas. Tech., 11, 6429–
                                                                          mos. Meas. Tech., 11, 5565–5586, https://doi.org/10.5194/amt-
  6438, https://doi.org/10.5194/amt-11-6429-2018, 2018.
                                                                          11-5565-2018, 2018.
Andersen, T., Scheeren, B., Peters, W., and Chen, H.: A
                                                                        Vaittinen, O., Metsälä, M., Persijn, S., Vainio, M., and
  UAV-based active AirCore system for measurements of
                                                                          Halonen, L.: Adsorption of ammonia on treated stainless
  greenhouse gases, Atmos. Meas. Tech., 11, 2683–2699,
                                                                          steel and polymer surfaces, Appl. Phys. B, 115, 185–196,
  https://doi.org/10.5194/amt-11-2683-2018, 2018.
                                                                          https://doi.org/10.1007/s00340-013-5590-3, 2014.
Behrens, M., Schmitt, J., Richter, K.-U., Bock, M., Richter,
                                                                        WMO: 19th WMO/IAEA Meeting of Experts on Carbon Diox-
  U. C., Levin, I., and Fischer, H.: A gas chromatogra-
                                                                          ide Concentration and Related Tracers Measurement Techniques
  phy/combustion/isotope ratio mass spectrometry system for
                                                                          (GGMT 2017), Dübendorf, Switzerland, 27–31 August 2017,
  high-precision δ 13 C measurements of atmospheric methane ex-
                                                                          Tech. Rep. GAW Report No. 242, World Meteorological Organi-
  tracted from ice core samples, Rapid Commun. Mass Spectrom.,
                                                                          zation, Geneva, Switzerland, 2018.
  22, 3261–3269, https://doi.org/10.1002/rcm.3720, 2008.
Brewer, P. J., Brown, R. J. C., Resner, K. V., Hill-Pearce, R. E.,
  Worton, D. R., Allen, N. D. C., Blakley, K. C., Benucci, D.,
  and Ellison, M. R.: Influence of Pressure on the Composition
  of Gaseous Reference Materials, Anal. Chem., 90, 3490–3495,
  https://doi.org/10.1021/acs.analchem.7b05309, 2018.

Atmos. Meas. Tech., 13, 119–130, 2020                                                        www.atmos-meas-tech.net/13/119/2020/
You can also read