Effects of Weather on Coronavirus Pandemic - MDPI
←
→
Page content transcription
If your browser does not render page correctly, please read the page content below
International Journal of
           Environmental Research
           and Public Health

Article
Effects of Weather on Coronavirus Pandemic
Qasim Bukhari 1, *, Joseph M. Massaro 2 , Ralph B. D’Agostino, Sr. 3 and Sheraz Khan 1,4,5
 1    McGovern Institute for Brain Research, Massachusetts Institute of Technology (MIT), Cambridge,
      MA 02139, USA; skhan7@mgh.harvard.edu
 2    Department of Biostatistics, Boston University School of Public Health, Boston, MA 02215, USA;
      jmm@math.bu.edu
 3    Department of Mathematics and Statistics, Boston University, Boston, MA 02215, USA; ralph@bu.edu
 4    Department of Radiology, Massachusetts General Hospital, Harvard Medical School, Boston, MA 02114, USA
 5    Athinoula A. Martinos Center for Biomedical Imaging, Massachusetts General Hospital, Harvard Medical
      School, Massachusetts Institute of Technology, 149 13th Street, CNY-2275, Boston, MA 02129, USA
 *    Correspondence: qbukhari@mit.edu

 Received: 18 June 2020; Accepted: 24 July 2020; Published: 27 July 2020

 Abstract: The novel coronavirus (SARS-CoV-2) has spread globally and has been declared a pandemic
 by the World Health Organization. While influenza virus shows seasonality, it is unknown if
 COVID-19 has any weather-related affect. In this work, we analyze the patterns in local weather of
 all the regions affected by COVID-19 globally. Our results indicate that approximately 85% of the
 COVID-19 reported cases until 1 May 2020, making approximately 3 million reported cases (out of
 approximately 29 million tests performed) have occurred in regions with temperature between 3 and
 17 ◦ C and absolute humidity between 1 and 9 g/m3 . Similarly, hot and humid regions outside these
 ranges have only reported around 15% or approximately 0.5 million cases (out of approximately
 7 million tests performed). This suggests that weather might be playing a role in COVID-19 spread
 across the world. However, this role could be limited in US and European cities (above 45 N),
 as mean temperature and absolute humidity levels do not reach these ranges even during the peak
 summer months. For hot and humid countries, most of them have already been experiencing
 temperatures >35 ◦ C and absolute humidity >9 g/m3 since the beginning of March, and therefore
 the effect of weather, however little it is, has already been accounted for in the COVID-19 spread
 in those regions, and they must take strict social distancing measures to stop the further spread of
 COVID-19. Our analysis showed that the effect of weather may have only resulted in comparatively
 slower spread of COVID-19, but not halted it. We found that cases in warm and humid countries
 have consistently increased, accounting for approximately 500,000 cases in regions with absolute
 humidity >9 g/m3 , therefore effective public health interventions must be implemented to stop the
 spread of COVID-19. This also means that ‘summer’ would not alone stop the spread of COVID-19 in
 any part of the world.

 Keywords: coronavirus; humidity; temperature; tropical; COVID-19; COVID; weather

1. Introduction
     In the beginning of 2020, several cases of novel coronavirus, called as 2019-nCoV or COVID-19,
appeared across China [1,2]. The disease quickly spread to other regions, due to its highly transmissive
nature [3] and increased global mobility, and was declared a pandemic by the World Health Organization
on 11 March 2020 [4].
     Human coronaviruses have been associated with a wide spectrum of respiratory diseases in
different studies [5–9]. Influenza viruses have been observed to follow a seasonal pattern [10,11] and
SARS-Cov-1, (a type of coronavirus), was also found to lose its ability to survive longer at higher

Int. J. Environ. Res. Public Health 2020, 17, 5399; doi:10.3390/ijerph17155399   www.mdpi.com/journal/ijerph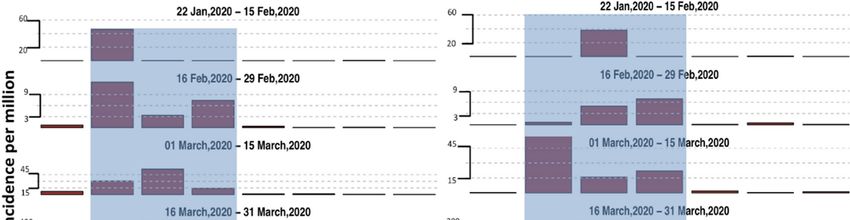
Int. J. Environ. Res. Public Health 2020, 17, 5399                                                   2 of 13

temperatures [12], which may be due to the breakdown of their lipid layer at higher temperatures [13].
Some seasonality has also been observed for other coronaviruses [14] however it remains unclear how
COVID-19 will vary with changes in climatic conditions, since it is the very first time that it emerged in
the human population. Initial reports from China [15–17] found conflicting results on the relationship
of weather patterns with COVID-19 cases.
      There have been stark differences in temperatures and humidity between countries that are affected
worse by the COVID-19 pandemic and those that escaped a similar scale of outbreak. The temperature
and humidity ranges that seem to correspond to lower reported incidence rates, are geographically
found between 30 N and 30 S which are circles of latitude that are 30 degrees north and south of the
Earth’s equatorial plane, respectively. The lack of large numbers of cases in the countries between 30 S
and 30 N (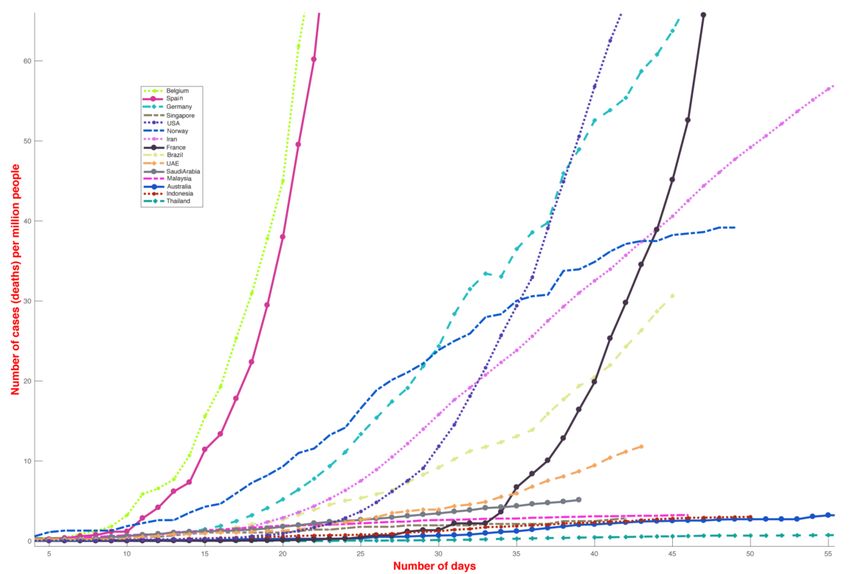
Int. J. Environ. Res. Public Health 2020, 17, 5399                                                3 of 13

the weather data from the busiest airport to approximate the weather of that state/country (for example,
Logan Airport for Massachusetts, USA and Icheon of South Korea).

2.2. COVID-19 Cases
   The data on confirmed Covid-19 cases for each country and state (where available) were
downloaded from John Hopkins University Coronavirus Resource Center repository on 1 May 2020.

2.3. Relation Between COVID-19 Cases and Weather
     For visualizing, we divided the entire data in six periods (period 1—20 Jan 2020 to 15 Feb 2020,
period 2—16 Feb 2020 to 29 Feb 2020, period 3—1 March 2020 to 15 March 2020, period 4—16 March
2020 to 30 March 2020, period 5—1 April 2020 to 15 April 2020 and period 6—16 April 2020 to 1 May
2020). For each period, we obtained the number of new confirmed Covid-19 cases and analyzed the
weather data of all the countries/states in which new cases were observed to uncover the relationship
between COVID-19 outbreak and weather.

3. Results and Discussion
     The analysis presented in this paper provides a direct comparison between the number of
COVID-19 cases globally and local environmental conditions and is motivated by the significant
differences in the reported incidence COVID-19 cases among different countries (Figure 1) as well as
different US states (Figure 2). Countries and states experiencing high incidence rates such as Italy,
France, Germany, New York, Massachusetts and other northern US states exhibit weather patterns
similar to the original hotspots of Hubei and Hunan, with mean temperatures between 3 and 10 ◦ C
in February and March (Figure 1). On the contrary, countries with warmer humid climates such
as Malaysia, Thailand and other South-East Asian countries (Figure 1) exhibit a lower growth rate.
This divide is even visible within the US (Figure 2). The demographic and other weather information
of countries mentioned in Figure 1 is reported in Table S1, where the largest cities data are used for
average dew point and temperature values. The number of COVID-19 deaths for selected different
countries (until 1 May 2020) has been shown in Figure 3.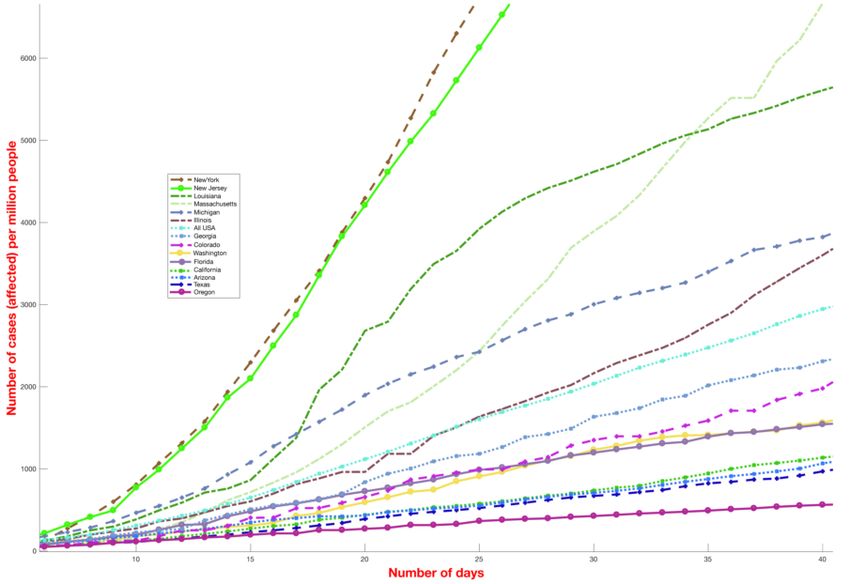
France, Germany, New York, Massachusetts and other northern US states exhibit weather patterns
similar to the original hotspots of Hubei and Hunan, with mean temperatures between 3 and 10 °C
in February and March (Figure 1). On the contrary, countries with warmer humid climates such as
Malaysia, Thailand and other South-East Asian countries (Figure 1) exhibit a lower growth rate. This
divide is even visible within the US (Figure 2). The demographic and other weather information of
countries
Int. J. Environ. mentioned
Res. Public in Figure
Health 2020, 1 is reported in Table S1, where the largest cities data are used for
17, 5399 4 of 13
average dew point and temperature values. The number of COVID-19 deaths for selected different
countries (until 1 May 2020) has been shown in Figure 3.
Figure 1. Incidence curve of COVID-19 cases for different countries (until 1 May 2020). The figure
Figure 1. Incidence curve of COVID-19 cases for different countries (until 1 May 2020). The figure
shows the total number of cases (normalized by the population of the country) starting from 5 persons
shows the affected
total number of cases
per million. (normalized
Different by the
regions and states population
clearly of theincidence
follow different country)curves.
starting from 5 persons
The y-axis
affected per Res.
Int. J. Environ. million.
Public Different
Health 2020,regions
17, x and states clearly follow different incidence curves. The y-axis 4 of 13
has been capped at 600 cases per million. The countries were chosen as the top 9 countries from
cold and has been
dry capped
weather at and
600 cases
top 10perfrom
million.
hotThe
and countries
humid were chosen
weather byas1 the top The
May. 9 countries fromare
countries coldlisted
and dry weather and top 10 from hot and humid weather by 1 May. The countries are listed in Table
in Table S1, together with their classification of hot, humid/cold, dry and other demographics and
S1, together with their classification of hot, humid/cold, dry and other demographics and weather
weather information.
information.
FigureFigure 2. Incidence
2. Incidence curve
curve of of COVID-19cases
COVID-19 casesfor
for different
different US
USstates
states(until
(until1 May
1 May 2020). The The
2020). figure
figure
showsshows the total
the total number
number of cases
of cases (normalizedby
(normalized bythe
the population
population ofofthe
thestate) starting
state) from
starting 20 persons
from 20 persons
affected
affected per million.
per million. TheThe y-axis
y-axis hashas beencapped
been cappedatat6000
6000 cases
casesper
permillion.
million.
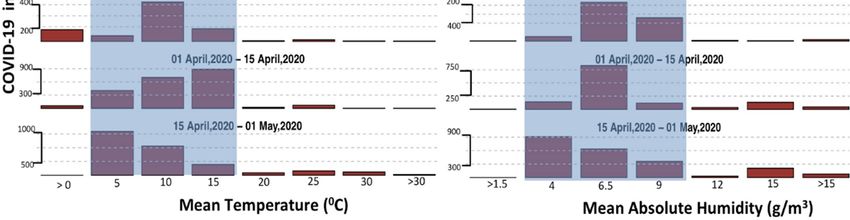
Our analysis shows that for each 10-day period between 22 January 2020 and 1 May 2020 the
maximum number of new cases are reported in regions with mean temperature between 0 to 17 °C
and absolute humidity between 1 and 9 g/m3. The data to date show that the number of cases for
temperature >17 °C and absolute humidity >9 g/m3 is low throughout for each time period (Figure 4).
After 11 March, we observe a surge in the number of cases in regions with temperature >17 °C,
however it is still many times lower than the surge in cases 15 °C (Figure 4). The sudden increase in
the number of cases in regions with temperature >17 °C could be due to several reasons, including
recent initiation of large-scale COVID-19 testing in India, Brazil, Indonesia and Pakistan or analysis
of backdated samples (Florida, US) [21,22] (discussed subsequently). However, over time, this surge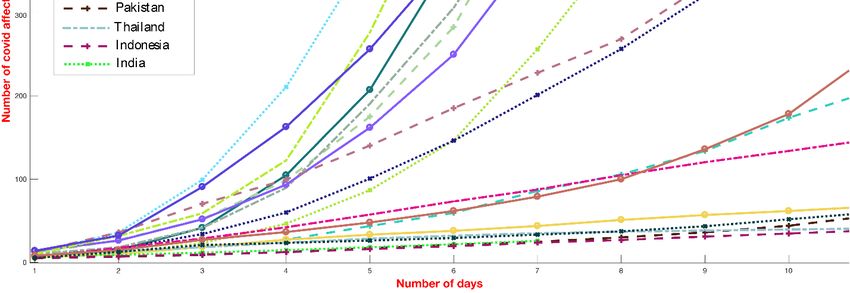
Int. J. Environ. Res. Public Health 2020, 17, 5399 5 of 13
Int. J. Environ. Res. Public Health 2020, 17, x 6 of 13
Figure
Figure 3. Cumulative
3. Cumulative death
death rate
rate curveofofCOVID-19
curve COVID-19 deaths
deathsfor
forselect different
select countries
different (until
countries 1 May
(until 1 May
2020).2020).
The The figure
figure shows
shows thethe totalnumber
total numberof of deaths
deaths (normalized
(normalizedbyby thethe
population of the
population of country).
the country).
Different regions and states clearly follow different curves of death rate. The y-axis has been capped
Different regions and states clearly follow different curves of death rate. The y-axis has been capped at
at 60 cases per 1,000,000 population.
60 cases per 1,000,000 population.
It could be argued that countries between 30 S and 30 N are in the early phase of the pandemic
Our analysis shows that for each 10-day period between 22 January 2020 and 1 May 2020 the
where the incidence rate appears linear and would pick up only after hundreds of cases have been ◦
maximum number of new cases are reported in regions with mean temperature between 0 to 17 C
reported, a phenomena observed for several countries including the US, Italy, and Spain. It is possible
and absolute
that severalhumidity
countries between
will see 1an and 9 g/m3 . The
exponential growth data to date
soon show
if they that
are in thethe number
initial phaseofofcases
the for
temperature
pandemic. >17 ◦ C and absolute
However, for several countries>9
humidity g/m
such
3 is low throughout
as Australia, Malaysia, for each time
Thailand periodArabia
and Saudi (Figure 4).
After that
11 March, we observe
have reported morea than
surge1500
in the number
cases, of casesofindays
the number regions with
it took temperature
to reach >17 ◦isC,much
these levels however
slower than European countries and American ◦
it is still many times lower than the surge in cases 15 C (Figure 4). The sudden increase in theand
states. The incidence rate in Indonesia, Vietnam number
Cambodia
of cases is also
in regions withlow, but we do not
temperature >17discuss
◦ C couldthem behere
duedue to an inadequate
to several number ofrecent
reasons, including testinginitiation
per
capita. Furthermore,
of large-scale COVID-19intesting
Figure 1,
in we compared
India, Brazil,theIndonesia
top nine cold
andand dry countries
Pakistan with the
or analysis top 10
of backdated
hot and humid countries by April 1. This gives them enough weeks to multiply their already high
samples (Florida, US) [21,22] (discussed subsequently). However, over time, this surge in cases in the
number of reported cases in the coming weeks. However, as the graph shows, several of these
hot and humid countries died out, and the exponential growth was not sustained, despite no strict
countries in hot and humid places showed a much slower incidence growth.
lockdownItmeasures
could alsobeing put in
be argued place
that by the respective
the government in thesegovernments. Our exceptional
countries is taking initial workmeasures
[23] submitted
to
to SSRNstopwebsite indicated
the spread caseswhich
of the virus, untilweMarch
know30 is only, andUntil
not true. we raised
March points
26, 2020,that
mostUAE and
Asian Malaysia
and African may
look more likewere
countries coldworking
dry countries and
business the next
as usual. fewthe
India, weeks would
2nd most make country
populous this more clear.
in the However,
world, started now,
whenaseveral
lockdown weeks have passed,
on March 26, 2020 itand
is evident
Indonesia that
(4ththe number
most of cases
populous in UAE
country) did and Malaysia have
not implement any not
lockdown
increased until very
as rapidly as in recently
countries [28]. Even
with coldthough
and dry theweather.
proportion of tests across all the countries
between 30 S and 30 N are much lower than the countries above 30 N, the fraction of confirmed cases,
that is, 500,000 positive cases out of around 7 million tests performed [29] (approximately 6 out of
100) is lower for countries between 30 S and 30 N than countries above 30 N, that performed around
29 million tests and found approximately 3 million positive COVID-19 cases [29] (approximately 10
out of 100) as of May 3, 2020. If countries between 30 S and 30 N were only testing highly symptomatic
people, the proportional of confirmed cases should have been higher and not lower. Therefore, the
lower number of cases to date, in the densely populated countries between 30 and 30 N (combined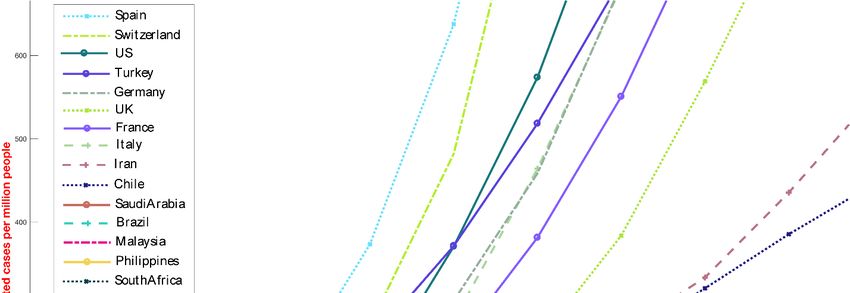
role of environmental factors in the spread of COVID-19 is worth exploring. Data until 1 May 2020
(Figure 4) reveal that 85% of the COVID-19 cases have been recorded in the regions within a
temperature range of 0 to 17 °C and absolute humidity between 1 and 9 g/m3, and, similar to other
coronaviruses which show seasonality [14], warm–humid conditions might be a factor contributing
to
Int.the lowerRes.
J. Environ. number of cases
Public Health 2020,in
17,tropical
5399 countries, resulting in a slower virus spread, as has been
6 of 13
observed for other viruses.
Figure
Figure 4.
4. Number
NumberofofCOVID-19
COVID-19casescasesacross
acrossthe
theworld
worldasasaafunction
functionofoftemperature
temperatureand andabsolute-
absolute-
humidity.
humidity. The Thefigure
figureshows
showsthe
thenumber
numberof ofcases
cases reported
reported COVID-19
COVID-19 cases
cases per
per 10-day
10-day period
period for
for
different
different temperature
temperature and
and absolute
absolute humidity
humidity values.
values. Temperature
Temperature and
andabsolute
absolutehumidity
humidityrange
range with
with
the
themajority
majorityof ofCOVID-19
COVID-19 cases
cases (>85%)
(>85%)isishighlighted
highlightedwith
withlight
lightblue
bluecolor
colorand
andisisconsistently
consistentlybetween
between
33and
and17 ◦ Cfor
17 °C fortemperature
temperatureand
andbetween
between 44 and g/m33for
and 99 g/m forabsolute
absolutehumidity
humidityevery
everyweek.
week.
Therelation
The numberbetween
of COVID-19 cases detected
the number of COVID-19in a country/state depends onand
cases and temperature multiple factors humidity
the absolute including
testing, population
observed (density),
here is consistent forcommunity
every time period structure, social in
included dynamics, governmental
this analysis between 22policies,
Januaryglobal
2020
connectivity,
and 1 May 2020 air and surface
(Figure 4) andlife is
[24],basedreproduction
on approximatelynumber and serial interval
3.5 million of the
confirmed SARS-CoV-2.
cases globally,
Many of the
although the information
underlying regarding
reasoning COVID-19
behind this in relationship
still emerging, is such as being
still not clear.airborne
Similarly, forwe
moredo than
not
3 h and
know having
which of different survival times
the environmental on metals,
factors is morecardboards
important.and plastics
It could be[24]
that(published on March or
either temperature 17,
2020). Thehumidity
absolute most recent work on
is more the stability
important, or of
bothSARS-CoV-2 with changes
may be equally or notin temperature
important atshowedall in that
the
the virus is sensitive
transmission to heat The
of COVID-19. [25];temperature
however, these findings are
dependency of still very preliminary.
COVID-19 may be similarPrevious works
to that of
have shown that
SARS-Cov-1, which theloses
spread of viruses
its ability depends
to survive in upon
higher environmental
temperatures factors,
[12], due with many
to the respiratory
breakdown of
pathogens
their showing
lipid layer seasonality
at higher and decreased
temperatures transmission
[13]. The relationshiprates in warmer
between humid climates,
COVID-19 however,
and temperature
the absolute
and behaviorhumidity
of COVID-19 couldisalsostillbeunder investigation
secondary, and the lowerand also the in
spread subject of thismight
the tropics paper. Below,
be due to
we analyze
longer the possible
exposure to sunlight reasons
(as itfor
may thehave
lowantiviral
number properties),
of reported COVID-19
the naturally cases to dateultraviolet
occurring in regions
with T
(UV) > 17 ◦ C in
radiation and AH
the > 9 g/mand
sunlight, 3 which includes most of the countries between 30 S and 30 N.
other factors that are still unknown. There are preliminary lab-
basedFirst, around
findings that81% of testing
suggest the rolewas of conducted
temperature, in non-tropical
humidity andcountries (30 N however,
UV radiation; and above), andneed
these 85%
of be
to theconfirmed
COVID-19incases were recorded
repeated experiments in the same It
[25,30]. countries
may also within a temperature
be argued to 17 ◦ofC
range of 0 level
that the immunity
and absolute 3 . Therefore, the higher number of tests and global
people living humidity (AH) between
in those places 1 andhigh
is relatively 9 g/m (since wide-spread silent tuberculosis (TB) is also
connectivity
common of the
in their northern-cooler
population) countriesatmay
and researchers partially institute
an Australia explain the havedifference in the number
started vaccinating health of
confirmed COVID-19 cases between cooler and warmer-humid regions.
workers working with COVID-19 patient with BCG (Bacillus Calmette–Guérin) vaccine [31] to test However, several countries
and vaccine’s
the regions between 30 S and
effectiveness 30 N COVID-19.
against that performed extensive
However, thetesting
exact including Singapore, these
factors underlying UAE,
Saudi Arabia,
differences must Australia,
be further Qatar etc., reported
explored a lower number
through laboratory of especially
testing, positive COVID-19
the role ofcases per capita
environmental
and a lower
factors in theincidence
spread ofrate than European
COVID-19, as several andpeople,
American countries,
including suggesting
renowned that the discrepancy
epidemiologists [32], haveis
not solely adue
suggested to but
link, lacknone
of testing
have and there might
provided be other
definitive prooffactors
backed might be playing
by rigorous a role intesting.
laboratory the spread
of COVID-19.
While most tropical countries have under-tested for COVID-19, if the extent of COVID-19 cases
were comparable to those in European and American cities, the mortality rates [26] would have provided
some indication of the extent and severity of the spread (Figure 3). Although mortality rate depends on
several factors, including the demographics, age and health of the population, the lack of good health
facilities and prevalence of large numbers of cases could lead to a higher mortality rate. However,
the mortality rate in South Asian countries is lower, even though the health infrastructures in many
of these countries are substantially inferior to European and American infrastructures. Additionally,Int. J. Environ. Res. Public Health 2020, 17, 5399 7 of 13
reports of crowded hospitals and people suffering from respiratory sickness would have emerged in
local media, which have typically not been reported. In Italy, pro-active testing on COVID-19 was
limited until the healthcare system was overwhelmed, with a large number of people showing up
with symptoms associated with COVID-19, thus forcing the government to take adequate measures to
slow the spread of COVID-19. The apparent difference between these regions has also been reported
extensively [27].
It could be argued that countries between 30 S and 30 N are in the early phase of the pandemic
where the incidence rate appears linear and would pick up only after hundreds of cases have been
reported, a phenomena observed for several countries including the US, Italy, and Spain. It is possible
that several countries will see an exponential growth soon if they are in the initial phase of the pandemic.
However, for several countries such as Australia, Malaysia, Thailand and Saudi Arabia that have
reported more than 1500 cases, the number of days it took to reach these levels is much slower than
European countries and American states. The incidence rate in Indonesia, Vietnam and Cambodia
is also low, but we do not discuss them here due to an inadequate number of testing per capita.
Furthermore, in Figure 1, we compared the top nine cold and dry countries with the top 10 hot and
humid countries by April 1. This gives them enough weeks to multiply their already high number of
reported cases in the coming weeks. However, as the graph shows, several of these countries in hot
and humid places showed a much slower incidence growth.
It could also be argued that the government in these countries is taking exceptional measures to
stop the spread of the virus, which we know is not true. Until March 26, 2020, most Asian and African
countries were working business as usual. India, the 2nd most populous country in the world, started
a lockdown on March 26, 2020 and Indonesia (4th most populous country) did not implement any
lockdown until very recently [28]. Even though the proportion of tests across all the countries between
30 S and 30 N are much lower than the countries above 30 N, the fraction of confirmed cases, that is,
500,000 positive cases out of around 7 million tests performed [29] (approximately 6 out of 100) is lower
for countries between 30 S and 30 N than countries above 30 N, that performed around 29 million
tests and found approximately 3 million positive COVID-19 cases [29] (approximately 10 out of 100)
as of May 3, 2020. If countries between 30 S and 30 N were only testing highly symptomatic people,
the proportional of confirmed cases should have been higher and not lower. Therefore, the lower
number of cases to date, in the densely populated countries between 30 and 30 N (combined population
of almost 3 billion people) may be due to non-human factors that might play a role in slowing the
spread of the virus. Viral transmission has been suggested to be lower at higher humidity and
temperature, and the majority of countries between 0 and 30 N are warm–humid. Therefore, the role of
environmental factors in the spread of COVID-19 is worth exploring. Data until 1 May 2020 (Figure 4)
reveal that 85% of the COVID-19 cases have been recorded in the regions within a temperature range
of 0 to 17 ◦ C and absolute humidity between 1 and 9 g/m3 , and, similar to other coronaviruses which
show seasonality [14], warm–humid conditions might be a factor contributing to the lower number of
cases in tropical countries, resulting in a slower virus spread, as has been observed for other viruses.
The relation between the number of COVID-19 cases and temperature and the absolute humidity
observed here is consistent for every time period included in this analysis between 22 January 2020 and
1 May 2020 (Figure 4) and is based on approximately 3.5 million confirmed cases globally, although the
underlying reasoning behind this relationship is still not clear. Similarly, we do not know which of the
environmental factors is more important. It could be that either temperature or absolute humidity
is more important, or both may be equally or not important at all in the transmission of COVID-19.
The temperature dependency of COVID-19 may be similar to that of SARS-Cov-1, which loses its
ability to survive in higher temperatures [12], due to the breakdown of their lipid layer at higher
temperatures [13]. The relationship between COVID-19 and temperature and absolute humidity could
also be secondary, and the lower spread in the tropics might be due to longer exposure to sunlight
(as it may have antiviral properties), the naturally occurring ultraviolet (UV) radiation in the sunlight,
and other factors that are still unknown. There are preliminary lab-based findings that suggest theInt. J. Environ. Res. Public Health 2020, 17, 5399 8 of 13
role of temperature, humidity and UV radiation; however, these need to be confirmed in repeated
experiments [25,30]. It may also be argued that the immunity level of people living in those places is
relatively high (since wide-spread silent tuberculosis (TB) is also common in their population) and
researchers at an Australia institute have started vaccinating health workers working with COVID-19
patient with BCG (Bacillus Calmette–Guérin) vaccine [31] to test the vaccine’s effectiveness against
COVID-19. However, the exact factors underlying these differences must be further explored through
laboratory testing, especially the role of environmental factors in the spread of COVID-19, as several
people, including renowned epidemiologists [32], have suggested a link, but none have provided
definitive proof backed by rigorous laboratory testing.
With summer approaching, it may also be that the temperature ranges we have seen for most
of the cases (0 to 17 ◦ C) to date may be further broadened in the coming weeks, and any effect may
only happen at higher temperature similar to that found in SARS-Cov-1 [12]. In fact, in light of the
early lab test reports [25], it would be reasonable to assume that if there is any temperature-related
effect, it would only happen at temperatures well above 30 ◦ C. The humidity dependency may be
due to the less effective airborne nature of the viruses at higher absolute humidity, thus reducing
the overall indirect transmission of COVID-19 at higher levels of humidity [33]. Although higher
humidity may increase the amount of virus deposited on surfaces, and virus survival time in droplets
on surfaces [33], the reduction in the virus spread by indirect (through air) transmission may be the
factor behind the reduced COVID-19 spread in humid climate. These explanations are speculative
and based on patterns observed for other coronaviruses. Urgent study/experiments on the association
between coronavirus transmission against temperature and humidity in laboratories are needed to
understand these associations.
We opted for not using R0 (basic reproduction number) in our work, since the R0 values reported
for COVID-19 differ widely from each other [34], similar to the 1918 influenza pandemic, where various
models resulted in a broad range of published values [35]. For a current pandemic such as COVID-19,
where we have data that are continually updated and highly dependent upon the surveillance system,
we preferred not to use R0 or Reffective because the results can vary significantly depending upon the
estimated R0 (or Reffective ) [36]. In fact, few papers published to date have shown contradictory results
on the effect of climatic factors on the spread of COVID-19 [36–40].
4. Conclusions
Our conclusions are based on the currently available data with several unknowns, including
how the virus is mutating and evolving, case fatality ratio, reproductive numbers and direct versus
indirect transmissions. The relation between temperature and humidity and the spread of COVID-19
cases should be closely monitored and studied under different climatic conditions in controlled
laboratory settings. If a strong environmental dependence in the spread of COVID-19 emerges, then it
should be used to optimize the COVID-19 mitigation strategies. Our results in no way suggest that
COVID-19 would not spread in warm humid regions and effective public health interventions should
be implemented across the world to slow down the transmission of COVID-19.
Implications for future transmission of COVID-19: In April 2020, more than 300,000 cases have
been recorded in regions with T > 17 ◦ C, even though this is much lower than the number of cases
observed in regions with T between 0 and 17 ◦ C. The rise in cases in the warmer parts of Europe
including the Andalusian region and southern US states provides little hope that rising temperature
alone could lower the spread of cases in the current hotspot of Europe and the US, as the mean
temperature for most of the major cities in these regions is below 25 ◦ C for most of May and June.
Therefore temperature could have an effect similar to the relationship observed between SARS-CoV-1
and temperature [12]; however, it might be at much higher temperatures, as reported in the early
laboratory experiments [25], and at the mild summer temperatures of Europe and North America,
the virus may continue to survive for several days on plastics and metals [24]. The southern part of
Florida and Louisiana are the only places in the US which have started experiencing temperaturesInt. J. Environ. Res. Public Health 2020, 17, 5399 9 of 13
>17 ◦ C (65 ◦ F) and absolute humidity above 9 g/m3 since the end of March. In our previous work [23],
we reported these states as outliers. However, once these temperature and humidity ranges arrived
in those places, the increase in cases significantly dropped, as evident from the decrease in cases
after April 10, 2020. However, it must be mentioned that the weather alone may not have been
responsible for these decreased numbers, rather, the lockdown measures and precautions may have
had a larger impact.
In comparison to temperature, absolute humidity is tightly bound throughout (Figure 4) with
85% of cases occurring between 1 and 9 g/m3 . It has been suggested that absolute humidity plays an
important role in the transmission of viruses [33,41,42] and its role in the transmission of COVID-19
should be thoroughly investigated. We calculated the theoretical absolute humidity for temperatures
between −5 and 40 ◦ C and RH between 0 and 100% (see Equation (1)). The absolute humidity isInt. J. Environ. Res. Public Health 2020, 17, 5399 10 of 13
and Pakistan performing more than 150,000 tests, and found fewer COVID-19 positive cases than the
cold and dry countries. Similarly, Saudi Arabia, has also performed more than 300,000 tests, however,
they found fewer positive cases than many of the cold and dry countries.
Brazil, Louisiana and Florida seemed to be an outlier as the number of COVID-19 cases rose
rapidly in mid-March, even though the number of cases per capita in Brazil and Florida remained much
lower than northern regions. The high number of cases in Louisiana might be due to the Mardi Gras
festival [45], where thousands of people gathered from across the world in February. Late testing
can also explain the initial jump in cases in Brazil and Florida in early March. However, once the
government took precautionary actions and implemented quarantine measures, and temperature
and humidity levels grew higher in mid-March, the increase in cases slowed down, especially since
mid-April. Compared to New York, and New Jersey, where the cases continue to rise exponentially
despite strict lockdown measures, the difference is quite striking. The recent rise in cases in other South
American countries with hot and humid weather, including Peru and Ecuador, may be due to the lack
of early testing and late response to implementing social distancing measures. This also stands as an
example that warm and humid regions will continue to see an increase in cases until proper measures
are implemented.
Limitations: There may be several caveats to our work. Even though the number of reported
cases was taken directly from the WHO reports, several countries are underreporting cases and have
adopted different public health strategies [46]. For example, while Korea did widespread testing to
identify potential COVID-19-positive subjects, including asymptomatic ones, to reduce transmission,
the US and several other countries, including the UK and Japan, decided to only test individuals
with symptoms or in contact with COVID-19-positives. This may, in turn, lead to undetected cases,
and therefore, even though the population may have a larger number of COVID-19-positives, they
may go undetected until it is transmitted to the most vulnerable in the population. Additional climatic
factors such as solar radiation and cloud cover were not considered in our analysis, which could have
also played an important role in the spread of COVID-19; however, since solar radiation and cloud
cover are correlated with temperature in natural environments, similar patterns can be expected from
those climate variables. Further, the rate of outdoor transmission versus indoor and direct versus
indirect transmission are also not well understood, and environmental-related impacts are mostly
applicable to outdoor transmissions. Recently there has been an increase in cases in warm and humid
places, which may be due to other factors including but not limited to social distancing, quarantine
measures and cultural practices.
Recommendations: Several governments have adopted the ‘flatten the curve’ strategy to mitigate
the burden on healthcare instantly, spreading the number of patients requiring treatment over time to
properly manage the medical needs of the patients, and eventually slowing the spread of the pandemic
in summer. While proper quarantine measures help in ‘spreading the curve’, we believe that warm
humid conditions in the coming days would be unlikely to be of any use in most of Europe and North
America, if climate plays a role in the spread of COVID-19.
We highly stress the importance of using the proper quarantine measures, even in warmer, humid
regions where the incidence rate appears to be lower, to effectively reduce the transmission of COVID-19
and protect the vulnerable against it. Warm weather alone may not be able to stop the spread of
COVID-19, even in hot and humid countries, if proper safety measures are not taken, since we have
evidence already that COVID-19-positive cases also keep increasing in hot and humid regions. Besides
weather, there are several other factors that may play roles in the number of affected cases in any
region, including population density, public health policies, political and social structures, healthcare
quality, healthcare intervention, and global connectedness. Future work should include these factors,
and use an epidemiological statistical model to further investigate the relationship between weather
and COVID-19 transmission.
Supplementary Materials: The following are available online at http://www.mdpi.com/1660-4601/17/15/5399/s1,
Table S1: Basic demographic and weather data of the countries from Figure 1.Int. J. Environ. Res. Public Health 2020, 17, 5399 11 of 13
Author Contributions: Q.B. conceived the idea and performed analysis. Q.B., and S.K. wrote the manuscript.
All authors (Q.B., J.M.M., R.B.D.Sr., and S.K.) conducted review and editing. All authors have read and agreed to
the published version of the manuscript.
Funding: This work is supported by Abdul Latif Jameel Clinic for Machine Learning in Health (J-Clinic).
Conflicts of Interest: The authors declare no conflict of interest.
References
1. Lu, H.; Stratton, C.W.; Tang, Y.-W. Outbreak of pneumonia of unknown etiology in Wuhan, China: The mystery
and the miracle. J. Med. Virol. 2020, 92, 401–402. [CrossRef]
2. Chen, N.; Zhou, M.; Dong, X.; Qu, J.; Gong, F.; Han, Y.; Qiu, Y.; Wang, J.; Liu, Y.; Wei, Y.; et al. Epidemiological
and Clinical Characteristics of 99 Cases of 2019-Novel Coronavirus (2019-nCoV) Pneumonia in Wuhan,
China. Lancet 2020, 395, 507–513. [CrossRef]
3. Bogoch, I.; Watts, A.; Thomas-Bachli, A.; Huber, C.; Kraemer, M.U.G.; Khan, K. Potential for global spread of
a novel coronavirus from China. J. Travel Med. 2020, 27. [CrossRef] [PubMed]
4. Organization WH; Others. Coronavirus Disease (COVID-19) Outbreak. 2020. Available online: https:
//www.who.int/emergencies/diseases/novel-coronavirus-2019 (accessed on 5 May 2020).
5. Huang, C.; Wang, Y.; Li, X.; Ren, L.; Zhao, J.; Hu, Y.; Zhang, L.; Fan, G.; Xu, J.; Gu, X.; et al. Clinical features
of patients infected with 2019 novel coronavirus in Wuhan, China. Lancet 2020, 395, 497–506. [CrossRef]
6. Xu, P.; Sun, G.-D.; Li, Z.-Z. Clinical Characteristics of Two Human to Human Transmitted Coronaviruses: Corona
Virus Disease 2019 versus Middle East Respiratory Syndrome Coronavirus. Eur. Rev. Med. Pharmacol. Sci. 2020,
24, 5797–5809. [CrossRef]
7. Hofmann, H.; Pyrc, K.; Van Der Hoek, L.; Geier, M.; Berkhout, B.; Pöhlmann, S. Human coronavirus NL63
employs the severe acute respiratory syndrome coronavirus receptor for cellular entry. Proc. Natl. Acad.
Sci. USA 2005, 102, 7988–7993. [CrossRef] [PubMed]
8. Van Der Hoek, L.; Pyrc, K.; Jebbink, M.F.; Vermeulen-Oost, W.; Berkhout, R.J.M.; Wolthers, K.C.;
Dillen, P.M.E.W.-V.; Kaandorp, J.; Spaargaren, J.; Berkhout, B. Identification of a new human coronavirus.
Nat. Med. 2004, 10, 368–373. [CrossRef]
9. Esper, F.; Weibel, C.; Ferguson, D.; Landry, M.L.; Kahn, J.S. Evidence of a Novel Human Coronavirus That Is
Associated with Respiratory Tract Disease in Infants and Young Children. J. Infect. Dis. 2005, 191, 492–498.
[CrossRef]
10. Lowen, A.C.; Mubareka, S.; Steel, J.; Palese, P. Influenza Virus Transmission Is Dependent on Relative
Humidity and Temperature. PLoS Pathog. 2007, 3, e151. [CrossRef]
11. Barreca, A.I.; Shimshack, J.P. Absolute Humidity, Temperature, and Influenza Mortality: 30 Years of
County-Level Evidence from the United States. Am. J. Epidemiol. 2012, 176, S114–S122. [CrossRef]
12. Chan, K.H.; Peiris, J.S.M.; Lam, S.Y.; Poon, L.L.; Yuen, K.-Y.; Seto, W.H. The Effects of Temperature and Relative
Humidity on the Viability of the SARS Coronavirus. Adv. Virol. 2011, 2011, 1–7. [CrossRef] [PubMed]
13. Schoeman, D.; Fielding, B.C. Coronavirus envelope protein: Current knowledge. Virol. J. 2019, 16, 69.
[CrossRef] [PubMed]
14. A Neher, R.; Dyrdak, R.; Druelle, V.; Hodcroft, E.B.; Albert, J. Potential impact of seasonal forcing on a
SARS-CoV-2 pandemic. Swiss Med. Wkly. 2020, 150, w20224. [CrossRef]
15. Liu, J.; Zhou, J.; Yao, J.; Zhang, X.; Li, L.; Xu, X.; He, X.; Wang, B.; Fu, S.; Niu, T.; et al. Impact of meteorological
factors on the COVID-19 transmission: A multi-city study in China. Sci. Total Environ. 2020, 726, 138513.
[CrossRef] [PubMed]
16. Xie, J.; Zhu, Y. Association between ambient temperature and COVID-19 infection in 122 cities from China.
Sci. Total Environ. 2020, 724, 138201. [CrossRef] [PubMed]
17. Ma, Y.; Zhao, Y.; Liu, J.; He, X.; Wang, B.; Fu, S.; Yan, J.; Niu, J.; Zhou, J.; Luo, B. Effects of temperature
variation and humidity on the death of COVID-19 in Wuhan, China. Sci. Total Environ. 2020, 724, 138226.
[CrossRef] [PubMed]
18. How Many Tests for COVID-19 Are Being Performed Around the World? In Our World in Data. Available
online: https://ourworldindata.org/covid-testing (accessed on 23 March 2020).
19. Iribarne, J.V.; Cho, H.-R. Atmospheric Thermodynamics and Vertical Stability; Springer Science and Business
Media: Berlin, Germany, 1980; pp. 79–96.Int. J. Environ. Res. Public Health 2020, 17, 5399 12 of 13
20. Bolton, D. The Computation of Equivalent Potential Temperature. Mon. Weather Rev. 1980, 108, 1046–1053.
[CrossRef]
21. WCTV. Florida Coronavirus Numbers Continue to Grow as Test Results Return. Available online: https:
//www.wctv.tv/content/news/Florida-coronavirus-numbers--568964691.html (accessed on 23 March 2020).
22. CDC. Coronavirus Disease 2019 (COVID-19); Centers for Disease Control and Prevention: Atlanta, GA,
USA, 2020. Available online: https://www.cdc.gov/coronavirus/2019-ncov/cases-updates/testing-in-us.html
(accessed on 23 March 2020).
23. Bukhari, Q.; Jameel, Y. Will Coronavirus Pandemic Diminish by Summer? SSRN Electron. J. 2020. [CrossRef]
24. Van Doremalen, N.; Bushmaker, T.; Morris, D.H.; Holbrook, M.G.; Gamble, A.; Williamson, B.N.; Tamin, A.;
Harcourt, J.L.; Thornburg, N.J.; Gerber, S.I.; et al. Aerosol and Surface Stability of SARS-CoV-2 as Compared
with SARS-CoV-1. N. Eng. J. Med. 2020. [CrossRef]
25. Chin, A.W.H.; Chu, J.T.S.; Perera, M.R.A.; Hui, K.P.Y.; Yen, H.-L.; Chan, M.C.W.; Peiris, M.; Poon, L.L.M.
Stability of SARS-CoV-2 in different environmental conditions. Lancet Microbe 2020, 1, e10. [CrossRef]
26. Wilson, N.; Kvalsvig, A.; Barnard, L.T.; Baker, M.G. Case-Fatality Risk Estimates for COVID-19 Calculated by
Using a Lag Time for Fatality. Emerg. Infect. Dis. 2020, 26, 1339–1441. [CrossRef] [PubMed]
27. Beech, H.; Rubin, A.J.; Kurmanaev, A.; Maclean, R. The Covid-19 Riddle: Why Does the Virus Wallop Some
Places and Spare Others? The New York Times, 3 May 2020. Available online: https://www.nytimes.com/2020/
05/03/world/asia/coronavirus-spread-where-why.html (accessed on 5 May 2020).
28. McBeth, J. A Lockdown Too Late for virus-hit Indonesia. Asia Times, 24 April 2020. Available online: https:
//asiatimes.com/2020/04/indonesias-virus-lockdown-may-have-come-too-late/ (accessed on 30 April 2020).
29. Wikipedia contributors. Template: COVID-19 Testing by Country. In Wikipedia, The Free Encyclopedia.
Available online: https://en.wikipedia.org/w/index.php?title=Template:COVID-19_testing_by_country&
oldid=954969639 (accessed on 5 May 2020).
30. Fredericks, B. Top DHS Scientists Says Heat, Humidity Slow Coronavirus. New York Post, 23 April 2020.
Available online: https://nypost.com/2020/04/23/top-dhs-scientists-says-heat-humidity-slow-coronavirus/
(accessed on 5 May 2020).
31. Tirumalaraju, D. Australian Researchers to Trial BCG Vaccine for Covid-19. Clinical Trials Arena, 27 March 2020.
Available online: https://www.clinicaltrialsarena.com/news/australia-bcg-vaccine-trial-covid-19/ (accessed
on 30 March 2020).
32. Lipsitch, M. Seasonality of SARS-CoV-2: Will COVID-19 Go Away on Its Own in Warmer Weather.
Center for Communicable Disease Dynamics, Harvard University: Cambridge, MA, USA, 2020. Available
online: https://ccdd.hsph.harvard.edu/will-Covid-19-Go-Away-on-Its-Own-in-Warmer-Weather/ (accessed
on 19 April 2020).
33. Paynter, S. Humidity and respiratory virus transmission in tropical and temperate settings. Epidemiol. Infect.
2014, 143, 1110–1118. [CrossRef] [PubMed]
34. Liu, Y.; Gayle, A.A.; Wilder-Smith, A.; Rocklöv, J. The reproductive number of COVID-19 is higher compared
to SARS coronavirus. J. Travel Med. 2020, 27, taaa021. [CrossRef] [PubMed]
35. Coburn, B.J.; Wagner, B.G.; Blower, S. Modeling influenza epidemics and pandemics: Insights into the future
of swine flu (H1N1). BMC Med. 2009, 7, 30. [CrossRef] [PubMed]
36. Ridenhour, B.; Kowalik, J.M.; Shay, D. Unraveling R0 : Considerations for Public Health Applications. Am. J.
Public Health 2014, 104, e32–e41. [CrossRef]
37. Wang, J.; Tang, K.; Feng, K.; Lv, W. High Temperature and High Humidity Reduce the Transmission of
COVID-19. SSRN Electron. J. 2020. [CrossRef]
38. Poirier, C.; Luo, W.; Majumder, M.S.; Liu, D.; Mandl, K.; Mooring, T.; Santillana, M. The Role of Environmental
Factors on Transmission Rates of the COVID-19 Outbreak: An Initial Assessment in Two Spatial Scales.
SSRN Electron. J. 2020. [CrossRef]
39. Zhang, S.; Diao, M.; Yu, W.; Pei, L.; Lin, Z.; Chen, D. Estimation of the reproductive number of novel
coronavirus (COVID-19) and the probable outbreak size on the Diamond Princess cruise ship: A data-driven
analysis. Int. J. Infect. Dis. 2020, 93, 201–204. [CrossRef]
40. Kucharski, A.J.; Russell, T.W.; Diamond, C.; Liu, Y.; Edmunds, J.; Funk, S.; Eggo, R.M.; Sun, F.; Jit, M.;
Munday, J.D.; et al. Early dynamics of transmission and control of COVID-19: A mathematical modelling
study. Lancet Infect. Dis. 2020, 20, 553–558. [CrossRef]Int. J. Environ. Res. Public Health 2020, 17, 5399 13 of 13
41. Shaman, J.; Kohn, M. Absolute humidity modulates influenza survival, transmission, and seasonality.
Proc. Natl. Acad. Sci. USA 2009, 106, 3243–3248. [CrossRef]
42. Noti, J.D.; Blachere, F.M.; McMillen, C.M.; Lindsley, W.G.; Kashon, M.L.; Slaughter, D.R.; Beezhold, D. High
Humidity Leads to Loss of Infectious Influenza Virus from Simulated Coughs. PLoS ONE 2013, 8, e57485.
[CrossRef] [PubMed]
43. Kermani, S. Festival Held in the Shadow of Coronavirus. BBC. 20 March 2020. Available online: https:
//www.bbc.com/news/world-asia-51966125 (accessed on 21 March 2020).
44. Jazeera, A. Qatar’s Coronavirus Cases Jump by 238 in One Day. In Al Jazeera. Available online: https:
//www.aljazeera.com/news/2020/03/qatar-coronavirus-cases-jump-238-day-200311154834214.html (accessed
on 21 March 2020).
45. “We were not given a warning”: New Orleans mayor says federal inaction informed Mardi Gras decision ahead of
covid-19 outbreak. The Washington Post, 26 March 2020. Available online: https://www.washingtonpost.com/national/
coronavirus-new-orleans-mardi-gras/2020/03/26/8c8e23c8-6fbb-11ea-b148-e4ce3fbd85b5_story.html (accessed on
30 March 2020).
46. Baud, D.; Qi, X.; Nielsen-Saines, K.; Musso, D.; Pomar, L.; Favre, G. Real estimates of mortality following
COVID-19 infection. Lancet Infect. Dis. 2020, 20, 773. [CrossRef]
© 2020 by the authors. Licensee MDPI, Basel, Switzerland. This article is an open access
article distributed under the terms and conditions of the Creative Commons Attribution
(CC BY) license (http://creativecommons.org/licenses/by/4.0/).You can also read