Influence of Climate Change on the Thermal Condition of Yakutia's Permafrost Landscapes (Chabyda Station) - MDPI
←
→
Page content transcription
If your browser does not render page correctly, please read the page content below
land
Article
Influence of Climate Change on the Thermal
Condition of Yakutia’s Permafrost Landscapes
(Chabyda Station)
Stepan P Varlamov *, Yuri B Skachkov and Pavel N Skryabin
 Melnikov Permafrost Institute SB RAS, 677010 Yakutsk, Russia
 * Correspondence: svarlamov@mpi.ysn.ru

 Received: 6 April 2020; Accepted: 25 April 2020; Published: 28 April 2020

 Abstract: This paper presents the results of 39 years of observations conducted at the Chabyda station
 to monitor the thermal state of permafrost landscapes under current climatic warming. The analysis
 of long-term records from weather stations in the region has revealed one of the highest increasing
 trends in mean annual air temperature in northern Russia. The partitioning of the energy balance
 in different landscape units within the study area has been analyzed. Quantitative relationships
 in the long-term variability of ground thermal parameters, such as the ground temperature at the
 bottom of the active layer and seasonal thaw depth, have been established. The ground temperature
 dynamics within the depth of zero annual amplitude indicates that both warm and cold permafrost
 are thermally stable. The short-term variability of the snow accumulation regime is the main factor
 controlling the thermal state of the ground in permafrost landscapes. The depth of seasonal thaw is
 characterized by low interannual variability and exhibits little response to climate warming, with no
 statistically significant increasing or decreasing trend. The results of the ground thermal monitoring
 can be extended to similar landscapes in the region, providing a reliable basis for predicting heat
 transfer in natural, undisturbed landscapes.

 Keywords: seasonal thaw depth; climate change; energy balance; monitoring; permafrost response;
 ground temperature

1. Introduction
     In the context of research into global climatic change, interest in the problems of the response of
permafrost to these changes has increased. Research on the impact of climate warming on permafrost
involves a wide variety of issues, including the thermal evolution of upper permafrost in natural and
disturbed landscapes under anthropogenic effects. This research has become a priority in geocryological
science, with theoretical and practical significance worldwide.
     In the face of the major climate changes in recent decades in Central Yakutia [1]—a very densely
populated and promising region in terms of agricultural and industrial development—obtaining
information on the response of permafrost to modern warming is critical.
     Pioneering systematic observations of temperatures in 10–15 m depth bore holes were conducted
in 1935. The study revealed peculiarities of temperature variations and ground thaw depth under
the effects of vegetation and snow cover, the “cultural layer”, and geological and geomorphological
parameters [2,3]. In the 1940s, year-round experimental observations were conducted to study
ground temperature regime variations under thermal insulation, snow and vegetation cover removal,
and in natural landscapes of experimental sites of the Yakut permafrost research station [4–6]. In the
1950s–1960s, more detailed integrated thermal physics observations of the shallow soil formation
thermal regime were performed, applying updated methods at experimental sites of the North-Eastern
department of the Permafrost Institute [7].

Land 2020, 9, 132; doi:10.3390/land9050132                                     www.mdpi.com/journal/land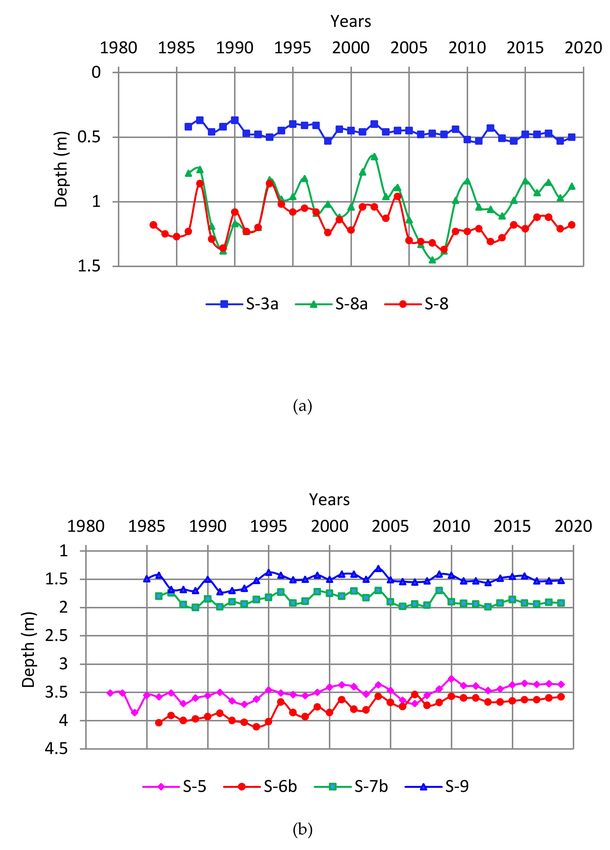
Land 2020, 9, 132                                                                                    2 of 19

      Local and regional patterns of the formation of the thermal regime of soils are revealed in the
most detailed way with the wide application of seasonal stationary research methods [8,9]. In the
1960s–1980s, regular observations of the thermal balance according to a significantly updated program
were conducted at Yakutsk, Syrdakh, Zelenyi Lug and Chabyda stations [10–13]. The research covered
both natural and disturbed landscapes. Daily, seasonal and annual variations in the surface energy
balance were studied in detail, and a series of new mathematical models of ground thawing and
warming were elaborated. Additionally, hydrothermal parameters of frozen ground under the impact
of agricultural and reclamation projects were studied at Khatassy, Khorobut, and Amga seasonal
stations [14,15]. In the 1990s, a regular experimental research project commenced within the framework
of the international projects “Global Energy and Water Exchange Experiment – Global Asian Monsoon
Experiment (GEWEX-GAME)”, “Core Research for Evolutional Science and Technology (CREST)”
and “Japan Science and Technology (JST)” in cooperation with Japanese and Dutch researchers at the
stations of Spasskaya Pad and Neleger. During this project, long-term temperature fluctuations of
the upper permafrost, soil moisture, seasonal depth of thaw, water–heat balance and carbon currents
were studied [16]. Currently, the monitoring of the ground thermal regime is performed at Chabyda
and Yakutsk stations, as well as at several study sites at Ukechi, Umaibyt, Kerdyugen, and along the
northern portion of the Tommot–Yakutsk railroad.
      The research results of ground thermal evolution within Russia during the period from the
Third International Year of Geophysics (1957/59) to the Fourth International Polar Year (2007/08) were
evaluated in [17]. Romanovsky et al. [18] assessed the thermal state of permafrost in Russia over the
last 20–30 years. Changes in the thermal state of the upper permafrost horizons in Central Yakutia and
in natural landscapes over the past 30–40 years have been considered at different stages of research
in [19–23].
      Since the early 1990s, the unified system of observations of the condition of the geological
environment in the area of the perennial and seasonal freezing of the crust of the earth, as well as the
assessment, monitoring and forecasting of its changes under the influence of natural, climatic and
man-triggered factors, has come to be defined as permafrost monitoring. Permafrost monitoring may
be recognized as a method that enables the determination of prospective trends of modern permafrost
evolution amidst climate changes and technogenesis [17,24].
      The main thermal parameters that may be used as indicators of the thermal evolution of upper
permafrost layers in the context of modern climate warming are the depth of seasonal thaw (ξ),
mean annual temperature at the bottom of the active layer (Тξ ), and mean annual temperature at the
depth of zero annual amplitude (Тo ) [17].
      In 1981, in order to conduct long-term observations of the thermal state of upper permafrost,
the Permafrost Institute organized the Chabyda heat-balance monitoring station 20 km southwest of
Yakutsk (Figure 1). The activities of the station and the results of many years of observation are reflected
in dozens of publications; additionally, the findings have been referenced in documents published
under the auspices of the Federal Service for Hydrometeorology and Environmental Monitoring [25,26].
To date, a significant number of long-term series of observations has been accumulated that have
no analogs in Russia and Yakutia. The information obtained at the station allows us to evaluate the
response of the upper horizons of permafrost to the climatic fluctuations over recent decades.
Land 2020, 9, 132                                                                                     3 of 19

               Figure 1. Scheme of the work area: 1—stations; 2—polygons; 3—roads and railways.

     The major objective of this paper is to evaluate the spatial and temporal variability of the ground
thermal state under current climatic changes. To this end, the following goals were realized: a route
survey, the selection of objects, the organization of a system of observational networks, the analysis of
long-term data from weather stations, regular observations at monitoring sites, and the summarizing
and analysis of the obtained data.

2. Research Sites and Methods
      The Chabyda station is located in the middle taiga zone and is characterized by both low and
high-temperature permafrost zones. A detailed description of the observation sites and their location
in relation to the station is given in a number of publications [12,13].
      The relief of the study area is characterized by a combination of lowered and elevated sections of
a hilly–steep plain. Lower areas are the bottoms of streams and gullies, while dry elevated areas are
slopes of various steepness and watershed spaces. On the slopes, soils are represented by fine and
medium-grained sands, soils on the watersheds in the upper horizons are sandy loam, and those below
are sand. The objects of research are soils within the layer of annual heat rotation; in other words,
the layer of annual temperature fluctuations (the upper 10–20 m).
      Depending on the terrain conditions, soil texture, moisture content, vegetation, and surface cover,
the active layer thickness varies over a wide range, from 0.4 to 4.0 m, and the mean annual ground
temperature at a depth of 10 m varies from -0.2 to -5.0 ◦ C [13].
      Landscape and monitoring methods were utilized to study the ground thermal regime. Landscape
studies involved remote sensing and ground surveys of landscapes and their classification and
mapping. The information obtained was used for site selection and for the design of a thermal
monitoring program.
      The experimental sites (S) were organized into two landscape types of terrain. In the stream
valley: on the mari (S-1, S-3a); on the grassy lowland (S-8a); in the larch forest (S-8). On slopes: in pine
forest on a gentle slope (S-4, S-5, S-6b); in pine (S-7b) and larch (S-9) forests on a watershed slope; in
pine forest on moderately steep slopes of the Northern (S-10) and southern (S-11) expositions.
      The ground thermal regime within the depth of annual temperature fluctuations is determined
both by external (solar radiation, air temperature, and precipitation) and internal (moisture conditions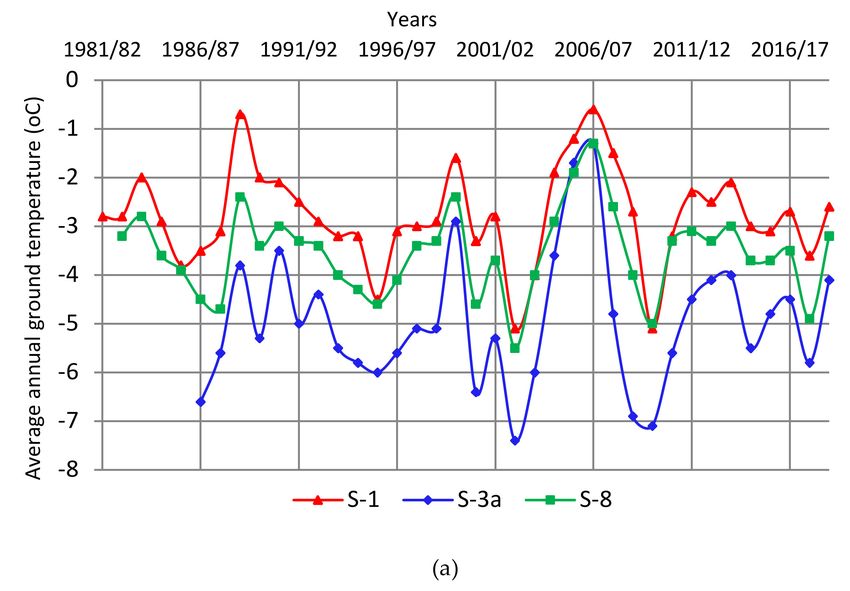
Land 2020, 9, 132                                                                                     4 of 19

and lithology) factors. Snow cover, vegetation, and organic mat are also important controlling
factors [10–13].
     The radiation balance is the result of the incoming and outgoing solar energy at the Earth’s surface
and is described by the following equation:

                                                Q = S + Jef + R                                          (1)

where Q is the total incoming radiation; S is the reflected radiation; Jef is the effective radiation (net
long-wave radiation); and R is the net radiation.
    The components of the heat and moisture exchange of the Earth’s surface with the atmosphere are
expressed by the heat balance equation or the energy balance equation on the Earth’s surface [10]:

                                                R = P + LE + B,                                          (2)

where P is the sensible heat flux; LE is the latent heat flux (E is the evaporation rate and L is the latent
heat of evaporation of water); and B is the ground heat flux.
     Long-term studies at a thermal monitoring station in Yakutsk suggest that all components of the
energy budget are half or one order of magnitude lower during the cold season compared to the warm
season [10]. Differences in the energy balance characteristics among landscape types are therefore more
distinctive in summer. Summertime net radiation can be determined from instrumental measurements
or by calculation. Pavlov [10] proposed a simple model to estimate the energy balance using incident
solar radiation and surface albedo. We measured albedo at the Chabyda research sites during summer
months (Table 1). The measured A and ho were used to calculate the monthly sums of surface net
radiation over the warm season, LE and B were derived from instrumental measurements, and Р was
estimated as a residual of the energy balance equation. Meteorological and actinometric observations
were made using standard instruments of Roshydromet.

                            Table 1. Surface albedo at the Chabyda research sites, %.

                                                                                  Months
      Site no.                      Surface
                                                                  V       VI        VII      VIII   IX
          1                      Shallow lake                     13       9            9     9     11
          2          Moss cover with sedge and reed grass         18       18           20   20     18
          3          Mosses, ledum and dwarf forest bog           25       15           15   16     15
                    Bearberry patches with dead plant spots
          4                                                       16       17           17   17     19
                             under a pine canopy
                    Bearberry patches with dominant dead
          5                                                       15       15           15   18     18
                       plant spots under a pine canopy
                    Sparse forb mat with dead plant spots at
          6                                                       16       18           18   21     22
                                 an open site
                    Bearberry patches with dead plant spots
          7                                                       14       14           15   16     15
                             under a pine canopy
                    Moss–ledum–lingonberry cover under a
          8                                                       13       13           12   13     12
                           birch and larch canopy

     The permafrost thermal monitoring program included measurements of ground temperature and
thaw depth, as well as the major controlling variables, such as ground material, cryostructure, moisture
content, soil unit weight, thermal conductivity of soils and surface covers, and snow depth and density.
     Ground temperatures were measured using MMT-4 semiconductor thermistors with an accuracy
of 0.1 ◦ C. Until 1990, the measuring devices used were the potentiometer PP-63 and the resistance
bridge MO-62; since 1990, the multimeters EDM-169S and EDM-89S have been used. Thermistor cables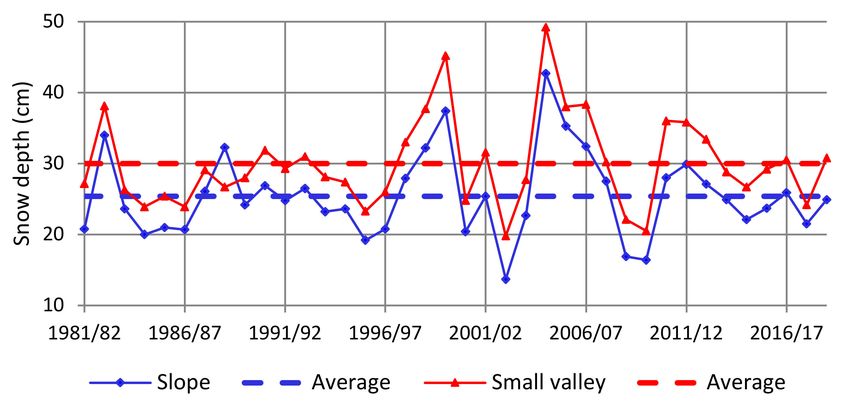
Land 2020, 9, 132                                                                                  5 of 19

placed in backfilled boreholes recorded temperatures at depths of 1, 2, 3, 4, 6, 8 and 10 m. Active layer
depths were determined by probing with a steel rod and by hand boring. The analysis and summary
of the observation results at various monitoring stages were presented by Skryabin et al. [12] and
Varlamov et al. [13].
     Observations of the thermal regime of the active layer at the Chabyda station were carried out
in the warm seasons of 1981 and 1982 daily, in seven shifts, and in the cold season of 1982–1983 in
four shifts. In the annual cycles of 1983–1986, in the summer, observations were carried out once
in a pentad, in four shifts. In 1981–1987, soil temperature measurements in the layer of annual
temperature variations were carried out once a decade. Since 1987, thermal observations have been
carried out according to a more abbreviated program on the 15th of each month. Snow cover is also
observed monthly, and at the end of the warm season, the depth of seasonal thawing is observed.
The methodology of geothermal monitoring has shown its reliability and can be successfully used in
various climatic conditions.

3. Results and Discussion

3.1. Modern Climate Changes
      Since the second half of the 1960s, according to Skachkov [1], Central Yakutia has experienced
the highest increasing trend in mean annual air temperature in northern Russia (up to 0.07 ◦ C/year).
In 2001–2019, the highest ever temperatures in the history of weather observations were registered
in Yakutsk, at −7.7 ◦ C as compared with an average of −10.0 ◦ C. The evaluation of predicted trends
of temperature variations in the 21st century by various researchers is ambiguous. For example,
predictions of climatic change performed by the Voeikov General Geophysical Observatory (GGO)
based on climatic feature extrapolation results suggest that the observed increasing trend in the Russian
mean annual air temperature will continue to 2030 by 1.5 ◦ C as compared with values from the year
2000. A further increase of the mean amount of precipitation, predominately in the cold season,
is predicted. In the north of eastern Siberia, an increase of precipitation amounts by 7–9% and of
snow accumulation by 2–4% in winter is expected [27]. In the late 21st century in eastern Siberia,
the increase of the near surface mean annual air temperature is expected to be 6.1 ± 1.6 ◦ C compared
to the values of the last two decades of the 20th century [28]. The expected near surface mean annual
air temperatures in Yakutsk up to 2015, as estimated at the Permafrost Institute of the Siberian Branch,
Russian Academy of Sciences, applying the frequency analysis method, almost coincide with the
predictions made by GGO. Furthermore, a temperature decrease of 2–3 ◦ C is expected up to the first
half of the 21st century [29,30]. According to predictions made by Neradovky and Skachkov [31],
by 2050, an increase of the mean annual air temperature will pass the achieved climatic level of no
more than 0.7–1.0 ◦ C. Researchers are increasingly concerned about an expected increase of the amount
precipitation in winter and snow accumulation, both of which play a significant role in the increase of
soil temperatures.
      The variability of the main climate elements (air temperature and precipitation) over the study
period at Chabyda station can be determined from the data from Yakutsk weather station—the nearest
one to the study area (Figures 2 and 3). We should mention the high correlation between Yakutsk and
other weather stations in Central Yakutia [1]. The mean annual air temperature (1961–1990 climate
norm) in Yakutsk is -10.0 ◦ C and the mean annual precipitation is 235 mm.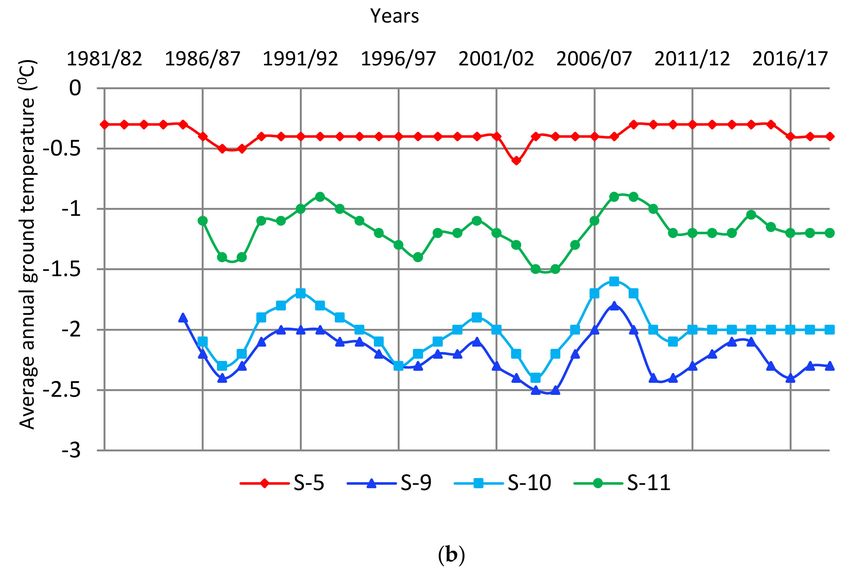
Land 2020, 9, 132                                                                                      6 of 19

      Figure 2. Long-term variability (1980–2019) of the mean annual air temperature in Yakutsk (◦ C).
      The linear trend is shown by the dotted line.

      Figure 3. Long-term variability (1980–2019) of the annual air precipitation total in Yakutsk (mm).
      The linear trend is shown by the dotted line.

      As shown in Figure 2, the trend of the mean annual air temperature increase is significant and
exhibits stable growth. This increase was mainly caused by the growing temperatures in winter
(October to April). In summer (May to September), warming was less evident.
      The data presented in Figure 3 indicate that the recent decades have seen major year-to-year
variations of annual precipitation totals (October to September), but these have not increased in
Yakutsk on the whole. The precipitation total by months and for entire years observed during the last
40 years is close to normal. Nevertheless, it should be noted that, in some years, abnormally large
(1989,1993,2005–2007,2013) and abnormally small (1986,2001,2004) levels of precipitation occurred.
      Thus, the variability of the main climate parameters (air temperature, precipitation, and snow
cover) over the past decades is manifested in different ways. The positive trend of the average annual
air temperature is the most significant. Precipitation and snow cover height experienced short-period
fluctuations without a clear trend.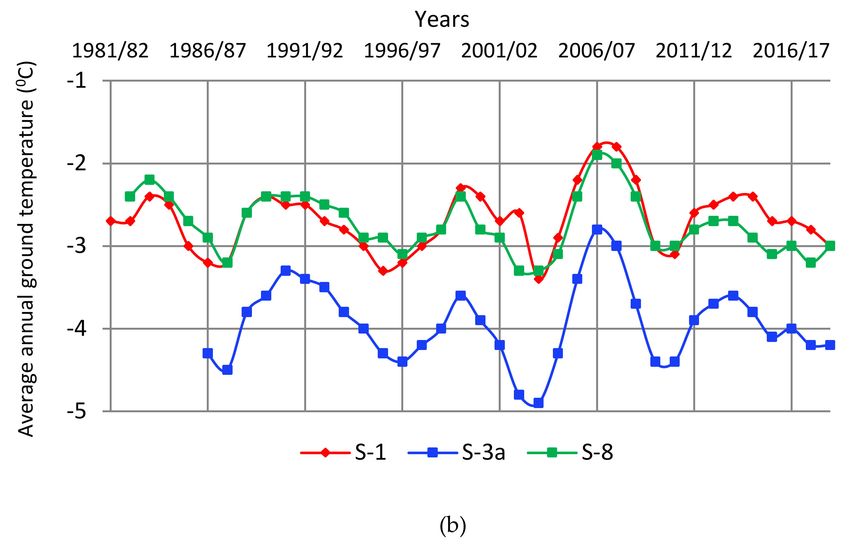
Land 2020, 9, 132                                                                                        7 of 19

3.2. Surface Energy Balance
      A brief review of the radiation regime in the region is presented below based on radiation
measurement data from the Yakutsk weather station [12]. The incoming short-wave radiation is
largely controlled by sun angle, cloud coverage, and day length. The incident solar radiation varies
seasonally over a wide range from 17 (December) to 620–712 MJ/m2 (June). The annual total of
radiation is 3710 MJ/m2 . Approximately 34% of the incoming radiation is reflected back into the
atmosphere. The energy loss is greater during the winter period (75–85%) than in the summer (18–22%).
About one-third of the annual incoming radiation is lost by net long-wave radiation. The heat loss
by net long-wave radiation increases in proportion to the increase in surface temperature from 29–63
MJ/m2 in the winter months to 167–188 MJ/m2 in the summer. During the winter, the net radiation is
negative due to the loss of heat by terrestrial radiation and the reduced solar radiation. Positive net
radiation values occur between late March and mid-October. The average annual total of net radiation
is 904 MJ/2 , or 33% of incoming solar radiation.
      The landscape units displayed different energy balance characteristics depending on surficial
factors. The partially inundating riparian area covered with mosses and grasses (site 2) showed
little variation in albedo during the summer months (18–20%). At the creek valley bottom (site 3),
a 0.1-m-thick icing melted out by late May; therefore, the heat loss by reflection was 1.4 times higher
than at the riparian site. From June to September, the reflectivity of the surface at site 3 with a
moss-shrub cover and hummocky topography was consistently low (15–16%). At the lower and upper
slopes (sites 4 and 5), the albedo of bearberry patches with dead plant spots under the open pine
canopy varied only slightly over the summer. At the bottom of a drainage trough (site 8), the albedo of
the moss-ledum-lingonberry cover under the closed birch and larch canopy was reduced to 12–13 %.
      The net radiation (R) of the moss-shrub cover on the drainage trough bottom was 1.04 times
larger than the R of the riparian site due to the lower albedo. The effective radiation Jef at the open
sites comprised similar fractions of Qс (29%). The reduced solar radiation under the open canopy
forest with crown densities of 0.1–0.2 and 0.2–0.3 at the lower slope and the upper slope, respectively,
resulted in R being 22–31 % smaller compared to the open sites. The seasonal total of R at the surface
under the birch and larch forest with a crown density of 0.7–0.8 was almost twice as low than that at
the open site (Table 2).

                    Table 2. Surface energy balance components at the Chabyda sites, MJ/m2 .

                                                    Months
       Component                                                                               Σ(V-IX)
                          V             VI             VII             VIII        IX
                                                  Open areas
             Q            565           632            603             444        276           2520
                                              Riparian area (site 2)
             S            102           114            121             89          50           476
             Jef          165           145            175             134        107           726
             R            298           373            307             221        119           1318
          P + LE          238           329            272             205        115           1159
             Bn           60            44             35              16          4            159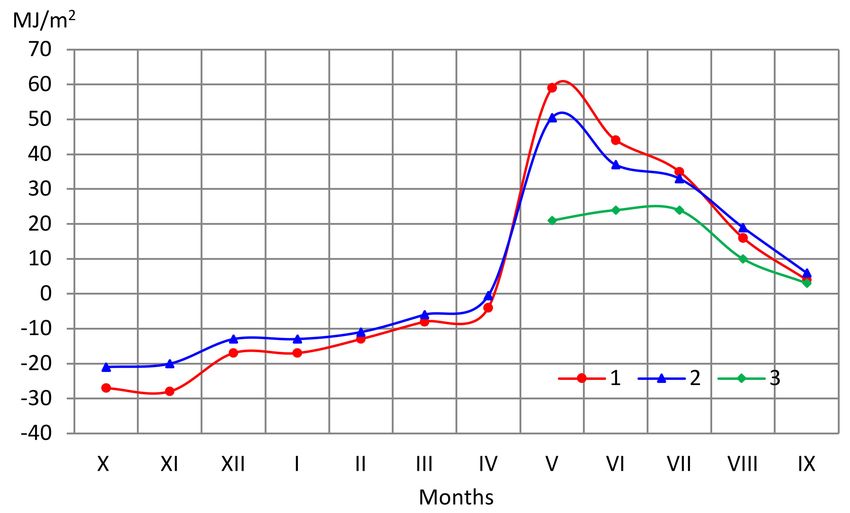
Land 2020, 9, 132                                                                              8 of 19

                                            Table 2. Cont.

                                               Months
       Component                                                                     Σ(V-IX)
                       V           VI            VII            VIII      IX
                                    Moss–ledum forest bog (site 3)
             S        141           95           90             71        41           438
             Jef      140          151           182            139       102          714
             R        282          386           331            234       133         1365
             P         60          227           163            111       83           644
            LE        171          121           133            104       46           575
             Bn        51           38           35             19         4           147
                                         Lower slope (site 4)
             Q        452          505           482            355       220         2016
             S         72           86           82             60        42           342
             Jef      141          120           144            111       87           603
             R        239          300           256            184       91          1070
             P        159          209           160            122       59           709
            LE         58           67           72             52        28           277
             Bn        22           24           24             10         4           84
                                         Upper slope (site 5)
             Q        395          442           422            312       191         1762
             S         59           66           63             59        32           279
             Jef      126          112           133            100       75           546
             R        210          264           226            153       84           937
             P         -           180           138            86        56            -
            LE         -            59           71             61        30            -
             Bn        -            25           17              6        -2            -
                                   Drainage trough bottom (site 8)
             Q        266          303           283            210       153         1213
             S         27           31           27             21        16           121
             Jef       99           91           105            83        53           430
             R        140          181           151            105       85           662
          P+ LE        -           144           110            74        73            -
             Bn        -            37           41             31        12            -

    The evapotranspiration at each site was determined from measurements with two to four
evaporation pans to account for vegetation type (Table 3). Rates of soil water evaporation depend on
energy factors and moisture conditions.
Land 2020, 9, 132 9 of 19
Table 3. Evaporation from the soil surface at the Chabyda sites, mm.
Months
Site no. Surface Cover Σ(V-IX)
V VI VII VIII IX
Moss and grass 78 52 59 38 17 244
3
Moss and ledum 58 45 47 45 19 214
Bearberry 22 26 22 18 8 96
4 Dead plant spot 30 27 34 20 12 123
Lichen 12 17 17 13 8 67
Lingonberry 29 37 43 31 17 157
5 Dead plant spot - 24 28 24 12 -
Bearberry 16 15 21 26 10 88
7 Lichen - 17 21 14 14 -
Dead plant spot 10 41 25 17 8 101
The evaporation rates on the creek valley bottom were higher between May and July, when the
monthly totals of net radiation were largest. In August and September, the reduced net radiation
resulted in a decrease in evapotranspiration by a factor of 1.5–2 despite the sufficiently high soil
moisture contents. At the forest bog site with a moss-grass-shrub cover, the evapotranspiration
averaged over two seasons was 230 mm, which was 1.5 times the mean evapotranspiration from forb
meadow at the Yakutsk monitoring station. The seasonal average latent heat flux LE at the forest bog
site comprised 42% of R.
At the open-canopy forest site on the lower slope (site 4), the evaporative capacity of the vegetation
covers was not the same. For example, the evapotranspiration Eс from the lingonberry cover was
2.3 times higher than that from the lichen cover. The evapotranspiration under the pine forest was
greatly reduced and averaged 110 mm due to both the reduced R and the lower moisture storage in
the sandy soils. Compared to the forest bog (site 3), the evapotranspiration under the pine forest was
approximately twice as low. The ratio of LE to R was 0.26. In Central Yakutia, the LE/R values reported
by Pavlov [10] were 0.18 and 0.35 for open-canopy pine and larch forests, respectively.
An accumulation of heat in the ground at the riparian site occurred between May and September.
The ground heat flux was largest in May and constituted 20% of R. In August and September,
ground heat fluxes comprised only 3–7% of R. Overall, 159 MJ/m2 of heat, or 12% of R, entered the
ground during the thaw season. In October and November, when the snow cover was shallow, the heat
flux was strongly negative, comprising half of the annual heat loss (Figure 4). Between January and
April, heat losses were low due to the thick snow cover. The amount of heat utilized in the snowmelt
process was 20.9 MJ/m2 . Because snow cover depths were greater than the long-term average, the input
components of the ground heat flux through the surface exceeded the outputs. The difference between
the inputs and outputs comprised 28% of the magnitude of the annual heat exchange.
At the forest bog site, the seasonal sum of sensible and latent heat fluxes, P + LE, was 60 MJ/m2
greater than at the bank. Therefore, the ground heat flux was, on a seasonal average, 8% lower despite
the higher R values. The B/R was 11%. During the cold season, the heat flux to the atmosphere was
strongly reduced due to sustained groundwater flow down the gentle slope onto the bog surface.
On an annual basis, the heat input was 1.56 times the heat loss.
The drier sands with a low thermal conductivity under the open canopy (site 4) accumulated
1.7 times less heat during the warm season compared to the forest bog. At site 5, heat accumulation
was strongly reduced in the dry sands due to the small temperature gradients near the surface. The B/R
ratio was 6%, which was also due to the lower moisture content of the sands.Land 2020, 9, 132 10 of 19
Figure 4. Annual course of ground heat flux at the riparian location (1), creek valley bottom (2) and
lower slope (3), from Chabyda.
Comparing the absolute values of the energy balance components among the sites, it can be noted
that they are of the same order for the gentle slope sites. The only difference is in the magnitude of the
sensible heat fluxes, which is attributed to site differences in canopy shading. At the drainage trough
bottom (site 8), the LE and B values are much higher due to the higher soil moisture content and the
significant reduction in sensible heat flux under the larch canopy. As a result, the input component of
heat exchange at this site is 1.7–1.9 times larger than at the slope sites.
In summary, investigations in the Chabyda area provided important information about the
radiation and heat balance characteristics for different landscape units. During the warm season,
the albedo is highest for the riparian site with a moss-grass cover (A = 18–20%) and lowest for the
moss-ledum-lingonberry mat under the larch forest (A = 12–13%). The ratio between the seasonal
totals of net radiation of open sites and under forest canopies with different crown density varies from
1.25 to 2.0. The totals of latent heat flux vary by a factor of about three among the sites depending on
vegetation type and radiation regime. The increased LE and B values at the drainage trough bottom
are attributed to the greater soil moisture content and the reduced sensible heat flux.
3.3. Analysis of Long-Term Variability of Soil Temperature
To date, there is a database for sites 1 and 5 for 39 years of observations, for site 8 for 37 years,
for site 9 for 35 years, and for other sites there are 34 years of observations. Such representative
material allows a qualitative analysis of the variability of the main thermal parameters of the layer of
annual temperature variations and allows us to draw objective conclusions. The idea of the long-term
variability of quantity ξ, Tξ , and Т10 at the experimental sites is given in Table 4.
The greatest fluctuations of Тξ and T10 occurred in landscapes of a shallow-valley type of terrain
(see Table 4 and Figure 5a,b). These changes were mainly determined by the influence of two winter
factors: snow accumulation conditions and the sum of air temperatures during the cold period.
Moreover, the first factor is prevailing in the sharply continental climate of Central Yakutia [13,32,33].
Over the entire observation period, the lowest and highest average annual temperatures at the sites
of the shallow-valley terrain type were noted in hydrological years 2003/04 and 2006/07, respectively
(October–September) (see Figure 5). In the slope type of terrain, the peak of the lower temperature of
the soil also occurred in 2003/04, and the peak of the temperature increase was noted in 2007/2008.
The exception here is site 7b, where the lowest soil temperature was observed in 1987/88 (Figure 6).Land 2020, 9, 132 11 of 19
Table 4. Long-term average and extremes of the main ground thermal parameters within the layer of
annual temperature variations.
Experimental Sites ξ, m Tξ , ◦ C T10 , ◦ C
(Observation
Min Average Max Min Average Max Min Average Max
Periods)
Small valley
1 (1981–2019) 0.81 1.06 1.30 −5.1 −2.8 −0.6 −3.4 −2.7 −1.8
3a (1986–2019) 0.37 0.46 0.53 −7.4 −5.0 −1.3 −4.9 −3.9 −2.8
8 (1982–2019) 0.86 1.17 1.37 −5.5 −3.6 −1.3 −3.3 −2.7 −1.9
8a (1986–2019) 0.65 1.02 1.45 −6.5 −3.3 0.1 −4.5 −3.3 −1.8
Slope
5 (1981–2019) 3.26 3.50 3.86 −0.1 −0.4 −0.1 −0.6 −0.4 −0.3
6б (1986–2019) 3.54 3.78 4.11 0.0 −0.4 0.0 −0.6 −0.4 −0.2
7б (1986–2019) 1.70 1.87 2.00 −0.4 −1.2 −0.4 −1.5 −0.9 −0.3
9 (1985–2019) 1.31 1.51 1.72 −1.0 −2.5 −1.0 −2.5 −2.2 −1.8
10 (1986–2019) 1.63 1.91 2.1 −0.7 −1.8 −0.7 −2.4 −2.0 −1.6
11 (1986–2019) 1.73 1.91 2.27 −0.2 −1.0 −0.2 −1.5 −1.2 −0.9
Figure 5. Cont.Land 2020, 9, 132 12 of 19
Figure 5. Long-term variability of ground temperatures at the base of the active layer (a) and at a depth
of 10 m (b) in the shallow-valley type of terrain at the Chabyda station.
Figure 6. Cont.Land 2020, 9, 132 13 of 19
Figure 6. Long-term variability of ground temperatures at the base of the active layer (a) and at a depth
of 10 m (b) in sthe lope type of terrain at the Chabyda station.
The winter in 2002/03 featured abnormally light snow and had an abnormally late period of
formation of stable snow cover (Figure 7). This was the main reason for the strong cooling of the
soil, despite a fairly warm year. Subsequent years were characterized by snowy winters and higher
than normal rainfall, which led to a sharp increase in soil temperature. In the period from 2002/03 to
2006/07 (2007/08), the temperature of the soils at the bottom of the active layer in these types of terrain
increased by 0.5–6.0 ◦ C and at the depth of zero annual amplitude by 0.3–2.7 ◦ C (see Figures 5 and 6).
Figure 7. Long-term variability of the mean winter snow depth in the slope and shallow-valley types
of terrain at the Chabyda station (dashed and dotted lines are long-term average values).
The warming of the permafrost and deepening of the active layer have accelerated thermokarst,
thermal erosion and other permafrost processes in the region. Water ponding and paludification have
been observed in the low lying areas. These changes have resulted in increased water levels in the
existing lakes, the filling of the previously dry lake basins, and in the rise of the water table in the active
layer. In the water-logged topographic lows, residual thaw layers have developed due to the lowering
of the permafrost table and significant warming of the near-surface ground [20,23]. Thus, 2007 and
2008 were critical years for the permafrost thermal regime in the 40-year period of observations or
even in its century-long history.Land 2020, 9, 132 14 of 19
The winters of 2008/09 and 2009/10 were characterized as abnormally snowy with late periods
of formation of stable snow cover; thus, the soils were much cooled to almost the level of 2002/03,
despite the abnormally warm years.
Subsequent winters were characterized by close to long-term average values of average winter
snow depths, and therefore, mean annual ground temperatures at the active-layer bottom and at the
depth of zero annual amplitude were close to long-term average values. It should be noted that the
correlation between the temperatures at the bottom of the active layer and the average winter snow
depths is quite high (correlation coefficients are 0.55–0.74) [13].
According to long-term observations, trends in the increasing average annual temperatures of
the layer of annual heat rotations are extremely weakly expressed. Noticeable trends in temperature
increase were observed only at two sites: 7b (0.23◦ C/10 years) and 8a (0.33◦ C/10 years) (Table 5).
This was largely caused by the abnormally snowy winters mentioned above, and site 8a was flooded
during several warm seasons with meltwater. In addition, the first years of the analyzed period
(1986–1988) were quite cold. It should also be noted that in these types of terrain at sites 8 and 9,
there are decreasing trends of T10 . This is due, first of all, to an increase in the shading of the surface
under the canopy of the stand with its crowns and the growth of shrubs and shrubs.
Table 5. Trends in mean annual ground temperature at the depth of zero annual amplitude (10 m).
Ground, Experimental Site (S) Trends
Terrain Type Observation Periods
and Number (◦ C/10 year)
Sand (S-8, S-1) 1981–2019 −0.1–0.05
Small valley
Turf, sand (S-3a, S-8a) 1986–2019 −0.02–0.33
Sand (S-5, S-6b, S-7b) 1981–2019 ~0.00–0.23
Slope
Sandy silt, sand (S-10, S-11) 1986–2019 ~0.00–0.02
Loam, sandy silt, sand (S-9) 1985–2019 −0.05
According to long-term observations, the thermal effect of abnormal winters has been
experimentally established. Thus, one warm and less snowy winter can lower the temperature
of the soil more than a cold and snowy one. An abnormally cold winter can produce a stronger effect
than several abnormally warm ones following one after another [32].
The most important conclusion from the results of long-term observations is that the temperature
of the soils experiencing significant interannual and short-period fluctuations associated mainly with
the great variability of the snow accumulation regime has a very weak tendency to increase. Against the
background of significant changes in the average annual air temperature (in Yakutsk for the period
1981–2019, the growth trend was 0.064 ◦ C/year), the thermal state of the layer of annual temperature
variations at the slope-type sites of the Chabyda station area remains stable.
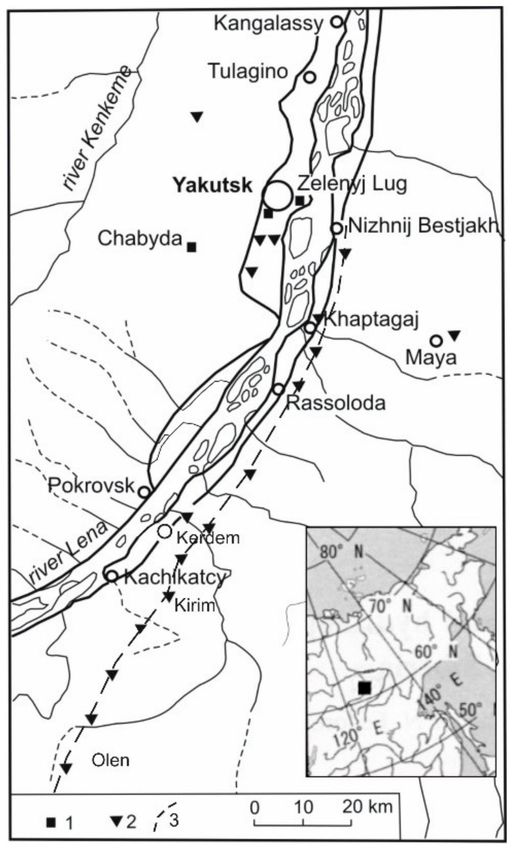
3.4. Analysis of the Long-Term Variability of the Depth of Seasonal Thawing
As is known, the depth of seasonal thawing (ξ) depends on the mechanical composition of soils,
their moisture content, the nature of the vegetation and soil cover. The greatest long-term variability
∆ξ is typical for soils of a shallow-valley type of terrain and makes up 30–55 % of their maximum
extremum. In the slope type of terrain, ∆ξ varies within the range of 14–24 % (see Table 4 and Figure 8).
It was previously believed that the main factors determining the long-term variability of the thickness
of the seasonally thawed layer are the sum of positive air temperatures and summer precipitation.
However, recent developments on this issue show that long-term changes in the depth of seasonal
thawing and the sums of summer air temperatures do not correlate sufficiently well [34].Land 2020, 9, 132 15 of 19
Figure 8. Long-term variability of the active-layer thickness in the shallow (a) and slope (b) types of
localities at the Chabyda station.
The highest values of ξ (3.54–4.11 m) were noted at site 6b (the upper part of the gentle sandy
slope), with the smallest (0.37–0.53 m) noted at Site 3a (the bottom of the brook valley with peat
soil). At ten sites of the station, on average, the maximum thickness ξ (1.81 m) occurred in 1988–1989
and 2006–2008.
Most likely, the ground conditions—namely the moisture content—can majorly affect the thawing
depth. An analysis of the data obtained at the station shows that the largest long-term variabilities of ξ
are characteristic of landscapes of a shallow-valley type of terrain (up to 80 cm). On sites in the slope
type of terrain, these changes were 30–60 cm (see Table 4).
In the shallow-valley type of terrain at sites 3a and 8, a significant increase in the depth of seasonal
thawing was noted. Significant decreasing tendencies are observed at sites of the slope type of terrain
(sites 5, 6b, 9, 11). Additionally, if in the watershed area (Site 9) this decrease can be attributed to the
intensive growth of shrubs, then for sites 5 and 6b, fluctuations in the level of permafrost waters of
the seasonally thawed layer most likely play a significant role. At other sites (7b, 10), with significant
interannual changes in the depth of seasonal thawing, insignificant growth tendencies are observed
(Table 6).Land 2020, 9, 132 16 of 19
Table 6. Trends in the depth of seasonal thawing of soils of the Chabyda station.
Ground, Experimental Site (S) Trends
Terrain Types Observation Periods
and Number (sm/10 Year)
Turf (S-3a) 1986–2019 2.4
Small valley
Sand (S-1, S-8) 1981–2019 −0.8–2.4
Turf, sand (S-8a) 1986–2019 −2.2
Sand (S-5, 6b) 1981–2019, 1986–2019 −7.1–−13.9
Slope Sand, sandy silt (S-7b) 1986–2019 2.2
Loam, sandy silt (S-9) 1985–2019 −3.0
Sandy silt, sand (S-10, S-11) 1986–2019 2.2–−3.0
The maximum depths of seasonal thawing at individual sites were observed in different years.
In the shallow-valley type of terrain (sites 1, 3a, 8, 8a), they were noted in 2007–2008. In the slope
type of terrain, the maxima ξ were revealed in the following years: site 5—1984, site 6b—1995, site
7b—1989, site 9—1991, and site 10 and 11—1988.
Thus, during climate warming, even within local undisturbed areas, an opposite trend can be
detected in modern changes at the depth of the seasonal thawing of soils. This serves as strong evidence
that the thickness of the active layer is not a sensitive indicator of modern climate change.
The analysis of a large amount of experimental data confirmed the conclusion about the weak
response of the depth of seasonal thawing to modern climate changes [35]. The observations
convincingly show that under the conditions of modern climate warming, an increase in the depth of
seasonal thawing of soils does not always occur. Maxima and minima of this value at various sites
of the station are observed, most often in different years. This indicates that the depth of seasonal
thawing depends not only on long-term changes in air temperature in the warm period but also on
other meteorological factors.
4. Conclusions
At the end of the last century, we concluded that the thermal regime of permafrost soils was
stable and their reaction to climate variability was weak [36]. Subsequent years have confirmed
this conclusion.
Based on the analysis of the 39-year monitoring, the main conclusions are as follows:
1. The radiation and heat balance characteristics have been determined for different landscape
conditions in the Chabyda area.
2. The long-term dynamics of the thermal state of the layer of annual temperature variations during
climate warming indicates the thermal stability of both high-temperature and low-temperature
permafrost. The main regulatory factor in the dynamics of the thermal state of permafrost soils is
the snow accumulation mode.
3. The depth of seasonal thawing, despite significant interannual fluctuations, weakly responds to
climate warming and has no significant trends.
4. The results of studies of the thermal regime of soils can be extended to similar landscapes of
Central Yakutia.
5. The practical value of the materials obtained at the Chabyda station also lies in the fact that the
observation results can be used to model heat transfer processes in natural landscapes.
Author Contributions: All authors—S.P.V., Y.B.S., and P.N.S.— made a significant contribution to the published
work. All authors have read and agreed to the published version of the manuscript.
Funding: This research received no external funding.Land 2020, 9, 132 17 of 19
Acknowledgments: Support for the long-term thermal monitoring of upper permafrost has been provided by the
Melnikov Permafrost Institute Siberian Branch of the Russian Academy of Sciences as part of its fundamental
research programs, agreements with the Institute “Mosgiprotran” of the USSR, JSC “Projecttransstroy” of the
Russian Federation, the Ministry of Transport of the Republic of Sakha (Yakutia), JSC “Railways of Yakutia”.
The manuscript was prepared with the financial support of RFBR grants 18-44-140008 and 18-45-140029.
Conflicts of Interest: The authors declare no conflict of interest. The funders had no role in the design of the
study; in the collection, analyses, or interpretation of data; in the writing of the manuscript, or in the decision to
publish the results.
References
1. Skachkov, Y.B. Climate change trends in Central Yakutia at the turn of XX-XXI centures. In Proceedings
of the International Scientific Conference, Irkutsk, Russia, 17–21 September 2012; Publishing House of the
Sochava Institute of Geography SB RAS: Irkutsk, Russia, 2012; Volume 1, pp. 236–238. (In Russian).
2. Melnikov, P.I. Permafrost in the Yakutsk area. In Permafrost Investigations in YaSSR; USSR Acad. Sci. Press:
Moscow-Leningrad, Russia, 1950; Volume 2, pp. 52–70. (In Russian)
3. Solov’ev, P.A. Permafrost in the Northern Part of the Lena-Amga Watershed; USSR Acad. Sci. Press: Moscow,
Russia, 1959; 144p. (In Russian)
4. Shimanovskii, S.V. Effect of pavements on the ground thermal regime. In Permafrost Investigations in the Yakut
Republic; Knizhnoe IZDATEL’stvo: Yakutsk, Russia, 1942; pp. 44–55. (In Russian)
5. Gerasimov, N.N. Annual ground temperature variations in the Yakutsk area. In Permafrost Investigations in
the Yakut Republic; USSR Acad. Sci. Press: Moscow, Russia, 1950; pp. 179–191. (In Russian)
6. Efimov, A.I. Selected results of 3-year ground temperature observations in the Yakutsk area. In Permafrost
Investigations in the Yakut Republic; USSR Acad. Sci. Press: Moscow, Russia, 1952; Volume 3, pp. 8–19.
(In Russian)
7. Ivanov, N.S. On the thermal regime of the upper earth crust in the Yakutsk area. In Heat and Mass Exchange in
Frozen Layers of the Earth Crust; USSR Acad. Sci. Press: Moscow, Russia, 1963; pp. 9–55. (In Russian)
8. Are, F.E. Ground temperature regime beneath a draining thaw lake in Central Yakutia. In Issues of the
Geography of Yakutia; Gidrometeoizdat: Leningrad, Russia, 1973; pp. 70–75. (In Russian)
9. Gavrilova, M.K. Thermal balance of larch forest in the Leno-Amginsky interfluve. In Hydro-Climatic Studies
in the Forests of Siberia. Relationship between the Forest and the Environment; Nauka: Moscow, Russia, 1967;
pp. 28–52. (In Russian)
10. Pavlov, A.V. Heat Exchange between Soil and Atmosphere in Northern and Temperate Latitudes of the USSR;
Yakutskoe knizhnoe IZDATEL’stvo: Yakutsk, Russia, 1975; p. 302. (In Russian)
11. Pavlov, A.V. Thermal Physics of Landscapes; Nauka: Novosibirsk, Russia, 1979; 284p. (In Russian)
12. Skryabin, P.N.; Varlamov, S.P.; Skachkov, Y.B. Interannual Variability of the Ground Thermal Regime in the Yakutsk
Area; SB RAS Press: Novosibirsk, Russia, 1998; 144p. (In Russian)
13. Varlamov, S.P.; Skachkov, Y.B.; Skryabin, P.N. Ground Temperature Regime in Permafrost Landscapes of Central
Yakutia; Permafrost Institute Press: Yakutsk, Russia, 2002; 217p. (In Russian)
14. Gavriliev, P.P.; Mandarov, A.A.; Ugarov, I.S. Hydrothermal Reclamation of Agricultural Lands in Yakutia; Nauka:
Novosibirsk, Russia, 1984; 201p. (In Russian)
15. Ugarov, I.S.; Mandarov, A.A. Overhead Irrigation of Fodder Crops in Central Yakutia; Permafrost Institute Press:
Yakutsk, Russia, 2000; 128p. (In Russian)
16. Fedorov, A.N.; Maximov, T.C.; Gavriliev, P.P.; Argunov, R.N.; Cherosov, M.M.; Desyatkin, A.R.; Desyatkin, R.V.;
Dolman, A.Y.; Efremov, P.V.; Efremov, V.N.; et al. Spasskaya Pad: Integrated Investigations of the Permafrost
Landscapes; Permafrost Institute SB RAS Press: Yakutsk, Russia, 2006; 210p. (In Russian)
17. Pavlov, A.V. Permafrost Monitoring; Academic Publishing House “Geo”: Novosibirsk, Russia, 2008; 229p.
(In Russian)
18. Romanovsky, V.E.; Drozdov, D.S.; Oberman, N.G.; Malkova, G.V.; Kholodov, A.L.; Marchenko, S.S.;
Moskalenko, N.G.; Sergeev, D.O.; Ukraintseva, N.G.; Abramov, A.A.; et al. Thermal state of permafrost in
Russia. Permafr. Periglac. Proc. 2010, 21, 136–155. [CrossRef]Land 2020, 9, 132 18 of 19
19. Varlamov, S.P.; Skachkov, Y.B.; Skryabin, P.N.; Shender, N.I. Thermal state of upper permafrost in Central
Yakutia under contemporary climate change. Permafrost Engineering. In Proceedings of the IX International
Symposium, Mirny, Russia, 3–7 September 2011; Melnikov Permafrost Institute SB RAS Press: Yakutsk,
Russia, 2011; pp. 398–403. (In Russian).
20. Varlamov, S.P.; Skachkov, Y.B.; Skryabin, P.N.; Shender, N.I. Thermal State of the Upper Horizons of
the Permafrost in Central Yakutia. In Proceedings of the Tenth International Conference on Permafrost,
Vol. 2: Translations of Russian Contributions, Salekhard, Yamal-Nenets Autonomous District, Russia,
25–29 June 2012; The Northern Publisher: Salekhard, Russia, 2012; pp. 481–488.
21. Varlamov, S.; Skachkov, Y.; Skryabin, P. Current climate change effects on the ground thermal regime in
Central Yakutia. Sci. Cold Arid Reg. 2014, 6, 282. [CrossRef]
22. Skachkov, Y.B.; Skryabin, P.N.; Varlamov, S.P. Near-surface ground temperature variations at the Yakutsk
permafrost thermal monitoring site during the last 40 years. In Permafrost Engineering. In Proceedings of
the IX International Symposium, Mirny, Russia, 3–7 September 2011; Melnikov Permafrost Institute SB RAS
Press: Yakutsk, Russia, 2011; pp. 444–449. (In Russian).
23. Varlamov, S.P.; Skachkov, Y.B.; Skryabin, P.N. Evolution of the thermal state of permafrost under climate
warming in Central Yakutia. Holocene 2019, 29, 1401–1410. [CrossRef]
24. Pavlov, A.V. Current state of the monitoring of the permafrost of Russia development challenges.
In Proceedings of the 1st Conference of Geocryologists of Russia, Book 3, Moscow, Russia, 3–5 June 1996;
MGU Publishing House: Moscow, Russia, 1996; pp. 327–336. (In Russian).
25. Second Assessment Report of Rosgodromet of Russia on Climate Changes and Their Consequences the
Territory of the Russian FEDERATION. 2014. Electronic resource Access Code. Available online: http:
//downloads.igce.ru/publications/OD_2_2014/v2014/htm/1.ht (accessed on 20 November 2015). (In Russian).
26. 6th National Communication of the Russian Federation. 2014. Electronic Resource, Access Code. Available
online: http://downloads.igce.ru/publications/nac_soobs/nc_2014.pdf (accessed on 30 November 2015).
(In Russian).
27. Federal Service for Hydrometeorology and Environmental Monitoring (Roshydromet). Strategic Prediction
for the Period of up to 2010–2015 of Climate Change Expected in Russia and Its Impact on Sectors of the Russian
National Economy; Rosgidromet: Moscow, Russian, 2005; 28p. (In Russian)
28. Meleshko, V.P.; Kattsov, V.M.; Govorkova, V.A.; Sporyshev, P.V.; Shkol’nik, I.M.; Shneerov, B.E. Climate of
Russia in the 21st century. Part Future climate changes calculated with an ensemble of coupled
atmosphere-ocean general circulation CMIP3 models. Russian Meteorol. Hydrol. 2008, 33, 541–552.
(In Russian) [CrossRef]
29. Shender, N.I.; Romanovsky, V.E.; Tetelbaum, A.S. A forecast of the natural variability of climate in Yakutsk
and Fairbanks. Nauka Obraz. 1999, No 2 (14), 24–29, In Russian.
30. Romanovsky, V.E.; Sazonova, T.S.; Balobaev, V.T.; Shender, N.I.; Sergeev, D.O. Past and recent changes in air
and permafrost temperatures in eastern Siberia. Glob. Planetary Chang. 2007, 56, 399–413. [CrossRef]
31. Neradovsky, L.G.; Skachkov, Y.B. Prediction of air temperatures in Yakutia up to Permafrost Engineering.
In Proceedings of the IX International Symposium, Mirny, Russia, 3–7 September 2011; Melnikov Permafrost
Institute SB RAS Press: Yakutsk, Russia, 2011; pp. 389–393. (In Russian).
32. Skachkov, Y.B. Anomalous winters and their role in the formation of the thermal regime of soils.
In Proceedings of the 3rd Conference of GeoCryologists of Russia, Book 3, Moscow, Russia, 1–3 June 2005;
MGU Publishing House: Moscow, Russia, 2005; pp. 239–244. (In Russian).
33. Skachkov, Y.B. Modern climate warming in Yakutia. In VIII Scientific Meeting of Geographers of Siberia and the
Far East: Materials of Russian. Conf., Vol. 1, Irkutsk, Russia, 27–29 November; Publishing House of the Sochava
Institute of Geography SB RAS: Irkutsk, Russia, 2007; pp. 92–93. (In Russian)
34. Pavlov, A.V.; Skachkov, Y.B.; Kakunov, N.B. The correlation between perennial changes of soil seasonal
thawing depth and meteorological factors. Earths Cryosphere 2004, 8, 3–11. (In Russian)Land 2020, 9, 132 19 of 19
35. Pavlov, A.V.; Ananyeva, G.V.; Drozdov, D.S.; Moskalenko, N.G.; Dubrobin, V.A.; Kakynov, N.B.; Minailov, G.P.;
Skachkov, Y.B.; Skryabin, P.N. Monitoring of seasonally thawed layer and temperature of frozen soil in the
north of Russia. Earths Cryosphere 2002, 4, 30–39. (In Russian)
36. Skryabin, P.N.; Varlamov, S.P.; Skachkov, Y.B. Climate warming and monitoring of thermal state of soils in
Central Yakutia. In Problems of Geocryology; SB RAS Publishers: Yakutsk, Russia, 1998; pp. 31–39. (In Russian)
© 2020 by the authors. Licensee MDPI, Basel, Switzerland. This article is an open access
article distributed under the terms and conditions of the Creative Commons Attribution
(CC BY) license (http://creativecommons.org/licenses/by/4.0/).You can also read