MODELLING THE IMPACT OF SPENDING ON DEFENCE MAINTENANCE ON FLOOD LOSSES - Summary Report
←
→
Page content transcription
If your browser does not render page correctly, please read the page content below

MODELLING THE
IMPACT OF SPENDING
ON DEFENCE
MAINTENANCE ON
FLOOD LOSSES
Summary Report
May 2021
Contact details
Ruth Power
ruth.power@jbarisk.com
00 44 1756 733 919

Revision History
  Revision Ref / Date Issued              Amendments                      Issued to

  Final Report/May 2021                                                   Flood Re/ABI

Contract
This report describes work commissioned by both Flood Re and the ABI. Flood Re’s
representative for the contract was Emma Bergin. ABI’s representative for the contract was
Laura Hughes. Several staff members from JBA carried out this work.

Prepared by:
Jonathan Garrett BEng
Angus Pettit BSc MSc CEnv CSci MCIWEM C.WEM
Simon Waller BEng CEng MICE
Ian Millinship BSc MSc CGeog(GIS)
Ruth Power BBS PgCert ACII

Reviewed by:
Simon Waller BEng CEng MICE

Disclaimer and Copyright
© JBA Risk Management Limited 2021
This summary report has been prepared as a deliverable for Flood Re and the Association of
British Insurers (ABI). JBA Risk Management Limited accepts no responsibility or liability for
any use that is made of this document or the results and information it includes other than by
Flood Re and the ABI for the purposes for which it was originally commissioned and prepared.
Readers are cautioned against placing undue reliance upon any statements contained herein.
This summary report and its contents are part of the deliverable for the Project ‘Modelling the
impact of spending on defence maintenance on flood losses’ and are bound by the terms and
conditions laid out in the contract for that Project, titled Q20-0485_Flood_Re_ABI Services
Agreement_JBA_20200619 and signed by Jane Toothill on behalf of JBA, Andy Bord on
behalf of Flood Re and James Dalton on behalf of ABI on 30 June 2020 ("The Agreement"),
which lays out JBA's entire liability in relation to the information contained herein.
Copyright and all other intellectual property rights in the summary report and its contents
belong to and shall remain the property of JBA Risk Management Limited. Flood Re and ABI
shall not (save only as may be permitted by law and not otherwise) copy, reproduce, record,

Modelling the impact of spending on defence maintenance on flood losses                    Page 2 of 21
CONFIDENTIAL © JBA Risk Management Limited 2021                                       www.jbarisk.com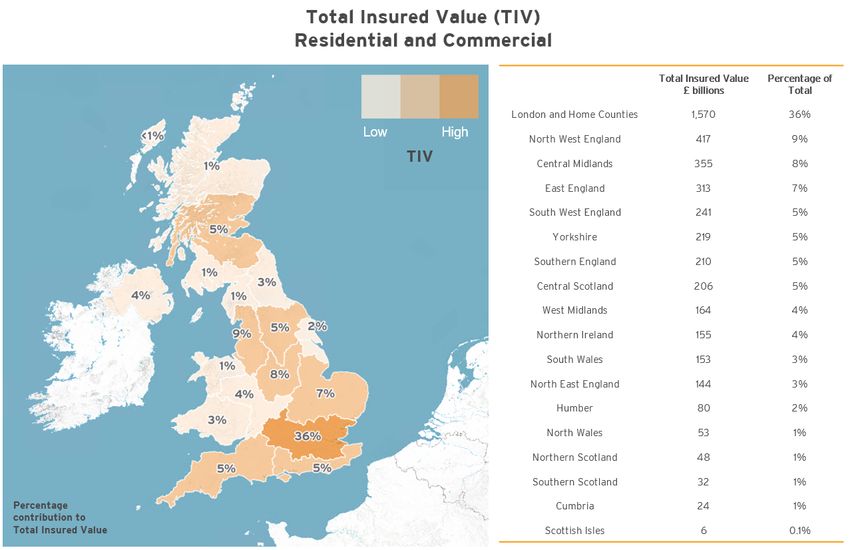
adapt, modify, reformat, reverse compile any content in whole or in part, or do any other such
act which might affect the rights or interests of JBA Risk Management Limited.
For the avoidance of doubt, and notwithstanding anything to the contrary in The Agreement,
Flood Re and ABI acknowledges that the contents of this document deal with the probabilities
of natural hazards which are highly uncertain and accordingly that JBA Risk Management
Limited cannot and does not represent, warrant or guarantee the accuracy of the data, its
indications, estimates or outputs. Flood Re and ABI further accepts that the output is
developed using information compiled and provided by third parties and includes information
based on third party information which is not guaranteed, and that accordingly JBA Risk
Management Limited is unable to provide and gives no warranty, guarantee or other
assurance that the output is accurate, complete or up to date. JBA Risk Management Limited
does not warrant that the output or material derived from the output of this project will meet
the present or future requirements of Flood Re and ABI, or any third party to which the output
or such material is supplied. JBA Risk Management Limited does not warrant that the output
will be delivered without interruption, fault or errors. Flood Re and ABI is cautioned against
placing undue reliance upon any statements contained in the output from this project.

Acknowledgements
Emma Bergin, Gary McInally of Flood Re and Sarah Brodie of ABI for their input. Guy
Carpenter for residential market portfolio, PERILS Industry and Exposure Loss Database
2020 utilised in commercial portfolio, Environment Agency for their input and datasets,
contains Environment Agency information © Environment Agency and/or database right, JBA
Risk Management Limited basemap © Mapbox, © OpenStreetMap

Modelling the impact of spending on defence maintenance on flood losses            Page 3 of 21
CONFIDENTIAL © JBA Risk Management Limited 2021                             www.jbarisk.com
Executive Summary
To support Flood Re and the Association of British Insurers (ABI), JBA carried out a research
project evaluating the benefits of maintaining flood defences over a 30-year period for several
different spending scenarios. This study explored the relationship between inland flood
defence maintenance and flood defence failure due to breaching (caused by structural failure).
It also estimated the total benefit derived from river flood wall and embankment defences and
the associated upkeep costs of these defences.
Key Finding 1: river flood defences provide a benefit of £568m per year.
       • The total river flood loss without raised flood defences results in estimated modelled
          flood losses of approximately £956m per annum. With the defences in place, inland
          river flood loss reduces to £388m per annum. This estimate does not consider the
          effect of maintenance, or the possibility that a defence fails. The benefit of flood
          defences, performing as they were designed to do, is therefore £568m per annum.
          Four flood defence maintenance regimes were tested to determine the impact on
          breach failure and effective defence lifespan before replacement. The maintenance
          regime varied on the amount spent. The current maintenance regime was assumed
          to be target condition grade 3 (Fair condition). The three other maintenance regimes
          were a 50% increase in maintenance spending, 50% decrease in maintenance
          spending and a minimum spend scenario.
Key Finding 2: losses due to river flood defence breaching are not sensitive to
adjusting the balance between defence maintenance and capital spending.
       • The results of the analysis show that losses due to breaching were not sensitive to
          the different spend scenarios. Annual river flood losses only varied by £0.2m, with
          the increase in flood losses due to breaching lying between £1.3m and £1.5m.
Key Finding 3: recent experience has demonstrated that well-funded flood defence
systems rarely breach.
       • This reflects a robust baseline protection standard to which defences are maintained,
          or replaced, and corresponds to a documented record of very few real world defence
          breach events. The breach record is sparse despite several severe flood events in
          recent years. This appears to show that as long as a defence is not allowed to
          deteriorate to, and remain in, a very poor condition, defence systems in the UK are
          unlikely to breach.
Key Finding 4: for every £1 increase in maintenance spending almost £7 is saved in
capital spending.
       • The impact of maintenance on the long-term cost of flood defences was also
          modelled by considering the impact on the effective defence lifespan. Unit
          maintenance and capital cost were supplied or calibrated against Environment
          Agency data. Defences were considered to need replacing once they deteriorated to
          condition grade 4 (Poor condition). The results show that an increase in maintenance
          spending can extend the life of the defences significantly and thus reduce the overall
          capital replacement costs. The increase in maintenance costs is more than offset by
          this reduction in capital spending. This trend in maintenance spending is also true in
          reverse: if maintenance spending is cut, flood defence lifespan decreases and the
          overall annual costs increase in the long term. Ultimately for every £1 increase in
          maintenance spending almost £7 is saved in capital spending.
          The cost of defence upkeep, the flood damage prevented and the overall net benefit
          of the defences, as an average annual benefit, is presented for each of the tested
          scenarios in the table below. The greatest benefit (£371m) was achieved by
          increasing spending on maintenance by 50%.
  Scenario              Maintenance Cost £m          Capital Cost £m      Benefit £m   Net Benefit £m
 Minimum spend         2                             443                  566          121
 Decrease spend        14                            316                  566          236
 Current spend         27                            255                  567          284
 Increase spend        42                            154                  567          371

Modelling the impact of spending on defence maintenance on flood losses                      Page 4 of 21
CONFIDENTIAL © JBA Risk Management Limited 2021                                        www.jbarisk.com
Contents
Executive Summary .................................................................................................................. 4
Contents ................................................................................................................................... 5
List of Figures ........................................................................................................................... 6
List of Tables ............................................................................................................................ 6
Abbreviations ............................................................................................................................ 6
           Introduction .................................................................................................... 7
1.1        Flooding and economic losses in the UK........................................................ 7
1.2        Historical flood defence breach ...................................................................... 7
1.3        Assessment of four maintenance scenarios ................................................... 7
           Current maintenance state ............................................................................. 9
2.1        Environment Agency defences in England ..................................................... 9
2.2        Assessment of defence condition in the UK ................................................... 9
           Average Annual Loss ................................................................................... 10
3.1        Defended Modelled Loss.............................................................................. 10
3.2        Average Annual Loss for four spending scenarios........................................ 13
           Maintenance costs for four spending scenarios ............................................ 13
4.1        Maintenance spending for four scenarios ..................................................... 13
4.2        Capital replacement costs for four maintenance scenarios ........................... 15
           Overall net benefits from maintenance ......................................................... 15
           Conclusion ................................................................................................... 17
           Limitations .................................................................................................... 17

Modelling the impact of spending on defence maintenance on flood losses                                                      Page 5 of 21
CONFIDENTIAL © JBA Risk Management Limited 2021                                                                    www.jbarisk.com
List of Figures
Figure 1: Distribution of funding for asset maintenance and other preventative work
(information extracted from NAO 2014 report)4 .................................................................. 8
Figure 2: Defence condition grade (wall and embankment) breakdown by country. ........................ 10
Figure 3: Percentage of Residential and Commercial Total Insured Value in the UK by region. ..... 11
Figure 4: Percentage of AAL from river flooding to Residential and Commercial Property in the
UK by region. .................................................................................................................... 11
Figure 5: A bivariate thematic map indicating the relationship between high total insured value
and high annual average loss from river flooding in the UK by region. ............................. 12
Figure 6: Annual average upkeep costs. ......................................................................................... 14
Figure 7: Annual average costs and benefits. .................................................................................. 15
Figure 8: Annual average net benefit ............................................................................................... 16
List of Tables
Table 1: Condition Grade Description. .............................................................................................. 9
Table 2: Current Annual Average Loss of River Flooding by Country and by exposure type ......... 12
Table 3: Average Annual Loss per spending scenario ................................................................... 13
Table 4: Total estimated annual costs ............................................................................................ 14
Table 5: Average increase in defence life expectancy .................................................................... 14
Table 6: Annual average cost and net benefit (£). .......................................................................... 16
Abbreviations
AAL ................................. Average Annual Loss
DEFRA ............................ Department of Environment, Food & Rural Affairs
EA ................................... Environment Agency, England
EIOPA ............................. European Insurance and Occupational Pensions Authority
FSR ................................. Flood Studies Report
Modelling the impact of spending on defence maintenance on flood losses Page 6 of 21
CONFIDENTIAL © JBA Risk Management Limited 2021 www.jbarisk.comIntroduction
1.1 Flooding and economic losses in the UK
Flooding in the UK continues to have a devastating impact on society. Severe flooding causes
damage to property, infrastructure and agriculture. It can also tragically result in loss of life.
Flooding in the last two decades has occurred after more extreme rainfall and has caused
more economic damage than has previously been seen. Six of the ten wettest years on record
have occurred since 1998 (Met Office, 2020) and overall in the UK, the period 2010-2019 has
been 5% wetter than 1961-1990 (Met Office, 2020). More details on recent flood events are
given below, emphasising the ongoing need to maintain flood defences protecting property.
• The flood events that occurred during the 2013/14 winter months incurred total
economic damages of approximately £1.3 billion (Environment Agency, 2016). The
winter flood events of 2016 (following storms Desmond, Eva and Frank) caused an
estimated £1.6 billion in damages (Environment Agency, 2016).
• The flooding of summer 2007 occurred after one of the wettest May and June periods
since records began in 1766. Over 55,000 homes in the Midlands and Home
Counties were flooded, with losses totalling £3.2 billion in economic damages
(Thorne, 2014).
The economic cost of flooding in 2019/2020 was estimated to be £78 million. The cost would
have been £2.1 billion higher without flood defences (Environment Agency, 2021). This
emphasises the importance of maintaining flood defences across the UK. In 2020 the
Environment Agency announced an investment in flood defences (for both capital and
revenue) of £5.2 billion, creating approximately 2,000 new flood and coastal defences to
improve protection to 336,000 properties in England by 2027 (Environment Agency, 2020).
However, flooding remains a significant risk in the UK.
1.2 Historical flood defence breach
From research carried out on historical events it was found that flood defence breach (failure)
is not a significant problem in the UK. A key area of interest for this study was the damages
that occur as a result of structural failure. In particular, related to differences in maintenance
spending scenarios. In order to do so it is necessary to understand the historic performance
of flood defences in the UK.
Events were researched over the last 23 years – including the June and July floods 2007, the
Cumbria floods 2009, and Storms Desmond, Eva and Frank amongst others. It was found
that while the UK has suffered major flood events there have not been widespread flood
defence breaches (failures). Many flood defences were overtopped, but this generally did not
lead to structural failure. Research carried out within this project suggests there has been
under-reporting of breaches, perhaps because they often occurred in areas where little
damage was caused by the breach.
Damage does occur to defences during flood events and some of this requires emergency
repairs to ensure the structural integrity of defences. There is no systematic collection of flood
defence breaches and therefore it is likely that breaches have occurred that were not
recorded.
The limited data available point to the likelihood that a major, large geographical-scale flood
event will typically cause in the order of 10 defence breaches. It may be reasonable to estimate
that a very large event, the like of which we have not seen, might cause in the order of 100
breaches, but we should not expect thousands. For minor events, either in terms of
geographical scale or rainfall intensity, we should generally see no defence breaches for most
events. The historical record of failures implies that maintained defences fail infrequently.
1.3 Assessment of four maintenance scenarios
Estimates of current maintenance spending on flood defence assets are not widely available
other than the review by the National Audit Office in 20144. This suggested that maintenance
spending between 2010-11 and 2014-15 was in the region of £160m annually, with
approximately 35% applicable to maintaining defences.
Modelling the impact of spending on defence maintenance on flood losses Page 7 of 21
CONFIDENTIAL © JBA Risk Management Limited 2021 www.jbarisk.comFigure 1: Distribution of funding for asset maintenance and other preventative work (information extracted from NAO 2014
report)4
The assessment set out here demonstrates the benefits of maintaining river flood defences
over a 30-year period. In particular, the impact of maintenance spending on damages due to
flood defence breach (structural failure). The assessment accounted for flood walls and
embankments. Four spending scenarios are considered over a 30-year period. The spending
scenarios include:
• Minimum spending – reduce maintenance spending to the legal minimum
• Reduced spending – decrease maintenance spending by 50%
• Maintain current maintenance spend
• Increased spending – increase current maintenance spending by 50%
The modelling of potential losses was carried out using JBA’s UK Flood catastrophe model.
JBA’s UK Flood Model 2018 has been updated to include 2019 river flood defended areas for
the purposes of this study (referred to hereafter as JBA’s UK Flood Model). This model
simulates loss to property from flooding across the UK and has been utilised to model river
flood.
Modelling the impact of spending on defence maintenance on flood losses Page 8 of 21
CONFIDENTIAL © JBA Risk Management Limited 2021 www.jbarisk.comCurrent maintenance state
2.1 Environment Agency defences in England
This section outlines the current maintenance state of Environment Agency defences in
England. An assessment of the Environment Agency’s defences in 2000 showed that 64% of
linear defences were classed as “Good” or “Very Good” 1. The same assessment carried out
in 2021 reduces this percentage to just 33%2. A report by the National Audit unit in 2007 and
2014 highlighted possible deficiencies in the Environment Agency’s flood defence funding in
order to sustain defences to their target condition grade. In 2007, the EA stated: “The Agency
estimates that an extra £150 million a year would be needed over the next ten years to bring
all its systems up to their target condition” 3. Each year new flood defence schemes are being
built which increases maintenance demand. However, instead of increasing, maintenance
spending has actually been reduced. Between 2010 and 2014, excluding a one-off emergency
repair fund, total maintenance spending decreased by 14% 4. In an effort to direct maintenance
where it provides the most economic return, high consequence defences have been targeted
at the expense of low consequence defences. In 2007 all low consequence defences,
approximately half of all defences at the time, were maintained at the lowest allowable
maintenance regime. This results in faster deterioration of the defences. In 2021, the
Environment Agency confirmed that their maintenance regime now aims to implement target
condition grade 3 for the majority of their assets, approximately 85%5.
2.2 Assessment of defence condition in the UK
This section summarises the condition grade for walls and embankment defences across the
UK maintained by governmental organisations. The condition grade is an important metric in
determining the remaining life of a defence. Condition grade is based on the Condition
Assessment Manual, CAM, (Environment Agency 2012). There are five grades, with their
general descriptions provided below:
Table 1: Condition Grade Description.
Condition Grade Description of condition
1 Very good
2 Good
3 Fair
4 Poor
5 Very poor
Environment Agency and Natural Resources Wales’ spatial flood defence datasets were used
to assess general state of wall and embankment defences. The data was supplemented with
JBA data to provide a more complete picture. Figure 2 shows the current maintained state of
flood defences in England and Wales. Defences classed as “Fair” have some defects that
could reduce performance but the risk of failure due to breach remains low. Unless failure of
a defence would result in significant damage, maintaining a defence in fair condition is
considered to be an acceptable target. The vast majority of defences (wall and embankments)
across the UK (~92%) are in a fair or better condition. Approximately 6% are considered poor
requiring further investigation and repair. Approximately 2% are considered very poor
requiring immediate replacement or significant reconstruction.
1 Inland Flood Defence - National Audit Office Report HC 299 Session 2000-2001: 15 March 2001
2 Based on England wall and embankment’s condition grade from JBA’s shapefile
“UK_DefenceLines_forPDF”
3 NAO - Building and maintaining river and coastal flood defences in England - HC 528 Session 2006-
2007 | 15 June 2007 – Pg 19
4 Strategic flood risk management – DEFRA and National Audit Office - HC 780 – November 2014
5 Email communication between A.Rushworth of the Environment Agency and R.Power of JBA dated 9
April 2021
Modelling the impact of spending on defence maintenance on flood losses Page 9 of 21
CONFIDENTIAL © JBA Risk Management Limited 2021 www.jbarisk.comThe Environment Agency has defined defence deterioration rates for a range of defence types
and maintenance regimes. The method employed in this study assumes that a change in
defence maintenance spend can be interpolated between the deterioration rates of each
maintenance regime. The current defence maintenance regime is assumed to be
representative of target condition grade 3. The Environment Agency also specifies a fastest,
average, and slowest deterioration rate for each maintenance regime. The interpolation
between difference maintenance regimes has been based on the ‘average’ deterioration rate.
The higher the spend in maintenance regime the slower the defence deterioration rate. The
same asset deterioration rates have been applied to the defences in the rest of the UK.
Figure 2: Defence condition grade (wall and embankment) breakdown by country.
Figure 2 shows a breakdown of defence (wall and embankment) condition grade broken down
by country. It can be seen that the majority of defences are in a fair or better condition. Where
flood defence condition grade information was unavailable, as was the case for Scotland and
Northern Ireland, the defences were assumed to be in condition grade 3 (fair).
Average Annual Loss
3.1 Defended Modelled Loss
Average Annual Loss represents the expected cost of flooding on average per year. This
annual cost is calculated by averaging the losses over each year of the simulation, in this case
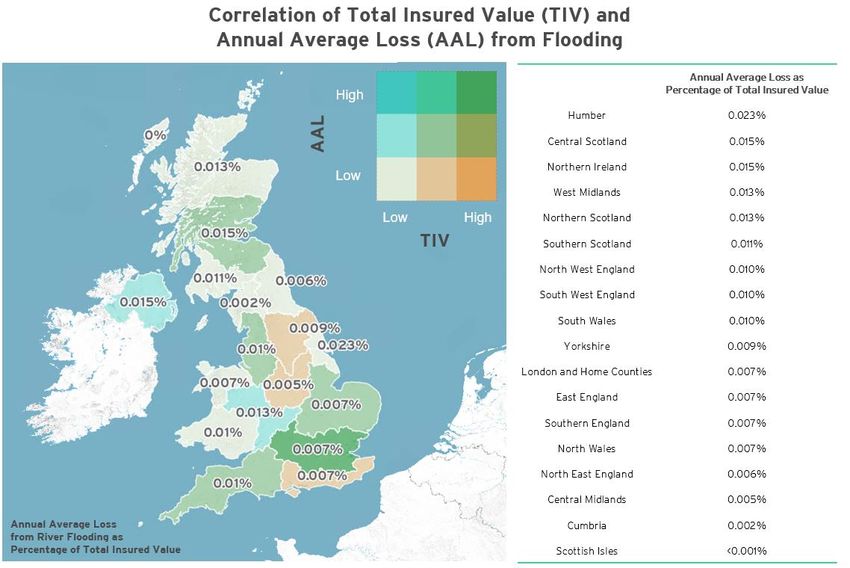
10,000-years. The Total Insured Value (TIV) is the rebuild or replacement value of assets
included under an insurance policy and includes buildings, contents and business interruption
values. The distribution of TIV by region in the UK is illustrated in Figure 3.
Modelling the impact of spending on defence maintenance on flood losses Page 10 of 21
CONFIDENTIAL © JBA Risk Management Limited 2021 www.jbarisk.comFigure 3: Percentage of Residential and Commercial Total Insured Value in the UK by region.
Given the current state of flood defences in the UK, the annual average loss (AAL) as a result
of river flooding to residential and commercial property67 is estimated at £388 million. At a
regional level, loss from river flooding correlates generally with the distribution of TIV as
indicated in Figure 4.
Figure 4: Percentage of AAL from river flooding to Residential and Commercial Property in the UK by region.
6 Residential market portfolio supplied by Guy Carpenter
7
Commercial portfolio incorporates data using PERILS UK Flood Exposure and Loss Database
Modelling the impact of spending on defence maintenance on flood losses Page 11 of 21
CONFIDENTIAL © JBA Risk Management Limited 2021 www.jbarisk.comFor example, London and the Home Counties contributes to 30% of the AAL and contains
36% of the TIV. North Wales and Northern Scotland contribute 1% and 2% respectively to the
AAL and both contain 1% each of the TIV.
The ratio of Total Insured Value (TIV) and Annual Average Loss (AAL) was calculated by
region and shown in the table in Figure 5. This indicates the proportion of the TIV in each
region exposed to river flooding. The model indicates that regions such as Humber, Central
Scotland and Northern Ireland, have the highest proportions of their value exposed to flooding.
Cumbria and the Scottish Isles the lowest proportions.
The map in Figure 5 is shaded as a thematic bivariate map comparing TIV in shades of orange
and AAL in shades of blue. When these colours are combined it highlights areas of high
absolute value and high absolute loss in green, whilst areas of low absolute value and low
absolute loss are in white. Using this method highlights that whilst the Humber has a high
proportion of value at risk to flood, the low absolute insured value results in a low contribution
to AAL. Furthermore Yorkshire, the Central Midlands and the South East contribute a relatively
low proportion to the AAL despite a significant share of the TIV. Northern Ireland and the West
Midlands contribute a relatively high proportion to the AAL despite a low share of the TIV.
Figure 5: A bivariate thematic map indicating the relationship between high total insured value and high annual average
loss from river flooding in the UK by region.
The breakdown of the annual cost of river flooding between countries and by residential and
commercial exposures is detailed in Table 2.
Table 2: Current Annual Average Loss of River Flooding by Country and by exposure type
Average Annual Loss River Flooding Average Annual Loss River Flooding
Residential Commercial
England £224.3 m 80% £82.6 m 78%
Scotland £30.5 m 11% £10.3 m 10%
Wales £12.7 m 5% £3.9 m 4%
Northern Ireland £14.4 m 5% £9.1 m 9%
UK £282.0 m £105.8 m
Without the mitigating impact of flood defences, the cost of river flooding could increase from
the current £388 million to £956 million annually as shown in results from JBA’s UK Flood
model in the following section.
Modelling the impact of spending on defence maintenance on flood losses Page 12 of 21
CONFIDENTIAL © JBA Risk Management Limited 2021 www.jbarisk.com3.2 Average Annual Loss for four spending scenarios
The four spending scenarios were evaluated to estimate the impact on river flood losses. This
was carried out utilising JBA’s UK Flood Model with the addition of a new probabilistic defence
failure module. The spending scenarios included:
• Minimum spending
• Reduced spend - decrease current maintenance spending by 50%
• Maintain current maintenance spending – (current target condition grade 3)
• Increase current maintenance spending
The average annual loss for each of the spending scenarios is shown in Table 3 with little
difference (~1%) between scenarios. From research outlined in Section 1.2, it was found that
flood defence breach is infrequent in the UK which is reflected in the national level results
below. Calibration of JBA’s probabilistic defence failure module reflects this.
Table 3: Average Annual Loss per spending scenario
Spending Scenario Average Annual Loss £m
Minimum spend 389.3
Decrease spend 389.2
Current spend 389.1
Increase spend 389.1
Modelled losses suggest the inclusion of defended river areas or river flood defences reduces
the national average annual loss significantly, by approximately 59%. This highlights the
significance flood defences have in reducing losses to river flooding across the UK. In order
to maintain such a significant reduction it is important flood defences are maintained
to a reasonable condition.
Maintenance costs for four spending scenarios
4.1 Maintenance spending for four scenarios
Four maintenance spend scenarios were tested against the JBA river flood defence data to
assess the relative impact of maintenance spending on whole life costs between spending
scenarios. Whole life costs include both the maintenance of defences to keep assets fit for
purpose and at a target condition grade, and the periodic refurbishment or replacement of
assets when they deteriorate to the point of failure. Whole life costing requires a model of the
deterioration of assets (the time it takes to reach the point of failure), together with the costs
of maintaining and replacing the assets.
These spend figures are hypothetical and assume that current maintenance spending is
equivalent to target condition grade 3. Unit maintenance costs produced by the Environment
Agency were extracted from FCRM Asset Management Maintenance Standards version 3 and
were updated for inflation. Unit capital replacement costs were extracted from publicly
available documents with indicative unit rates8 and then calibrated to recent Environment
Agency capital spending.
• Asset deterioration rates use standard Environment Agency figures for walls and
embankments as described in the Environment Agency’s report “Assessment and
measurement of asset deterioration and whole life costing”.
• A capital replacement cost was assumed to occur when the defence degraded to
condition grade 4.
8 Cost estimation for fluvial defences – summary of evidence Report –SC080039/R2
Modelling the impact of spending on defence maintenance on flood losses Page 13 of 21
CONFIDENTIAL © JBA Risk Management Limited 2021 www.jbarisk.com• Total present value costs for the 30-year period were assessed using European
Insurance and Occupational Pension Authority (EIOPA) and HM Treasury Green
Book discount rates. They were converted back to an annual average cost estimate.
The current Environment Agency spend on maintenance, repair and restoration of assets is
in the region of £210 million to £230 million per annum. The latest EA budget for flood and
coastal erosion risk management released in March 2021 shows that funding will increase by
almost 25% for 2021-2022. Figure 6 plots the estimated capital and maintenance costs for
each of the tested spend scenarios.
Figure 6: Annual average upkeep costs.
The results show that as maintenance spending is increased, the capital spend requirement
decreases. This is a result of the life of the defences being extended when a higher level of
maintenance is provided. The total estimated annual capital and maintenance spend for each
scenario modelled is provided in Table 4. The variance in total costs from the current spend
scenario is also shown, indicating that the increased spend scenario could reduce total long-
term average costs by approximately £56m.
Table 4: Total estimated annual costs
Maintenance Capital Cost Relative difference to
Scenario Total Cost £m
Cost £m £m current spend £m
Minimum spend 2 443 445 +193
Decrease spend 14 316 330 +78
Current spend 27 255 252
Increase spend 42 154 196 -56
Table 5 provides a breakdown of the average increase and decrease in life expectancy of a
defence between the different maintenance spend scenarios (relative to the current
maintenance regime). Table 5 shows that if maintenance spending was halved then on
average defence lifespan would decrease by 12 years, while increasing maintenance
by 50% increases defence lifespan by an average of 8 years. Figure 6 shows that the
capital saving is much greater than the increased cost of maintenance and results in lower
overall spending.
Table 5: Average increase in defence life expectancy
Spending Scenario Extended years in life
Minimum spend -16
Decrease spend -12
Current spend 0
Increase spend 8
Modelling the impact of spending on defence maintenance on flood losses Page 14 of 21
CONFIDENTIAL © JBA Risk Management Limited 2021 www.jbarisk.com4.2 Capital replacement costs for four maintenance scenarios
The analysis clearly identifies that the impact of varying levels of maintenance is significant
on the frequency of asset replacement/capital spending. Increased spend on maintenance
can delay asset deterioration and minimise longer term capital replacement costs.
• The net benefit between the current spend and increased spending scenario is
estimated to be in the order of £87m per annum.
The study found that, over the analysis period, reducing the level of maintenance spending
to 50% of the baseline resulted in shortening the reliable lifespan of defences when compared
to the current maintenance regime. The cost impact of this is that:
• The total 30-year maintenance and capital spending came to £11.1bn, an increase
of £1.6bn on the £9.5bn baseline.
• For every £1 of reduced maintenance spend, there will be an increase of almost
£4.5 in capital costs annually.
The study found that, over the analysis period, increasing the level of maintenance
spending to 150% of the baseline resulted in the lengthening of the reliable lifespan of
defences so that capital expenditure is delayed. The cost impact of this is that:
• The total 30-year maintenance and capital spending of £6.5bn, a decrease of £2.9bn
on the £9.5bn baseline.
• For every £1m of extra maintenance spending, there will be an annual capital
cost saving of almost £7m.
Overall net benefits from maintenance
Annual Average Costs and Benefits
600 566 566 567 567
500 445
Millions £
400 330
282
300
195
200
100
0
Minimum spend Decrease spend Current spend Increase spend
Maintenance Scenario
AA Cost £m AA Benefit £m
Figure 7: Annual average costs and benefits.
Modelling the impact of spending on defence maintenance on flood losses Page 15 of 21
CONFIDENTIAL © JBA Risk Management Limited 2021 www.jbarisk.comAnnual Average Net Benefit
400 371
350
284
300
236
Millions £
250
200
150 121
100
50
0
Minimum spend Decrease spend Current spend Increase spend
Maintenance Scenario
AA Net Benefit £m
Figure 8: Annual average net benefit
Figure 7 shows the cost of maintaining the defences alongside the benefit derived from the
defence (the benefit being the flood damages avoided). The benefit is almost the same for
each scenario, showing the limited flood loss caused by breaching due to different
maintenance regimes. The net benefit is the difference between the cost of sustaining the
defences and the flood loss avoided. Figure 8 shows the net benefit for each scenario. This
shows that there is a positive net benefit for all scenarios, with the net benefit ranging from
£121m to £371m per annum.
As the benefit from the defences for each scenario is more or less the same – the difference
in net benefit between the scenarios is dependent upon the savings derived by the adopted
maintenance regime. As described earlier, an increase in maintenance spending results in an
extension of the life expectancy of a defence and thus reduces overall capital replacement
spending.
The net benefit using the HM Green Book method was also derived. The difference between
the two methods is down to the chosen discount and inflation rates. Discount rates are much
higher and the inflation rate is zero when using the Green Book method. This means that
future costs are represented differently. The annual average cost of defence upkeep and the
net benefit between the two methods are compared in the table below. The comparison shows
that the lower maintenance spending regimes are far more costly overall and result in a lower
or negative net benefit while the current and higher spend maintenance scenarios are cheaper
and result in a far greater net benefit. Table 6 presents the EIOPA costs and net benefits
depicted in Figure 7 and provides a direct comparison with the equivalent Green Book costs
and net benefits.
Table 6: Annual average cost and net benefit (£).
EIOPA Green Book EIOPA Green Book
Scenario
Cost £m Cost £m Net Benefit £m Net Benefit £m
Minimum spend 445 731 121 -164
Decrease spend 330 472 236 94
Current spend 282 252 284 315
Increase spend 195 142 371 425
Modelling the impact of spending on defence maintenance on flood losses Page 16 of 21
CONFIDENTIAL © JBA Risk Management Limited 2021 www.jbarisk.comConclusion
The study assesses the benefits of maintaining flood defences over a 30-year period,
exploring the correlation between flood defence maintenance and flood defence failure due to
breaching.
• The study found that defences are reasonably well maintained across the UK
with 92% of defences in a ‘fair or better’ condition.
• Four flood defence maintenance regimes were considered as part of this study to
determine the impact of flood defence failure. Each maintenance regime varied the
amount of spending.
• While flood events have been increasing in recent years, with many defences
overtopping, there is little evidence of flood events causing widespread defence
failure in the UK. A calibrated probabilistic flood defence failure module was
developed as part of this study reflecting the relatively low occurrence of flood
defence breach. This is reflected in the four spending regimes modelled, with ~1%
difference between each.
• Modelled river flood defences reduce average annual losses by approximately
59%, a saving of approximately £567.8m. This highlights the positive impact flood
defences have on reducing river flood losses across the UK. It also emphasises the
importance of maintaining these defences in order to reduce further the likelihood of
defence breach and to mitigate flood risk.
• Upon assessing the impact of maintenance on the long-term costs of flood defences,
results show that an increase in maintenance spending can extend the life of
defences, therefore reducing the overall capital spend requirement.
• If maintenance spending is reduced, the lifespan of defences decreases which in the
long-term causes an increase in overall costs.
Considering the cost of maintaining defences, the losses they can prevent and the overall net
benefit of defences as an annual average benefit, the study found that the highest
maintenance spend scenario, a 50% increase on current spending, resulted in the highest
long-term benefit of £371m.
Limitations
The following are the current known limitations within this study:
• Data availability and completeness: The Environment Agency and Natural
Resources Wales defence databases are incomplete in some areas and the
defended river areas are often only available where detailed hydraulic models have
been built. Data for Scotland and Northern Ireland are not published as Open Data
and are more limited in coverage. JBA has generated a more complete set of
defended areas which have been mapped onto the published flood defence datasets.
• Process: The analysis was carried out using JBA’s UK Flood Model 2018 with the
addition of updated 2019 river defended areas dataset as well as a newly developed
probabilistic (structural) defence failure module for river flood.
• Flood defence types: The study is suitable for the assessment of the annualised loss
of maintenance scenarios relating to two physical flood defences. The study has
been carried out exclusively on two types of raised defence: walls and
embankments. The study therefore does not include assessment of the impact of
spend on other types of flood mitigation measures, for example:
• Physical flood defence of other types:
• Flood barriers – for example the Thames Barrier and Foss Barrier
• Internal drainage boards, including the pumping systems required to be used
continually in order to ensure these areas remain dry
Modelling the impact of spending on defence maintenance on flood losses Page 17 of 21
CONFIDENTIAL © JBA Risk Management Limited 2021 www.jbarisk.com• Pumping stations for surface water
• Other mechanical and electrical systems
• Pumping of water in other areas
• Demountable defences
• Flood protection maintained by organisations other than the Environment Agency
• Flood storage schemes
• Property flood resilience measures
• Temporal reactive flood responses: the study does not take into account manmade
adjustments made to exposure during flooding. For example, the deployment of
sandbags, or use of property level protection measures
• Climate change: This analysis does not consider climate change
• Coastal: This analysis does not consider coastal flooding or defences
Modelling the impact of spending on defence maintenance on flood losses Page 18 of 21
CONFIDENTIAL © JBA Risk Management Limited 2021 www.jbarisk.comReferences Bye, P. and Homer, M. 1998. Easter floods 1998: report by the Independent Review Team to the Board of the Environment Agency. Bristol: Environment Agency. Environment Agency. 2001. Lessons learned: Autumn 2000 floods. Bristol: Environment Agency. Environment Agency. 2007. Review of summer 2007 floods. Bristol: Environment Agency. Environment Agency. 2009. Guidance on determining asset deterioration and the use of condition grade deterioration curves: Condition Assessment Manual (CAM). Bristol: Environment Agency. Environment Agency. 2009. Assessment and measurement of asset deterioration including whole life costing. Science report SC060078/SR2. [online] Available at: https://assets.publishing.service.gov.uk/government/uploads/system/uploads/attachment_da ta/file/291131/scho0509bqav-e-e.pdf [Accessed: 20 November 2020]. Environment Agency. 2015. Cost estimation for fluvial defences – summary of evidence Report –SC080039/R2. [online] Available at: https://assets.publishing.service.gov.uk /media/6034ed2ed3bf7f264f23eb51/Cost_estimation_for_fluvial_defences.pdf [Accessed 16 April 2021]. Environment Agency. 2016. The costs and impacts of the winter 2013 to 2014 floods. Report -SC140025/R1/ https://assets.publishing.service.gov.uk/government/uploads/system/uploads/attachment_da ta/file/501784/The_costs_and_impacts_of_the_winter_2013_to_2014_floods_-_report.pdf Accessed March 2021 Environment Agency. 2018. Estimating the economic costs f the 2015 to 2016 winter floods. [online] Available at: https://assets.publishing.service.gov.uk/government/uploads/system/uploads/attachment_da ta/file/672087/Estimating_the_economic_costs_of_the_winter_floods_2015_to_2016.pdf [Accessed March 2021] Environment Agency. 2020. Multi-billion pound investment as government unveils long-term plan to tackle flooding. https://www.gov.uk/government/news/multi-billion-pound-investment- as-government-unveils-new-long-term-plan-to-tackle-flooding Accessed March 2021 Environment Agency. 2021. Counting the cost of flooding. https://www.gov.uk/government/news/counting-the-costs-of-flooding Accessed March 2021 Environment Agency. 2020. Flood defence fragility curves permission granted for use within this project under a conditional licence. Gov.uk. 2021. Central Government Funding for Flood and Coastal Erosion Risk Management in England March 2021. [online] Available at: Funding for flood and coastal erosion risk management in England - GOV.UK (www.gov.uk) [Accessed 16 April 2021]. House of Commons. 2020. Briefing Paper: Autumn and winter floods, 2019-20. [online] Available at: https://commonslibrary.parliament.uk/research-briefings/cbp-8803/ [Accessed 20 November 2020]. ITV. 2015. Storm Frank: Lancashire village of Croston prepared for more heavy flooding. [online] Available at: https://www.itv.com/news/granada/2015-12-30/storm-frank-lancashire- village-of-croston-prepared-for-more-heavy-flooding [Accessed 20 November 2020]. JBA Trust. 2016. How well do flood defence models match reality? A Comparison of Actual Fluvial Embankment Flood Defence Performance to RASP Estimated Performance. [online] Available at: https://www.jbatrust.org/how-we-help/publications-resources/rivers-and- coasts/how-well-do-flood-defence-models-match-reality-a-comparison-of-actual-fluvial- embankment-flood-defence-performance-to-rasp-estimated-performance/ [Accessed 20 November 2020]. Met Office. 2020. State of the UK Climate 2019. Crown copyright, Met Office. International Journal of Climatology. John Wiley & Sons Ltd on behalf of the Royal Meteorological Society. Modelling the impact of spending on defence maintenance on flood losses Page 19 of 21 CONFIDENTIAL © JBA Risk Management Limited 2021 www.jbarisk.com
[online] Available at: https://rmets.onlinelibrary.wiley.com/doi/full/10.1002/joc.6726 [Accessed
March 2021].
Met      Office.   2020.     Record      breaking    rainfall  [online]   Available    at:
https://www.metoffice.gov.uk/about-us/press-office/news/weather-and-climate/2020/2020-
winter-february-stats [Accessed 15 April 2021].
Met Office. 2020. Rainfall on UK’s wettest day could have more than filled Loch Ness. [online]
Available at: https://blog.metoffice.gov.uk/2020/10/16/rainfall-on-uks-wettest-day-on-record-
could-have-more-than-filled-loch-ness/ [Accessed 16 April 2021].
National Audit Office. 2001. Inland Flood Defence - National Audit Office Report HC 299
Session 2000-2001: 15 March 2001. [online]. Available at: NAO Report (HC299 2000/01):
Inland Flood Defence (Full Report) [Accessed 16 April 2021].
National Audit Office. 2014. Strategic flood risk management – DEFRA and National Audit
Office - HC 780. [online]. Available at: Strategic flood risk management - National Audit Office
(NAO) Report [Accessed 16 April 2021].
Natural Environment Research Council. 1975. Flood Studies Report. London: Whitefriars
Press
NERC. 1983. FSSR 14, Review of Regional Growth curves, Flood Studies Supplementary
Report. Institute of Hydrology.
Simm, J., Flikweert, J.J., Hollingsworth, C. and Tarrant, O. 2017. Ten years of lessons learned
from English levee performance during severe flood events. Paper submitted to the 85th
Annual meeting of the International Commission on Large Dams. [online] Available at:
https://www.researchgate.net/publication/329390765_Ten_years_of_lessons_learned_from_
English_levee_performance_during_severe_flood_events [Accessed 20 November 2020].

Modelling the impact of spending on defence maintenance on flood losses             Page 20 of 21
CONFIDENTIAL © JBA Risk Management Limited 2021                               www.jbarisk.com
You can also read