The Psychological Impact of Hypertension During COVID-19 Restrictions: Retrospective Case-Control Study - XSL FO
←
→
Page content transcription
If your browser does not render page correctly, please read the page content below
JMIRx Med                                                                                                                                 Bonner et al

     Original Paper

     The Psychological Impact of Hypertension During COVID-19
     Restrictions: Retrospective Case-Control Study

     Carissa Bonner1, PhD; Erin Cvejic1, PhD; Julie Ayre1, PhD; Jennifer Isautier1; Christopher Semsarian2,3,4, PhD; Brooke
     Nickel1, PhD; Carys Batcup1; Kristen Pickles1, PhD; Rachael Dodd1, PhD; Samuel Cornell1; Tessa Copp1, PhD;
     Kirsten J McCaffery1, PhD
     1
      Sydney Health Literacy Lab, School of Public Health, Faculty of Medicine and Health, The University of Sydney, Sydney, Australia
     2
      Agnes Ginges Centre for Molecular Cardiology, Centenary Institute, The University of Sydney, Sydney, Australia
     3
      Faculty of Medicine and Health, The University of Sydney, Sydney, Australia
     4
      Department of Cardiology, Royal Prince Alfred Hospital, Sydney, Australia

     Corresponding Author:
     Carissa Bonner, PhD
     Sydney Health Literacy Lab, School of Public Health
     Faculty of Medicine and Health
     The University of Sydney
     Edward Ford Building A27, Rm 128A
     Sydney, NSW 2006
     Australia
     Phone: 61 2 9351 7125
     Email: carissa.bonner@sydney.edu.au

     Related Articles:
     Preprint: https://preprints.jmir.org/preprint/25610
     Peer-Review Report by Jorge Andrés Delgado-Ron (Reviewer G): https://med.jmirx.org/2021/1/e28714/
     Peer-Review Report by Dinesh Neupane (Reviewer AM): https://med.jmirx.org/2021/1/e28717/
     Authors' Response to Peer-Review Reports: https://med.jmirx.org/2021/1/e28718/

     Abstract
     Background: It is unclear how people with hypertension are responding to the COVID-19 pandemic given their increased risk,
     and whether targeted public health strategies are needed.
     Objective: This retrospective case-control study compared people with hypertension to matched healthy controls during the
     COVID-19 lockdown to determine whether they have higher risk perceptions, anxiety, and vaccination intentions.
     Methods: Baseline data from a national survey were collected in April 2020 during the COVID-19 lockdown in Australia.
     People who reported hypertension with no other chronic conditions were randomly matched to healthy controls of similar age,
     gender, education, and health literacy level. A subset including participants with hypertension was followed up at 2 months after
     restrictions were eased. Risk perceptions, anxiety, and vaccination intentions were measured in April and June.
     Results: Of the 4362 baseline participants, 466 (10.7%) reported hypertension with no other chronic conditions. A subset of
     1369 people were followed up at 2 months, which included 147 (10.7%) participants with hypertension. At baseline, perceived
     seriousness was high for both hypertension and control groups. The hypertension group reported greater anxiety compared to the
     controls and were more willing to vaccinate against influenza, but COVID-19 vaccination intentions were similar. At follow-up,
     these differences were no longer present in the longitudinal subsample. Perceived seriousness and anxiety had decreased, but
     vaccination intentions for both influenza and COVID-19 remained high across groups (>80%).
     Conclusions: Anxiety was above normal levels during the COVID-19 lockdown. It was higher in the hypertension group, which
     also had higher vaccination intentions. Groups that are more vulnerable to COVID-19 may require targeted mental health screening
     during periods of greater risk. Despite a decrease in perceived risk and anxiety after 2 months of lockdown restrictions, vaccination
     intentions remained high, which is encouraging for the future prevention of COVID-19.

     (JMIRx Med 2021;2(1):e25610) doi: 10.2196/25610

     https://xmed.jmir.org/2021/1/e25610                                                                         JMIRx Med 2021 | vol. 2 | iss. 1 | e25610 | p. 1
                                                                                                                      (page number not for citation purposes)
XSL• FO
RenderX
JMIRx Med Bonner et al
KEYWORDS
public health; global health; COVID-19; hypertension; risk; strategy; mental health; behavior; response; anxiety; vaccine;
retrospective; perception; prevention; intention
with multiple CVD risk factors associated with worse
Introduction COVID-19 outcomes (eg, hypertension and diabetes) [8]. Initial
Although research on COVID-19 outcomes is constantly concerns promoted in national media included both respiratory
evolving, there is consistent evidence that people with conditions, such as asthma [15], and cardiovascular conditions,
cardiovascular disease (CVD) risk factors are more likely to including hypertension [16], early in the Australian pandemic
experience severe complications and are more likely to die if response.
they acquire COVID-19 [1]. People with CVD are more likely As a result of this evolving and conflicting research, as well as
to have risk factors that may complicate the response to widespread misinformation, people with hypertension in the
COVID-19, and COVID-19 can itself cause cardiovascular community may have received mixed messages in the media
damage [2]. During the early phase of the pandemic, there was about how they should manage both CVD risk and COVID-19
prominent media attention about the risk of hypertension in risk during the pandemic. It is unknown whether people with
particular, and there were concerns that people with CVD risk hypertension responded differently to the pandemic and
factors were not presenting to general practitioners and hospitals associated restrictions compared to the general population and
for management and new symptoms onset due to the fear of whether a tailored communication approach is needed to address
contracting COVID-19 [3,4]. People with CVD risk factors or the needs of this group.
established CVD can access prescriptions via telehealth in
Australia, but this was very new at the time of the study [5]. As This study investigated whether people with hypertension have
well as potential access issues, many people with chronic higher risk perceptions, anxiety, and prevention intentions during
conditions do not believe they are at increased risk, which may COVID-19 restrictions to inform targeted public health
affect their uptake of prevention measures [6]. This may be messaging for this group.
reinforced by beliefs based on misinformation about the severity
of COVID-19, spread as part of antivaccination movements [7]. Methods
In addition to concern about increased risk for this population, Setting
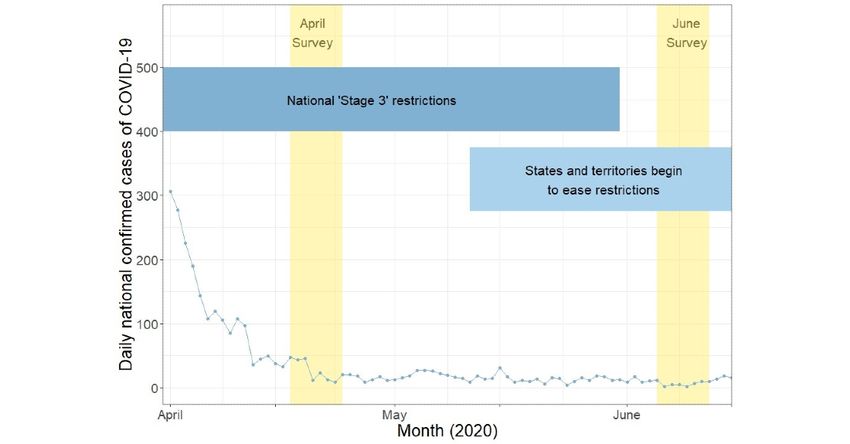
there has been debate in the medical community about whether In Australia, the COVID-19 pandemic has been well controlled
common medications used to manage risk for people with CVD, compared to many other countries around the world. However,
hypertension, and diabetes contribute to worse COVID-19 in April 2020, cases and community transmissions had been
outcomes [8,9]. At the time of this study, there was insufficient rising exponentially, and the country was placed under
evidence to cease their use, prompting the National Heart lockdown, including closure of schools and workplaces and
Foundation to release a statement confirming this [10]. However, restrictions on gatherings and movement. Citizens were required
there continues to be research on the role of angiotensin to stay home except for essential purposes (eg, work, essential
converting enzyme inhibitors and angiotensin II type I receptor shopping, exercise). In June 2020, cases were under control and
blockers, with arguments both for and against the continued use many regulations were eased, although some restrictions
of such medications [11,12] during the COVID-19 pandemic remained, such as small gathering sizes, which varied from state
in different population groups. to state. A second wave occurred in the state of Victoria shortly
There has also been debate about the respiratory versus after this, requiring new restrictions such as mandatory masks
cardiovascular nature of COVID-19. Emerging research suggests and curfews, but our data were collected prior to this. Thus, a
that virus complications and their treatment could be regarded comparison of April and June data presents an opportunity to
as cardiovascular in nature [13,14], which may explain the look at the effect of a short-term lockdown between a time of
devastating outcomes experienced by some people who contract strong COVID-19 restrictions and good control (Figure 1).
the virus. It is unclear what this means for managing people
https://xmed.jmir.org/2021/1/e25610 JMIRx Med 2021 | vol. 2 | iss. 1 | e25610 | p. 2
(page number not for citation purposes)
XSL• FO
RenderXJMIRx Med Bonner et al
Figure 1. COVID-19 in Australia during the study period.
distancing is important for my family’s health,” “social
Data Collection distancing is important for the health of others in my
Data from a national Australian survey were used to conduct community,” “when everyone else is socially distancing, I don’t
retrospective case-control analyses comparing hypertension and need to,” “I socially distance to protect people with a weaker
control groups. Baseline data were collected from all states and immune system”). Perceived seriousness was asked generally
territories in April 2020 during the COVID-19 lockdown, with at baseline; at follow-up, participants were asked about the
a subsample followed up in June 2020 when restrictions were public health risk from COVID-19 in general, globally, and in
eased. Australia specifically, given the divergent pattern of control
Ethics approval was obtained from the University of Sydney across countries.
Human Research Ethics Committee (2020/212). Matching Procedure
Measures Individuals with hypertension and no other comorbidities
The survey measures and full sample results are reported (n=466) were retrospectively matched without replacement to
elsewhere [17,18], including the Health Literacy single-item healthy controls (with no comorbidities; n=2251) using the
screener [19], Consumer Health Activation Index (CHAI) patient calipmatch function in Stata (StataCorp) [22]. For each case,
activation measure [20], and State-Trait Anxiety Inventory potential controls were initially identified based on age (±3
(STAI) [21]. Participants were asked if they had any of the years) and exactly matching on gender, education, and health
following conditions: asthma, chronic obstructive pulmonary literacy adequacy (selected given observed differences as a
disease, high blood pressure (hypertension), cancer, heart function of these variables in COVID-19–related knowledge,
disease, stroke, diabetes, depression, or anxiety; and whether attitudes, awareness, and behaviors in our baseline survey [17]).
they take any prescription medication (not specified). The One matching control is then randomly selected for the case
single-item screener provides a brief measure of health literacy, and removed from the list of available controls for subsequent
that is, the skills needed to engage in health [19]; and the CHAI cases. Because the search strategy for controls is greedy (ie,
provides a measure of patient activation, that is, the extent that selecting cases for matching in random order and removing
a person actively involves themselves in decisions to manage controls without replacement for subsequent case matching),
one’s health [20]. Risk perceptions and prevention behaviors some cases may be left unmatched. The initial matching run
(including vaccination intentions) were measured using Likert resulted in 95.7% (446/466) of cases successfully matched to
and categorical scales. Items pertaining to risk perception were a control. The constraints for matching were iteratively relaxed
based on items developed for an earlier US COVID-19 study (eg, allowing age to vary by ±10 years; education level to differ
[18]. The perceived seriousness of threat from COVID-19 was by one category) until all remaining cases were paired to a
captured using a 10-point scale (1=”no threat at all to” 10=”very control. The matching procedure was repeated for the follow-up
serious public health threat”). The social distancing score reflects sample.
perceived importance of social distancing. This outcome is Analysis
based on 4 items, each answered using a 7-point Likert scale.
Analyses were conducted using Stata/IC v16.1 (StataCorp).
The items were adapted from existing vaccine attitude
Pairwise comparisons of baseline demographic characteristics
instruments to instead reflect on social distancing (“social
were undertaken to confirm the appropriateness of the matching
https://xmed.jmir.org/2021/1/e25610 JMIRx Med 2021 | vol. 2 | iss. 1 | e25610 | p. 3
(page number not for citation purposes)
XSL• FO
RenderXJMIRx Med Bonner et al
procedure of cases to controls, and to identify potential Data Availability
differences in demographic characteristics between those who Data are available upon reasonable request subject to ethics
were invited and returned for follow-up compared to those who approval.
were not followed up. Regression models with robust error
variances to account for clustering within pairs, and adjusted Results
for matching variables (age, gender, education, and health
literacy adequacy), were used to analyze outcome variables. Of the 4362 baseline participants, 466 (10.7%) reported
Linear models were used for continuous outcomes (risk hypertension with no other chronic conditions. A subset of 1369
perceptions, STAI anxiety, perceived importance of social participants from the original survey cohort were followed up
distancing) to estimate marginal mean differences (MMD). after 2 months, comprising 147 (10.7%) participants with
Generalized linear models with a modified Poisson approach hypertension only.
[23] were used for the dichotomous outcome “not feeling
stressed due to COVID-19,” generating adjusted prevalence Table 1 describes the case versus control samples for all baseline
ratios (aPR). Ordinal logistic regression models were used for outcomes, and Table 2 shows details of the regression models
ordered categorical outcomes (frequency of leaving one’s home, comparing the two groups at this timepoint. Table 3 provides
vaccination intentions), resulting in adjusted odds ratios (aOR). a description of cases and controls included in the follow-up
Separate models were conducted for each time point. All sample, with Table 4 detailing the outcome of the regression
estimates are provided with 95% CI values. A P value of .05 models at follow-up.
was used as the threshold for statistical significance.
https://xmed.jmir.org/2021/1/e25610 JMIRx Med 2021 | vol. 2 | iss. 1 | e25610 | p. 4
(page number not for citation purposes)
XSL• FO
RenderXJMIRx Med Bonner et al
Table 1. Baseline descriptive statistics and unadjusted outcomes for hypertension cases versus matched healthy controls.
Variable Groupa
Hypertension (n=466) Control (n=466)
Sample description
Age (years), mean (SD) 53.5 (15.5) 52.5 (15.3)
Age group, n (%)
18-25 years 26 (6) 34 (7)
26-40 years 83 (18) 78 (17)
41-55 years 105 (23) 117 (25)
56-90 years 252 (54) 237 (51)
Gender, n (%)
Male 220 (47) 220 (47)
Female 243 (52) 243 (52)
Not specified/other 3 (1) 3 (1)
Education, n (%)
High school or less 115 (25) 112 (24)
Certificate I-IV 69 (15) 69 (15)
University 282 (61) 285 (61)
b 427 (92) 431 (92)
Adequate health literacy , n (%)
Takes any prescription medicine, n (%) 359 (77) 195 (42)
Consumer Health Activation Index (score 0-100 where 100 is more active), mean 75.83 (14.19) 77.17 (12.77)
(SD)
Risk perception
Seriousness of threat (0=low, 10=high), mean (SD) 7.72 (2.25) 7.66 (2.18)
What percentage of people who get COVID-19 will die as a result? (open), mean 6.50 (13.49) 5.72 (12.45)
(SD)
What percentage of people who get COVID-19 will experience only mild symptoms? 62.88 (26.36) 62.37 (27.12)
(open), mean (SD)
Anxiety
State-Trait Anxiety Inventory (score range 20-80; normal 34-36), mean (SD) 40.62 (14.95) 38.98 (14.38)
Never (in the past week) felt nervous or stressed because of COVID-19 (categorical), 113 (24) 115 (25)
n (%)
Prevention behaviors
Perceived importance of social distancing (average of 4 items from 1-7, where 7 is 6.48 (0.74) 6.42 (0.82)
most important), mean (SD)
How often are you leaving home? n (%)
Less than once per week 45 (10) 42 (9)
Once per week 53 (11) 53 (11)
A few times per week 176 (38) 150 (32)
Once per day 154 (33) 176 (38)
Multiple times per day 38 (8) 45 (10)
I have or I will get the flu vaccine this year, n (%)
Strongly disagree/disagree 50 (11) 72 (15)
Neither agree nor disagree 30 (6) 39 (8)
Strongly agree/agree 386 (83) 355 (76)
https://xmed.jmir.org/2021/1/e25610 JMIRx Med 2021 | vol. 2 | iss. 1 | e25610 | p. 5
(page number not for citation purposes)
XSL• FO
RenderXJMIRx Med Bonner et al
Variable Groupa
Hypertension (n=466) Control (n=466)
If a COVID-19 vaccine becomes available, I will get it, n (%)
Strongly disagree/disagree 17 (4) 29 (6)
Neither agree nor disagree 45 (10) 42 (9)
Strongly agree/agree 404 (87) 395 (85)
a
People reporting high blood pressure and no other conditions were matched to healthy controls with no reported cardiovascular or respiratory conditions.
b
Based on the single-item health literacy screener.
Table 2. Multivariablea regression model estimates comparing hypertension cases (n=466) versus matched healthy controls (n=466) at baseline.
Variable Estimate (95% CI) P value
Risk perception
Seriousness of threat, MMDb 0.05 (–0.23 to 0.34) .71
What percentage of people who get COVID-19 will die as a result? MMD 0.75 (–0.87 to 2.37) .36
What percentage of people who get COVID-19 will experience only mild symptoms? MMD 0.71 (–2.77 to 4.18) .69
Anxiety
State-Trait Anxiety Inventory, MMD 1.90 (0.19 to 3.61) .03
c 0.96 (0.77 to 1.19) .69
Never (in the past week) felt nervous or stressed because of COVID-19, aPR
Prevention behaviors
Perceived importance of social distancing, MMD 0.06 (–0.04 to 0.17) .21
How often are you leaving home? aORd 0.84 (0.66 to 1.06) .14
I have or I will get the flu vaccine this year, aOR 1.52 (1.10 to 2.11) .01
If a COVID-19 vaccine becomes available, I will get it, aOR 1.21 (0.84 to 1.73) .31
a
All multivariable models controlled for age (in years), gender, health literacy adequacy, and education.
b
MMD: marginal mean difference (from the linear regression model).
c
aPR: adjusted prevalence ratio (from the generalized linear model using a modified Poisson approach).
d
aOR: adjusted odds ratio (from the ordinal logistic regression).
https://xmed.jmir.org/2021/1/e25610 JMIRx Med 2021 | vol. 2 | iss. 1 | e25610 | p. 6
(page number not for citation purposes)
XSL• FO
RenderXJMIRx Med Bonner et al
Table 3. Follow-up descriptive statistics and unadjusted outcomes for hypertension cases versus matched healthy controls.
Variable Groupa
Hypertension (n=147) Control (n=147)
Sample descriptionb
Age (years), mean (SD) 54.8 (14.9) 52.8 (14.2)
Age group, n (%)
18-25 years 7 (5) 8 (5)
26-40 years 22 (15) 22 (15)
41-55 years 36 (24) 45 (31)
56-90 years 82 (56) 72 (49)
Gender, n (%)
Male 61 (41) 61 (41)
Female 85 (58) 85 (58)
Not specified/other 1 (1) 1 (1)
Education, n (%)
High school or less 26 (18) 18 (12)
Certificate I-IV 19 (13) 21 (14)
University 102 (69) 108 (73)
Adequate health literacyc, n (%) 142 (97) 143 (97)
Takes any prescription medicine, n (%) 114 (78) 56 (38)
Consumer Health Activation Index (score 0-100, where 100 is more active), mean 75.48 (14.32) 77.10 (12.95)
(SD)
Risk perception
Seriousness of threat in general (0=low to 10=high), mean (SD) 7.51 (2.42) 7.03 (2.58)
Seriousness of threat globally (0=low to 10=high), mean (SD) 8.74 (1.76) 8.65 (1.81)
Seriousness of threat in Australia (0=low to 10=high), mean (SD) 6.14 (2.38) 5.50 (2.49)
Anxiety
State-Trait Anxiety Inventory (score range 20-80; normal 34-36), mean (SD) 36.94 (15.31) 36.49 (13.93)
Never (in the past week) felt nervous or stressed because of COVID-19 (categorical), 58 (39) 64 (44)
n (%)
Prevention behaviors
Perceived importance of social distancing (average of 4 items from 1-7, where 7 is 6.49 (0.78) 6.34 (0.90)
more important), mean (SD)
I have or I will get the flu vaccine this year, n (%)
Strongly disagree/disagree 13 (9) 24 (16)
Neither agree nor disagree 2 (1) 2 (1)
Strongly agree/agree 132 (90) 121 (82)
If a COVID-19 vaccine becomes available, I will get it, n (%)
Strongly disagree/disagree 7 (5) 13 (9)
Neither agree nor disagree 9 (6) 10 (7)
Strongly agree/agree 131 (89) 124 (84)
a
People reporting high blood pressure and no other conditions were matched to healthy controls with no reported cardiovascular or respiratory conditions.
b
As measured at baseline.
c
Based on the single-item health literacy screener.
https://xmed.jmir.org/2021/1/e25610 JMIRx Med 2021 | vol. 2 | iss. 1 | e25610 | p. 7
(page number not for citation purposes)
XSL• FO
RenderXJMIRx Med Bonner et al
Table 4. Multivariablea regression model estimates comparing hypertension cases (n=147) versus matched healthy controls (n=147) at follow-up.
Variable Estimate (95% CI) P value
Risk perception
Seriousness of threat in general, MMDb 0.50 (–0.08 to 1.08) .09
Seriousness of threat globally, MMD 0.07 (–0.31 to 0.46) .71
Seriousness of threat in Australia, MMD 0.60 (0.05 to 1.15) .03
Anxiety
State-Trait Anxiety Inventory, MMD 0.94 (–2.57 to 4.45) .60
Never (in the past week) felt nervous or stressed because of COVID-19, aPRc 1.03 (0.94 to 1.12) .55
Prevention behaviors
Perceived importance of social distancing, MMD 0.16 (–0.03 to 0.35) .11
I have or I will get the flu vaccine this year, aORd 1.90 (0.93 to 3.90) .08
If a COVID-19 vaccine becomes available, I will get it, aOR 1.72 (0.82 to 3.58) .15
a
All multivariable models controlled for age (in years), gender, health literacy adequacy, and education.
b
MMD: marginal mean difference (from the linear regression model).
c
aPR: adjusted prevalence ratio (from the generalized linear model using a modified Poisson approach).
d
aOR: adjusted odds ratio (from the ordinal logistic regression).
Anxiety
Description of Sample
At baseline, 76% (n=353) of the hypertension group had felt
To isolate the effects of hypertension, the hypertension sample
nervous or stressed about COVID-19 in the past week at least
included 466 people reporting only high blood pressure and no
some of the time. On average, the mean STAI was 1.90 units
other chronic health conditions. The mean age was 54 years
higher (95% CI 0.19 to 3.61; P=.03, Cohen d=0.13) for those
(SD 15.5), and the sample comprised 52% (n=243) female, 47%
with hypertension (mean 40.75) than matched controls (mean
(n=220) male, and 1% (n=3) unspecified. The majority had a
38.85). At follow-up, there was no longer a significant difference
university degree (n=282, 61%) and adequate health literacy
between the hypertension (mean 37.02) and control (mean
(n=427, 92%). The average patient activation score was
36.08) groups (MMD 0.94, 95% CI –2.57 to 4.45; P=.60, Cohen
comparable to other patient populations (mean scaled CHAI
d=0.06).
74.9). Most were taking medications (n=359, 77%), with 45%
(n=163) obtaining a refill during the lockdown, 5% (n=19) Prevention Behaviors
switching to a longer prescription, and only 1 person stopping At baseline, the hypertension group had a social distancing score
their medication. As seen in Table 1, the sample descriptive of 6.48 out of 7, indicating strong agreement with the importance
characteristics were comparable between individuals with of social distancing for ones’ own health and the health of the
hypertension and the matched controls. There was no statistical public; this was similar to the controls (6.42 out of 7). Most
difference across age (P=.33), gender (P>.99), education people left home a few times a week (n=176, 38%) or once a
(P=.97), or health literacy adequacy (P=.63) between cases and day (n=154, 33%) during the lockdown. Overall, 83% (n=386)
controls. Cases who were invited and returned for follow-up agreed they would get the influenza vaccine, and 87% (n=404)
were of similar age and gender but had higher levels of would get the COVID-19 vaccine. Compared to healthy matched
education (P=.02) and were more likely to have adequate health controls, the hypertension group was more likely to agree that
literacy (P=.009) than those who were not followed up. they would (or have already) received the influenza vaccine this
Risk Perceptions year (aOR 1.52, 95% CI 1.10-2.11; P=.01). There were no
significant differences in willingness to vaccinate for COVID-19
At baseline, the perceived seriousness of threat from COVID-19
(if it became available), perceived importance of social
in the hypertension group was high (mean 7.72, out of 10) but
distancing, or frequency of leaving one’s home. At follow-up,
similar to controls (mean 7.66). On average, the hypertension
there was no longer a significant difference between the
sample believed that 7% of people who get COVID-19 would
hypertension and control groups for influenza vaccination
die as a result and 63% would experience only mild symptoms
intention (aOR 1.90, 95% CI 0.93-3.90; P=.08), with intentions
(asked separately). There were no statistically significant
remaining high for both influenza and COVID-19 vaccination
differences between the hypertension group and the matched
(>80% for both groups).
controls at baseline. At follow-up, those with hypertension
perceived a greater threat (mean 6.12) than controls (mean 5.52)
when asked about Australia (MMD 0.60, 95% CI 0.05-1.15;
P=.03) but not in general or globally.
https://xmed.jmir.org/2021/1/e25610 JMIRx Med 2021 | vol. 2 | iss. 1 | e25610 | p. 8
(page number not for citation purposes)
XSL• FO
RenderXJMIRx Med Bonner et al
Differences in medication use were found between groups, but
Discussion this was to be expected given that preventive medication is
Principal Findings recommended for hypertension. Surprisingly, there were no
differences in access difficulties or changes to medication. The
The main observation of this study was the significant difference Australian Bureau of Statistics reported in April 2020 that almost
in anxiety levels between hypertension only and matched control half (47%) of respondents with a chronic condition had used
groups, with all groups reporting higher than “normal” levels. telehealth [24], including electronic prescriptions; this was not
This is consistent with the Australian Bureau of Statistics’ a focus of our survey but may explain why little change was
finding that the rate of anxiety in the general population had detected.
doubled in April 2020 compared to a survey from 2017-18 [24].
Prioritizing mental health screening for more vulnerable clinical Strengths and Limitations
groups with higher anxiety may be warranted when local The strengths of this study include a large national sample with
community transmission rates are high. data during and after lockdown restrictions, which enabled
Overall, there were few differences between people with matched case-control analyses between participants with
hypertension and healthy matched controls. No significant self-reported hypertension and healthy controls and the use of
differences were found for COVID-19 risk perceptions or established, well-validated measures.
perceived importance of social distancing behaviors. This is The sample was recruited via an online research panel and social
consistent with another study, which found that 20% of people media, and has a low proportion of culturally and linguistically
with chronic conditions did not perceive greater risk [6], but diverse participants; hence, different results may be found in
differs from other survey reports that indicate people with other populations. We are currently conducting a separate survey
different chronic conditions are more likely to engage in of these communities in their preferred language. The survey
COVID-19 prevention behaviors and perceive COVID-19 as a involved nonstratified sampling without targeted recruitment
serious threat [18,25]. This may be due to a close resemblance of specific health conditions, and only a subset were included
between the hypertension and general populations in our study, in the longitudinal substudy. Future research could explore the
or it may be a result of our method of matching cases to controls influence of multimorbidity and differences between social
rather than comparing groups without such adjustment. Another media users and other community members, given
Australian survey found similarly high risk perceptions, so there misinformation concerns in Australia [30].
may also be a ceiling effect in Australia across community
groups [26]. Conclusion
Anxiety was above normal levels for all groups during the
Responses to flu vaccine uptake varied across the two groups,
COVID-19 lockdown. This was higher among people with
whereby those with hypertension were more likely to intend to
hypertension, who also had higher influenza vaccination
vaccinate compared to healthy controls. It is possible this is due
intentions but similar COVID-19 vaccination intentions. In
to the former’s greater exposure to the health system where
Australia, where lockdown measures effectively reduced the
doctors may mention the flu vaccine each year. This difference
spread of COVID-19 and restrictions eased relatively quickly,
does not appear to transfer to increased intent for COVID-19
these differences dissipated after 2 months, but locations with
vaccine uptake, but this may be due to a ceiling effect with high
prolonged restrictions may require targeted psychological
acceptance rates in Australia [27] compared to other countries
screening for vulnerable groups. Despite a decrease in perceived
such as France [28]. It should be noted that vaccine acceptance
seriousness and anxiety after 2 months of lockdown restrictions,
rates are changing over time as new information (and
vaccination intentions for both influenza and COVID-19
misinformation) becomes available about the various vaccines
remained high (80%), which is encouraging for the future
[29] now being used around the world. No COVID-19
prevention of COVID-19.
vaccinations were available to Australians at the time of the
study in 2020.
Acknowledgments
This study received no direct funding, but in-kind support was provided by authors with research fellowships. The SHeLL (Sydney
Health Literacy Lab) group thanks the participants of the longitudinal COVID-19 survey for their participation in this research.
CB is supported by a National Health and Medical Research Council (NHMRC)/Heart Foundation Early Career Fellowship
(1122788). CS is the recipient of a NHMRC Practitioner Fellowship (1154992). RD is supported by a University of Sydney
fellowship (197589). KM is supported by an NHMRC Principal Research Fellowship (1121110).
Conflicts of Interest
None declared.
References
https://xmed.jmir.org/2021/1/e25610 JMIRx Med 2021 | vol. 2 | iss. 1 | e25610 | p. 9
(page number not for citation purposes)
XSL• FO
RenderXJMIRx Med Bonner et al
1. Zaman S, MacIsaac AI, Jennings GL, Schlaich MP, Inglis SC, Arnold R, et al. Cardiovascular disease and COVID-19:
Australian and New Zealand consensus statement. Med J Aust 2020 Aug 31;213(4):182-187. [doi: 10.5694/mja2.50714]
[Medline: 32734645]
2. Li G, Hu R, Gu X. A close-up on COVID-19 and cardiovascular diseases. Nutr Metab Cardiovasc Dis 2020 Jun
25;30(7):1057-1060 [FREE Full text] [doi: 10.1016/j.numecd.2020.04.001] [Medline: 32423664]
3. Thornton J. Covid-19: A&E visits in England fall by 25% in week after lockdown. BMJ 2020 Apr 06;369:m1401. [doi:
10.1136/bmj.m1401] [Medline: 32253175]
4. Kippen R, O'Sullivan B, Hickson H, Leach M, Wallace G. A national survey of COVID-19 challenges, responses and
effects in Australian general practice. Aust J Gen Pract 2020 Nov 01;49(11):745-751. [doi: 10.31128/ajgp-06-20-5465]
5. Ministers | Department of Health. COVID-19: Whole of population telehealth for patients, general practice, primary care
and other medical services. Commonwealth of Australia. 2020 Mar 29. URL: https://tinyurl.com/tzh8u29s [accessed
2021-02-16]
6. Tran V, Ravaud P. COVID-19-related perceptions, context and attitudes of adults with chronic conditions: Results from a
cross-sectional survey nested in the ComPaRe e-cohort. PLoS One 2020 Aug 6;15(8):e0237296 [FREE Full text] [doi:
10.1371/journal.pone.0237296] [Medline: 32760127]
7. Vrdelja M, Kraigher A, Vercic D, Kropivnik S. The growing vaccine hesitancy: exploring the influence of the internet. Eur
J Public Health 2018 Oct 01;28(5):934-939. [doi: 10.1093/eurpub/cky114] [Medline: 29982349]
8. Fang L, Karakiulakis G, Roth M. Are patients with hypertension and diabetes mellitus at increased risk for COVID-19
infection? The Lancet Respiratory Medicine 2020 Apr;8(4):e21. [doi: 10.1016/s2213-2600(20)30116-8]
9. Singh AK, Gupta R, Misra A. Comorbidities in COVID-19: Outcomes in hypertensive cohort and controversies with renin
angiotensin system blockers. Diabetes Metab Syndr 2020 Jul;14(4):283-287 [FREE Full text] [doi: 10.1016/j.dsx.2020.03.016]
[Medline: 32283499]
10. Jennings G. Coronavirus disease 2019 (COVID-19): angiotensin-converting enzyme inhibitors, angiotensin II receptor
blockers and cardiovascular disease. Med J Aust 2020 Jun;212(11):502-503.e1 [FREE Full text] [doi: 10.5694/mja2.50622]
[Medline: 32441063]
11. Hippisley-Cox J, Tan PS, Coupland C. Risk of severe COVID-19 disease with ACE inhibitors and angiotensin receptor
blockers: cohort study including 8.3 million people. Heart 2020 Nov 05;107(2):170.2-17171. [doi:
10.1136/heartjnl-2020-318312] [Medline: 33153994]
12. Ruocco G, Feola M, Palazzuoli A. Hypertension prevalence in human coronavirus disease: the role of ACE system in
infection spread and severity. Int J Infect Dis 2020 Jun;95:373-375 [FREE Full text] [doi: 10.1016/j.ijid.2020.04.058]
[Medline: 32335337]
13. Mendes N, Jara C, Mansour E, Araujo E, Velloso L. Asthma and COVID-19 - A systematic review. Authorea 2020:1-3
[FREE Full text] [doi: 10.22541/au.159118771.11841404]
14. Carli G, Cecchi L, Stebbing J, Parronchi P, Farsi A. Is asthma protective against COVID-19? Allergy 2021 Mar
17;76(3):866-868 [FREE Full text] [doi: 10.1111/all.14426] [Medline: 32479648]
15. Weule G. I have asthma. Am I more at risk of having a severe coronavirus infection? ABC News. 2020 Apr 6. URL: https:/
/www.abc.net.au/news/health/2020-04-07/asthma-and-risk-of-severe-coronavirus-infection/12117680 [accessed 2021-02-26]
16. Hanrahan C. Coronavirus poses higher risk for those with diabetes and heart disease — not just older Australians. ABC
News. 2020 Apr 5. URL: https://www.abc.net.au/news/2020-04-06/coronavirus-risk-diabetes-heart-disease-covid19/
12113264 [accessed 2021-02-26]
17. McCaffery K, Dodd R, Cvejic E, Ayrek J, Batcup C, Isautier JM, et al. Health literacy and disparities in COVID-19-related
knowledge, attitudes, beliefs and behaviours in Australia. Public Health Res Pract 2020 Dec 09;30(4) [FREE Full text]
[doi: 10.17061/phrp30342012] [Medline: 33294907]
18. Wolf MS, Serper M, Opsasnick L, O'Conor RM, Curtis LM, Benavente JY, et al. Awareness, Attitudes, and Actions Related
to COVID-19 Among Adults With Chronic Conditions at the Onset of the U.S. Outbreak. Annals of Internal Medicine
2020 Jul 21;173(2):100-109. [doi: 10.7326/m20-1239]
19. Wallace LS, Rogers ES, Roskos SE, Holiday DB, Weiss BD. Brief report: screening items to identify patients with limited
health literacy skills. J Gen Intern Med 2006 Aug;21(8):874-877 [FREE Full text] [doi: 10.1111/j.1525-1497.2006.00532.x]
[Medline: 16881950]
20. Wolf MS, Smith SG, Pandit AU, Condon DM, Curtis LM, Griffith J, et al. Development and Validation of the Consumer
Health Activation Index. Med Decis Making 2018 Feb 13;38(3):334-343. [doi: 10.1177/0272989x17753392]
21. Marteau TM, Bekker H. The development of a six-item short-form of the state scale of the Spielberger State-Trait Anxiety
Inventory (STAI). Br J Clin Psychol 1992 Sep 12;31(3):301-306. [doi: 10.1111/j.2044-8260.1992.tb00997.x] [Medline:
1393159]
22. Stepner M, Garland A. CALIPMATCH: Stata module for caliper matching without replacement. EconPapers. 2017 May
11. URL: https://econpapers.repec.org/RePEc:boc:bocode:s458342 [accessed 2021-02-16]
23. Zou G. A modified poisson regression approach to prospective studies with binary data. Am J Epidemiol 2004 Apr
01;159(7):702-706. [doi: 10.1093/aje/kwh090] [Medline: 15033648]
https://xmed.jmir.org/2021/1/e25610 JMIRx Med 2021 | vol. 2 | iss. 1 | e25610 | p. 10
(page number not for citation purposes)
XSL• FO
RenderXJMIRx Med Bonner et al
24. Household Impacts of COVID-19 Survey. Australian Bureau of Statistics. 2020 May 1. URL: https://www.abs.gov.au/
statistics/people/people-and-communities/household-impacts-covid-19-survey/14-17-apr-2020 [accessed 2021-02-26]
25. Seale H, Heywood AE, Leask J, Sheel M, Durrheim DN, Bolsewicz K, et al. Examining Australian public perceptions and
behaviors towards a future COVID-19 vaccine. BMC Infect Dis 2021 Jan 28;21(1):120 [FREE Full text] [doi:
10.1186/s12879-021-05833-1] [Medline: 33509104]
26. Faasse K, Newby J. Public Perceptions of COVID-19 in Australia: Perceived Risk, Knowledge, Health-Protective Behaviors,
and Vaccine Intentions. Front Psychol 2020 Sep 30;11:551004 [FREE Full text] [doi: 10.3389/fpsyg.2020.551004] [Medline:
33117223]
27. Dodd RH, Cvejic E, Bonner C, Pickles K, McCaffery KJ, Ayre J, et al. Willingness to vaccinate against COVID-19 in
Australia. The Lancet Infectious Diseases 2021 Mar;21(3):318-319. [doi: 10.1016/s1473-3099(20)30559-4]
28. Peretti-Watel P, Seror V, Cortaredona S, Launay O, Raude J, Verger P, et al. A future vaccination campaign against
COVID-19 at risk of vaccine hesitancy and politicisation. The Lancet Infectious Diseases 2020 Jul;20(7):769-770 [FREE
Full text] [doi: 10.1016/S1473-3099(20)30426-6] [Medline: 32445713]
29. Rhodes A, Hoq M, Measey M, Danchin M. Intention to vaccinate against COVID-19 in Australia. The Lancet Infectious
Diseases 2020 Sep. [doi: 10.1016/s1473-3099(20)30724-6]
30. McInerney M. Facebook action creates public health emergency in Australia. Croakey. 2021 Feb 18. URL: https://www.
croakey.org/facebook-action-creates-public-health-emergency-in-australia/ [accessed 2021-02-26]
Abbreviations
aOR: adjusted odds ratio
aPR: adjusted prevalence ratio
CHAI: Consumer Health Activation Index
CVD: cardiovascular disease
MMD: marginal mean difference
STAI: State-Trait Anxiety Inventory
Edited by E Meinert; submitted 14.12.20; peer-reviewed by J Delgado-Ron, D Neupane; comments to author 14.01.21; revised version
received 02.03.21; accepted 08.03.21; published 30.03.21
Please cite as:
Bonner C, Cvejic E, Ayre J, Isautier J, Semsarian C, Nickel B, Batcup C, Pickles K, Dodd R, Cornell S, Copp T, McCaffery KJ
The Psychological Impact of Hypertension During COVID-19 Restrictions: Retrospective Case-Control Study
JMIRx Med 2021;2(1):e25610
URL: https://xmed.jmir.org/2021/1/e25610
doi: 10.2196/25610
PMID: 34076628
©Carissa Bonner, Erin Cvejic, Julie Ayre, Jennifer Isautier, Christopher Semsarian, Brooke Nickel, Carys Batcup, Kristen Pickles,
Rachael Dodd, Samuel Cornell, Tessa Copp, Kirsten J McCaffery. Originally published in JMIRx Med (https://med.jmirx.org),
30.03.2021. This is an open-access article distributed under the terms of the Creative Commons Attribution License
(https://creativecommons.org/licenses/by/4.0/), which permits unrestricted use, distribution, and reproduction in any medium,
provided the original work, first published in the JMIRx Med, is properly cited. The complete bibliographic information, a link
to the original publication on http://med.jmirx.org/, as well as this copyright and license information must be included.
https://xmed.jmir.org/2021/1/e25610 JMIRx Med 2021 | vol. 2 | iss. 1 | e25610 | p. 11
(page number not for citation purposes)
XSL• FO
RenderXYou can also read