Health Benefits of Walking and Cycling Webinar - 29th January 2019 - Get ...
←
→
Page content transcription
If your browser does not render page correctly, please read the page content below
Health Benefits of
Walking and Cycling
Webinar
29th January 2019
Agenda
13:00       Introduction                                                   Dr Mike Brannan, PHE
13.05       National ambition on cycling and walking - The Cycling and     Guy Boulby, DfT
            Walking Investment Strategy (CWIS)

13:15       Rapid review of health benefits of cycling and walking - Key   Dr Paul Kelly, University of
            findings and implications for implementation                   Edinburgh

                                                                           Dr James Woodcock,
                                                                           University of Cambridge

13:40       Questions and Answers                                          All
13:55       Next steps                                                     Dr Mike Brannan, PHE

2       Presentation title - edit in Header and Footer
Introduction
Dr Mike Brannan
National Lead for Physical Activity

Many people are not healthy enough for good health
(i.e. meeting CMOs’ guidelines)

    34% of men are not active                                   42% of woman are not active
     enough for good health                                       enough for good health

              21%
             25%
4   Presentation title - edit in Header and Footer          49% of disabled adults are inactive
                                                          compared to 15% of non-disabled adults
4   Health Survey for England 2016; Health Survey for England 2012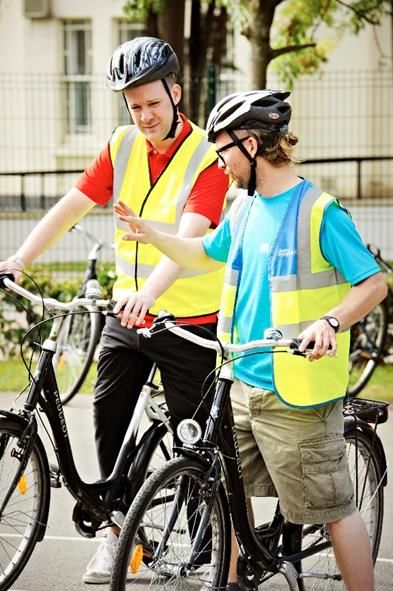
Inactivity is killing us
Decreasing activity levels since 1960s:
     o Adults are over 20% less active
     o By 2030 we will 35% less active

Physical inactivity is responsible for:
     o 1 in 6 UK deaths
     o Up to 40% of many long-term conditions
     o Around 30% of later life functional limitation
       and falls

Estimated £7.4 billion annual cost (incl. £0.9bn
to NHS)
                                                                                Image © Shutterstock

      Ng SW, Popkin B (2012); Lee I-M, et al. (2012); Wen CP, Wu X (2012); WHO (2010); Ossa D & Hutton J (2002);
5
      Murray et al. (2013)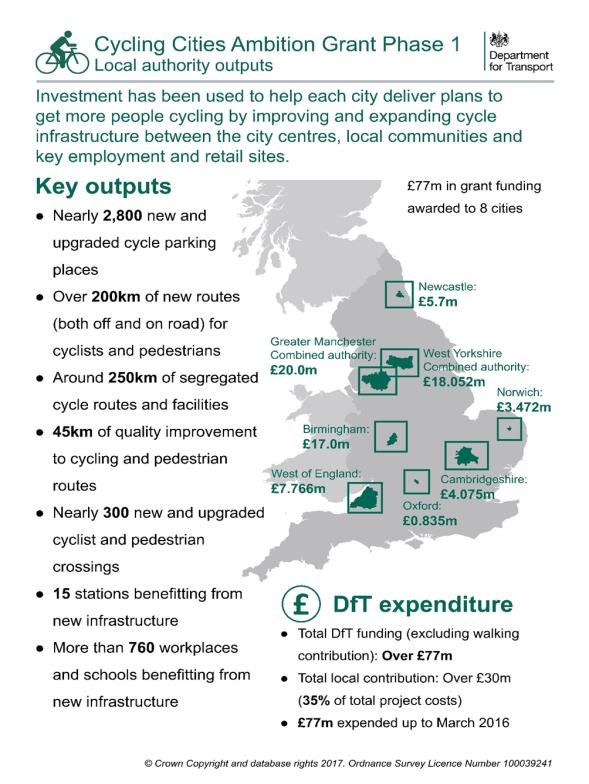
Prioritising cycling & walking
One of seven “best investments” to increase
population level physical activity

Prioritised for increasing physical activity & health
    •   UK CMOs’ guidance
    •   National Sport Strategy
    •   National physical activity framework
    •   WHO Global Action Plan

Key intervention in Richmond Group of Charities’
PROMISE study to achieve WHO ‘25 by 25’ goal
6
Background to Evidence Review
Cycling and Walking Investment Strategy sets first
national ambitions on cycling and walking

PHE asked by Public Heath and Cycling and Walking
Ministers to encourage local NHS engagement on
cycling and walking infrastructure

Evidence review commissioned to summarise modal
specific benefits of cycling & walking for individuals,
communities and health and care system benefits

 7
The Cycling and Walking
Investment Strategy (CWIS)

Summary for PHE Cycling and Walking
Webinar (29 Jan)

Guy Boulby
Head of Cycling and Walking

                              To make cycling and walking the natural choices for shorter journeys, or as part of a
                                                               longer journey                                         February 27, 2019
                                                                                                                                          8
Cycling and walking contribute to a wide range of Government priorities
                                                               Health
The majority of journeys include at least                      Obesity costs the NHS £6.1 billion per year with costs to society overall estimated at £27 billion per
some element of walking or cycling, either                     year. Related, indirect costs of physical inactivity are calculated at £8.2bn per year. People who
                                                               regularly cycled to work significantly decreased their risks of heart disease, cancer and depression. We
as the main mode of transport for short                        work closely with DH and Public Health England, as well as with DCMS and Sport England.
journeys, or as a connecting part of a longer
journey.                                                       Air Quality
                                                               Around 23,500 deaths a year are associated with poor air quality. Local authorities can bid for funding
Cycling and walking are important elements                     for cycling and walking schemes via a £230m Clean Air Fund, announced in the Autumn Budget 2017.
                                                               We work closely with DEFRA on this.
of an effective, integrated transport system
which connects people with employment,                         Urban Congestion
education and opportunities.                                   Congestion costs UK households over £30 billion every year. By 2040 traffic on England’s roads is
                                                               forecast to increase by between 19% and 55%. Two out of three car trips are under five miles - an
                                                               achievable distance to cycle for most people, and many more trips are shorter, making them walkable.
Benefits from local cycling and walking                        Highways England has a Cycling Delivery Plan and designated funding to improve the network for
investment are significant and well                            cyclists.
documented: cycling and walking projects
tend to have high benefit to cost ratios.                      Housing and the Economy
                                                               The location and design of new housing is important. We work closely with MHCLG colleagues to
                                                               ensure that it is planned and designed in such a way as to be as accessible as possible to cyclists.
It is estimated that British cyclists contribute
£5.4bn per annum to the economy and                            Cycle-proofing
support 64,000 jobs.                                           We work with colleagues in other parts of DfT to ensure their policies are “cycle-proofed”. The HS2
                                                               programme, for example, has made funding available for a range of environmental and safety projects,
                                                               including cycling schemes.

                                       To make cycling and walking the natural choices for shorter journeys, or as part of a
                                                                        longer journey                                                                                     9
                                                                                                                                                                February 27, 2019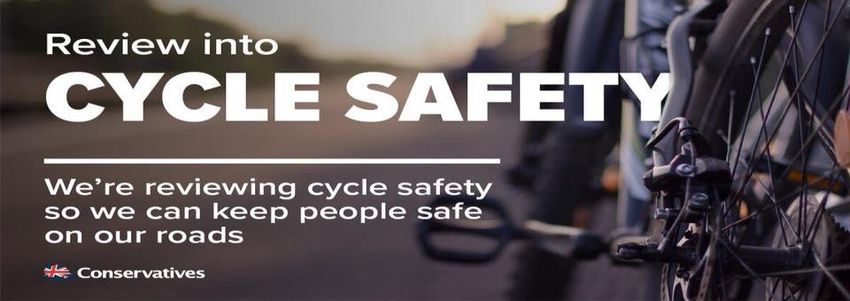
We have a statutory Cycling and Walking Investment
                         Strategy.
The first statutory Cycling and Walking Investment
Strategy was published in April 2017.                                                  Objectives (by 2020)
                                                                                                  Increase cycling activity
             The ambition for England by 2040                                                     Where cycling activity is measured as the total number of cycle stages
                                                                                                  made in England.
   To make cycling and walking the natural choices for shorter
            journeys, or as part of a longer journey                                              Increase walking activity
                                                                                                  Where walking activity is measured as the total number of walking
                                                                                                  stages per person.
      Better                      Better                       Better                             Reduce the rate of cyclists killed or seriously injured on
      Safety                     Mobility                      Streets                            England’s roads
                                                                                                  Measured as the number of fatalities and serious injuries per billion
                                                                                                  miles cycled.
   A safe and reliable        More people cycling          Places that have                       Increase the percentage of children aged 5 to 10 that usually walk
    way to travel for         and walking - easy,        cycling and walking at                   to school
     short journeys          normal and enjoyable              their heart.             Aims and Targets (by 2025)
                                                                                                 We aim to double cycling
   Ambition              Objectives         Indicators          Governance                       From 0.8 billion cycling stages in 2013 to 1.6 billion stages in 2025.

                                                                                                 We aim to increase walking activity
                                                                                                 To 300 walking stages per person per year in 2025.

                                                                                                 We will increase the percentage of children aged 5 to 10 that
       Action Plan                               Financial Resources                             usually walk to school
                                                                                                 From 49% of children in 2014 to 55% in 2025.

                                        To make cycling and walking the natural choices for shorter journeys, or as part of a
                                                                         longer journey                                                                                     10
                                                                                                                                                                    February 27, 2019
There are well-established barriers to cycling, particularly safety.
Per mile travelled, a cyclist was no more likely to be killed than a pedestrian, however, safety fears are the main reasons given for
not cycling. The number of cyclists killed or seriously injured has been following a downward trend since the 1980s although it
has increased slightly in the last few years as cycling distances increase.
Despite the relative safety of cycling,
Safety fears are the main deterrent to cycling However, more people want to and
there is a negative public perception
but people cite many other reasons. would cycle if these were addressed
of safety.
Fear of being involved in a collision 55
49
Not confident in cycling 32
29
Poor road conditions 26
22
I don't think I'm fit enough/ think I'm too… 22
20
Too far to cycle to work 17
16
Poor infrastructure for cycling in London 15
14
Lack of time 12
10
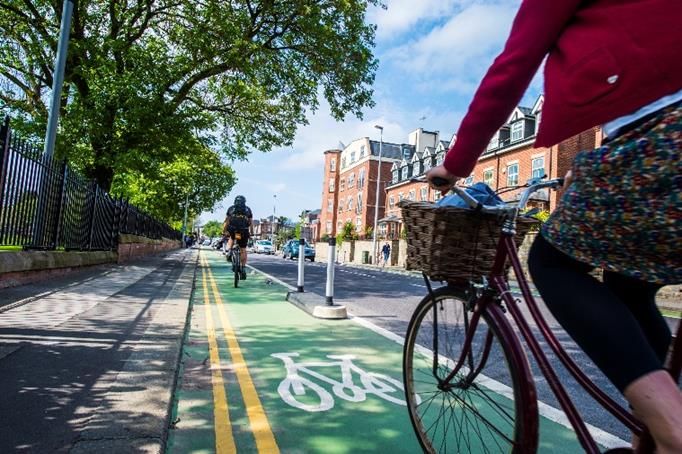
There is strong evidence that protection from general traffic is key to improving safety and getting more people onto bikes. In
particular, with the harder to reach groups, such as women and families.
To make cycling and walking the natural choices for shorter journeys, or as part of a
longer journey 11
February 27, 2019Action on safety: Government response to the CWIS Safety Review
published in October 2018
Key actions in the response are:
Review the existing guidance in the Highway Code to
improve safety for cyclists and pedestrians
Invest £100,000 to support police enforcement by developing
a national back office function to handle dash-cam footage
Improve enforcement against parking in cycle lanes
Appoint a cycle and walking champion
Encourage local authorities to increase investment in cycling
and walking infrastructure to 15 per cent of total transport
infrastructure spending
Engage with cycling and walking bodies to develop a
behaviour change campaign
No change in the Government’s position on helmets and high
visibility clothing but we will review evidence and international
experience on mandatory helmets for children and provide
strengthened advice on the fitting of cycle helmets
To make cycling and walking the natural choices for shorter journeys, or as part of a
longer journey 12
February 27, 2019The Strategy identified £1.2bn of funding for cycling and walking
In total £1.2bn has been identified Funding source Amount Period
which may be invested in cycling and Bikeability £50m 2016/17- 2019/20
walking, between 2016/17 – 2020/21.
In addition to the £1.2bn some
The five main sources of funding for cycling Cycle City Ambition £101m 2016/17- 2017/18
further funding has been
and walking are: announced, of which a significant
Highway England £85m 2016/17- 2020/21
DfT cycling and walking specific part is likely to be spent on cycling
programmes Access Fund £80m 2016/17- 2019/20 and walking, including:
• An expanded £2.4bn Transforming
DfT local transport programmes
Local Growth Fund £476m 2016/17- 2020/21 Cities Fund
Other government programmes • An expanded £5.5bn Housing
Local authority programmes Integrated Transport £194m 2016/17- 2020/21 Infrastructure Fund
Block
Initiatives led by business and the third • A new £675 million Future High
sector Highways £196m 2016/17- 2020/21 Streets Fund
Maintenance Fund
• A new £230m Clean Air Fund for
Decisions on the allocation of these local authorities with the worst air
funds are generally made by the The £1.2bn does not include: TfL and dedicated pollution problems
relevant local body. health and sporting initiatives that include active • A £4m top-up for the cycle rail grant
travel programme
Spending in England has doubled from £3.50 per head to almost £7 per head over the current Spending Review
period, where almost £2bn has now been allocated to cycling and walking projects
To make cycling and walking the natural choices for shorter journeys, or as part of a
longer journey 13
February 27, 2019We are supporting high quality infrastructure in cities and towns. Some
examples:
The Cycle City Ambition grant Cycle Rail is delivering new and improved
cycle facilities to make it more convenient to
programme provides support
cycle to the station through provision of
for eight Cycling Ambition new, high quality cycle parking and access
Cities.
Bristol £5m committed in
Manchester
2017/18 and £4m in
Newcastle Birmingham 2018/19 for next
Norwich Cambridge phase of delivery.
Oxford Leeds £1m for a first
phase of the Station
Investment has been used to help Community Links
each city deliver high quality Programme
infrastructure.
This forms part of a 10 year ambition Trebled the number of cycle parking spaces at stations
to significantly increase levels of since 2010 to over 75,000.
cycling
Journeys to the station by bike have increased by
Phase 1 of the programme nearly 40%.
completed in 2016 (£77m).
Phase 2 currently being delivered In total £36m funding since 2012
Attracted funding contributions from train operating
with funding transferred by March companies, local authorities and private developers
2018 (£114m). Managed by the Cycle Rail Working Group (CRWG).
To make cycling and walking the natural choices for shorter journeys, or as part of a
longer journey 14
February 27, 2019We are providing safe training for children and behaviour
change support for workplaces and communities
Bikeability is helping to kick start Access Funding is helping to promote increased
young people into a lifetime’s habit levels of physical activity through walking and
of cycling cycling
Funding is currently committed until end March Funding is currently committed until end March 2020
2020 A three year revenue programme supporting 25 Transport Authorities across
Training is provided to 300,000 school children England
per year and costs £12m per year. The Access Fund money will deliver:
safety training for cyclists Workplace support
of parents feel that their child’s confidence for cycling on- extra secure cycle storage Schools support
86% road is higher after their training road safety measures
of children feel more confident about riding their bike more Cycle and Walking to Work
82% often after Bikeability training Funding is supporting access
to new and existing
employment, education and
training by active modes
One year pilot
2.5 million
Children trained to date
Funding has recently been extended to 2019
Supporting 3 Combined Authorities
Focused on directly connecting jobseekers
with employment and apprenticeships
through affordable transport
To make cycling and walking the natural choices for shorter journeys, or as part of a
longer journey 15
February 27, 2019We are helping local authorities to deliver cycling and walking plans and
improving design guidance
The ambitions in the Cycling and Walking Investment Strategy will be delivered only by bringing people together
in local places, including local government, businesses, charities, and the public.
Developing long-term plans to improve cycling and walking A Local Cycling and Walking Infrastructure Plan
conditions at the local level will be critical to delivering the strategy. (LCWIP) is a long-term approach to developing
comprehensive local cycling and walking networks,
Local Cycling and Walking Infrastructure Plans (LCWIPs) help ideally over a 10 year period.
local authorities to take a more strategic approach by:
Identifying cycling and walking infrastructure improvements for
future investment in the short, medium and long term
Ensuring consideration is given to cycling and walking within
local planning and transport policies and strategies
Making the case for future funding for walking and cycling
infrastructure
To help local authorities, we published guidance in April 2017 on
the preparation of their LCWIPs, and we are also providing £1.5m
of support to local authorities to help them prepare their plans.
To make cycling and walking the natural choices for shorter journeys, or as part of a
longer journey 16
February 27, 2019Making it happen – Greater Manchester
In June 2018 the Mayor of Manchester
announced that £160m of their
Transforming Cities Fund allocation
(£250m) would go towards the Beelines
programme to support cycling and walking.
Represents the first step in the planned
£1.5 billion,10 year investment
Plan to create a city-region-wide cycling
Greater Manchester’s aim is
and walking network made up of more than to make cycling and walking
1,000 miles of routes, including 75 miles of a mainstream, every day
Dutch-style segregated bike lanes. and aspirational form of
transport
1,400 safer road crossings on the majority
of routes and 25 ‘filtered neighbourhoods’,
where priority will be given to the
movement of people and where more
public spaces to sit
Programme aiming to increase cycling and
walking to schools and workplaces. 75% of
people want to see more money invested
in cycling. To make cycling and walking the natural choices for shorter journeys, or as part of a
longer journey 17
February 27, 2019What impact are we having? Since 2006, walking has shown no real
change despite yearly fluctuations…
The proportion of children walking to school in England is
decreasing.
62% of adults walk for at least ten minutes three times a week.
Total number of walking stages per person (adult) per year 2002-2017
400
350 Stages 5% since 2002
343
328 stages
300 stages
250
Distance no change since 2002
Households in the lowest income quintile walk the
200
206 Walking is the main
206 furthest and make the most walking trips.
miles miles mode of transport to
150 school for all ages,
2002 2005 2008 2011 2014 2017
though it decreases for
secondary school
Under 16s make pupils.
the most walking The proportion of
trips. children walking to
school decreased by 7
Women walk more percentage points
trips than men. between 1995/97 and
2015.
To make cycling and walking the natural choices for shorter journeys, or as part of a
longer journey 18
February 27, 2019The percentage of cycling trips in England has remained constant at
around 2%, but the distance travelled has been increasing.
3% of school aged children usually cycled to school in
2017.
There have been big increases in cycling in areas that
have invested in good quality cycling provision (e.g.
London).
Only 35% of adults said they cycle at least once a year.
At the local authority level there is much greater variation; the proportion of adults
Estimated total number of cycle stages made per year - 2002-2017 who cycle at least once per week ranges from 3% to 52%.
Range of local authorities (9% is % of adults who cycle at least once
England average) per week
Cambridge 52
Oxford 34
York 27
Barnsley 4.3
Burnley 2.7
Areas with higher rates of cycling often have large student populations and a flat
local landscape.
To make cycling and walking the natural choices for shorter journeys, or as part of a
longer journey 19
February 27, 2019Next steps: challenges & opportunities
Key Challenges & Opportunities
Breaking habits: how to get more people Future of Mobility & Future Mobility Zones
cycling and walking, particularly wider
Announced at budget 2018.
groups and those that are physically inactive
Reducing cyclist and pedestrian casualties: £90 million package for three city regions
implementing the 50 actions to improve safety To trial next-generation methods of transport, potentially
in a way that has greatest impact on casualty including extending cutting-edge digital payments to
reduction cover more methods of travel across more cities and
Coordinating a complex delivery chain to electric bikes.
maximise our impact: chain comprises five
core Government departments, dozens of
agencies, public and non-Government
organisations and hundreds of Local
Authorities.
Integrating active transport into wider
Government objectives: such as place-
making, house building, local regeneration, air
quality, health and well-being
Harnessing new technologies: to make
cycling and walking more attractive
To make cycling and walking the natural choices for shorter journeys, or as part of a
longer journey 20
February 27, 2019Contact details:
Guy Boulby
Head of Cycling and Walking
Active and Accessible Travel Division
Department for Transport
guy.boulby@dft.gov.uk
To make cycling and walking the natural choices for shorter journeys, or as part of a
longer journey 21
February 27, 2019Physical Activity for Health Research Centre (PAHRC)
UNDERSTANDING THE EVIDENCE - WEBINAR
Rapid Review of Health Benefits of
Walking and Cycling
Dr Paul Kelly (University of Edinburgh)
Dr James Woodcock (University of Cambridge)Presentation objectives Outline the review and its aim Summarise the main findings Discuss how report could be used
Review Team Yvonne Laird, Paul Kelly, Soren Brage, James Woodcock
Full title
Cycling and walking for individual and
population health benefits: a rapid
evidence review for health and care
system decision-makers
https://assets.publishing.service.gov.uk/government/uploads/system/uplo
ads/attachment_data/file/757756/Cycling_and_walking_for_individual_an
d_population_health_benefits.pdfThis rapid evidence review is intended for health and social care policy makers, decision makers and commissioners and attempts to address the following question: “What is the impact of walking and/or cycling on different health outcomes?”
Rationale The most recent estimates are that physical inactivity costs the NHS more than £450 million a year at Clinical Commissioning Group level. This equates to £817,274 per 100,000 individuals or £8.17 per person. This figure is likely to be an underestimate. The increased sedentary nature of occupations and much recreation, and the use of motorised transport could explain the trend for reduced activity levels. One in four women and one in five men in England are classed as physically inactive – that is, having less than 30 minutes a day of moderate activity
Context
https://www.gov.uk/government/publications/cycling-and-walking- investment-strategy
Cycling and Walking Investment Strategy • The Government aims to double cycling activity to 1.6 billion trips per year. • This is to aid population health and wellbeing plus improve road congestion, air quality, and economic and local development. • This ambition is to be realised through the Cycling and Walking Investment Strategy (CWIS). A fuller understanding of the health impacts of increasing walking and cycling will help underpin this investment. • In 2018, Government ministers asked for a clearer summary of the population health impacts that are specific to walking and cycling. • This was to strengthen the national narrative on the benefits of walking and cycling, and to make the health impact case more accessible. This review has been produced in response.
Methods The nature of the evidence for each health outcome was assessed according to the following hierarchy: 1. Systematic review and meta-analysis level evidence 2. Scoping and narrative review level evidence 3. Consistent study level evidence 4. Inconsistent study level evidence 5. Fragmented or incomplete level evidence 6. No evidence
Headline findings
This review found that walking and cycling benefit health in a number of ways: 1. People who walk or cycle have improved metabolic health and a reduced risk of premature mortality. 2. Walking and cycling reduce the risk factors for a number of diseases, including cardiovascular disease, respiratory disease, some cancers, and Type II diabetes. 3. Walking and cycling also have positive effects on mental health and general well- being. The mental health and neurological benefits include reduced risk of dementia, improved sleep quality, and a greater sense of wellbeing. 4. In environmental terms, health benefits accrue for the general population from a reduction in pollution due to car use and a decrease in road congestion. 5. The evidence is that on average the health benefits of walking and cycling outweigh any potential health risks and harms – for example from injury or pollution.
Conclusions
“The weight of evidence suggests that if walking and cycling can be increased, they have potential to lead to important health gains at the population level, and thus benefit the NHS and the wider health and care system.”
Evidence gaps
The evidence is stronger and more consistent for certain health outcomes, and evidence gaps remain in some areas. There is little direct evidence about whether walking or cycling to work might have different health effects to walking or cycling for leisure. There is little specific evidence available on the benefits of walking and cycling for people with disabilities and those living with long-term conditions. Similarly, there is little about the effects on groups living with different levels of deprivation. It would be helpful if these gaps were addressed, particularly regarding practical methods to improve access to physical activity for these groups.
Main findings
Walking Cycling
Physical Health Multiple
Systematic reviews
Benefits systematic reviews
Scoping reviews
Mental Health
and multiple Some studies
Benefits
studies
25 reviews and 15 studiesFurther questions
• Do health impacts differ by domain and type of walking and cycling? • What is known about walking-cycling health benefits by age (across the life-course)? • What is known about the benefits by socioeconomic status? • What is known about the benefits by disability and long-term health conditions? • Benefits for the wider population (e.g. pollution and emissions) • What about adverse effects? • Models and tools • Lessons for promoting walking and cycling
The Report 1. Walking through the weight of evidence across broad range of health outcomes 2. Challenge of direct and indirect evidence
The Report 1. Walking through the weight of evidence across broad range of health outcomes
The Report 1. Walking through the weight of evidence across broad range of health outcomes 2. Challenge of direct and indirect evidence
Walking Cycling
Physical Health Multiple
Systematic reviews
Benefits systematic reviews
Scoping reviews
Mental Health
Benefits
and multiple Some studies
studies
25 reviews and 15 studiesSpecific Evidence?
Walking Cycling
Mortality 4 2
CVD 8 3
Indicative –
Cancer 6 2 numbers for
illustration only!!!
Depression 5 2
Anxiety 2 2
Dementia 3 1
25 reviews and 15 studiesSpecific Evidence?
Walking Walking Cycling Cycling
commuting leisure commuting Leisure
Mortality 2 2 1 1
CVD 5 3 2 1
Cancer 3 3 2 0
Depression 3 2 2 0
Anxiety 1 1 1 1
Dementia 2 1 0 1
25 reviews and 15 studiesSpecific Evidence?
Walking commuting Walking leisure Cycling commuting Cycling Leisure
By age By sex By SES By age By sex By SES By age By sex By SES By age By sex By SES
Mortality 1 0 1 0 1 1 1 0 0 0 0 1
CVD 3 2 0 3 0 0 0 1 1 1 0 0
Cancer 1 1 1 0 3 0 0 0 2 0 0 0
Depressi 1 2 0 1 0 1 2 0 0 0 0 0
on
Anxiety 1 0 0 1 0 0 1 0 0 0 1 0
Dementi 1 0 1 1 0 0 0 0 0 1 0 0
a
25 reviews and 15 studiesDirect and indirect
evidenceDirect Walking or Health
Evidence Cycling Benefit
Physical
Indirect Walking or Health
Evidence
Activity
Cycling Benefit
(MVPA)James to take over
Walking and Cycling as part of total physical activity
Combining Different Activities • Intensity * Duration * Frequency • Marginal Metabolically Equivalent Tasks (MMETs) • METs above resting e.g. Ebikes 3.5, Walking 3.6, Cycling 5.4
Work in progress
numbers will
change!
150 minutes per week of moderate intensity activity = 8.8 MMETh/wk
300 minutes per week of moderate intensity activity =17.5 MMETh/wkwww.pct.bike/ict
WHO l higher
WHO lower
recommendatio
recommendation
n 17.5
= 8.8 MMETh/wk
MMETh/wkTools and models for use in practice
Propensity to Cycle Tool www.pct.bike • Estimate commuting (and soon schools) cycling potential in areas and along specific routes • Uses modified HEAT approach to estimate reduction in premature mortality and monetary values for this (includes electric assist bikes)
Propensity to Cycle Tool www.pct.bike
• New features being added in 2019
• Training courses being run
– Basic course aimed at less experienced users, who would like to learn to use
the interface more effectively.
– Intermediate course aimed at users who want to explore using the data
downloads in Excel and QGIS, producing tables, charts, and bespoke maps.
– Advanced course aimed at users who want to modify the PCT code base, to
create their own bespoke versions. Experience of using R or similar.
– Sign up link https://blog.pct.bike/2018/12/04/new-features-new-year/WebTAG: Web Transport Appraisal Guidance • For making business cases to DfT • Active travel appraisal includes physical activity benefits (reduction in years of life lost due to premature mortality) • Separate modules on air pollution, noise, traffic injury, and congestion (being included in PCT with the update) • Tool for physical activity benefits available to download in Excel or Analytica • https://www.gov.uk/government/publications/tag-social-and- distributional-impacts-worksheets
WHO Health Economic Appraisal of Transport
HEAT 4.1 • Includes health benefits from more walking or cycling • New scheme or for city level assessment • Health gains off set by – extra air pollution inhaled while walking or cycling – additional injury risk while walking or cycling
Important gaps
Few studies have investigated if the benefits of walking and cycling are different for disabled people. The evidence base on physical activity in disabled adults suggests an urgent need for further research to understand potential benefits of, or inequalities in access to, walking and cycling for disabled people. There are an additional set of questions about what walking and cycling participation might look like across a range of disabilities, mobilities, and conditions.
Evidence demonstrates that physical
activity improve the health and reduces
the risk of chronic diseases for disabled
adults.
Aerobic activities, like brisk walking,
wheeling, swimming, jogging, dancing,
cycling, playing basketball, rugby,
football or tennis, and balance,
stretching, and strength exercises, such
as push ups, sit ups, working with a
resistance band, and weight training, are
recommended for health benefits.
https://assets.publishing.service.gov.uk/government/uploads/system/uploads/attachment_data/file/748126/Physical_activity_for_gener
al_health_benefits_in_disabled_adults.pdfSpecific Evidence?
Walking commuting Walking leisure Cycling commuting Cycling Leisure
By age By sex By SES By age By sex By SES By age By sex By SES By age By sex By SES
Mortality 1 0 1 0 1 1 1 0 0 0 0 1
CVD 3 2 0 3 0 0 0 1 1 1 0 0
Cancer 1 1 1 0 3 0 0 0 2 0 0 0
Depressi 1 2 0 1 0 1 2 0 0 0 0 0
on
Anxiety 1 0 0 1 0 0 1 0 0 0 1 0
Dementi 1 0 1 1 0 0 0 0 0 1 0 0
a
25 reviews and 15 studiesSocio-demographic
inequalities and
differencesTainio and colleagues modelled mortality impacts of replacing short car trips with cycling by age, gender and SES. They found that benefits are greater for less deprived SES groups, largely because these groups were conducting more car trips. However, when Woodcock and colleagues modelled impacts of cycling uptake they found ethnic minority women would have the biggest time savings from cycling (as making slower walking and public transport trips). Previously, a systematic review (2014) identified two relevant modelling studies, which estimated that disadvantaged ethnic groups would benefit more from active travel than the general population. This was due to higher disease incidence.
Why might impacts vary? • Who and Where? • Who – Baseline risk of disease (e.g. older people or with other risk factors) – Non travel walking and cycling (e.g. people who do sport) – Higher injury risk (e.g. older people) – Higher air pollution susceptibility (e.g. people with asthma) • Where? – Injury risk (e.g. cycling on rural A roads) – Air pollution (e.g. walking by urban A roads)
Why might impacts vary?
• Potential
– Trips of walkable or cyclable distance (varies by ability)
– Area level hilliness (e-bikes)
– Access to convenient and safe walking and cycling routes
(requirements higher for some groups)
– Cultural, social and practical barriersAny questions?
Physical Activity for Health Research Centre (PAHRC)

          UNDERSTANDING THE EVIDENCE - WEBINAR

  Rapid Review of Health Benefits of
             Walking and Cycling

            Dr Paul Kelly (University of Edinburgh)
Dr James Woodcock (University of Cambridge)Questions and Answers
Next steps
Active Travel Physical Activity
How, and how best, can Active Travel interventions contribute to
increasing and sustaining Physical Activity?
An Evidence Review of published and grey literature
Commissioner: Sport England
Research team: Dr Nick Cavill, Prof Adrian Davis,
Dr Andy Cope & David Corner (Sustrans)
Publication: March 2019
More information: tim.fitches@sportengland.orgWhat will it tell us?
• The current and potential contribution of active travel to physical activity
• The strength of evidence on the effectiveness of active travel
interventions
• The most effective active travel interventions to support physical activity
How can we use it?
• Make the case for investing in active travel to support physical activity
• Identify the most effective interventions
• Inform active travel funding, planning and evaluation
• Understand important gaps in the evidenceYou can also read