Formulating and Optimizing a Novel Biochar-Based Fertilizer for Simultaneous Slow-Release of Nitrogen and Immobilization of Cadmium - MDPI
←
→
Page content transcription
If your browser does not render page correctly, please read the page content below
sustainability

Article
Formulating and Optimizing a Novel Biochar-Based
Fertilizer for Simultaneous Slow-Release of Nitrogen
and Immobilization of Cadmium
Lu Chen 1 , Qincheng Chen 1 , Pinhua Rao 2 , Lili Yan 2 , Alghashm Shakib 1 and Guoqing Shen 1, *
 1    School of Agriculture and Biology, Shanghai Jiao Tong University, 800 Dongchuan Road, Shanghai 200240,
      China; chenlu0001@sjtu.edu.cn (L.C.); chenqincheng@sjtu.edu.cn (Q.C.); shakibalghashm@gmail.com (A.S.)
 2    School of Chemistry and Chemical Engineering, Shanghai University of Engineering Science,
      Shanghai 201620, China; raopinhua@hotmail.com (P.R.); lily.502@163.com (L.Y.)
 *    Correspondence: gqsh@sjtu.edu.cn; Tel.: +86-21-342-061-43

 Received: 28 June 2018; Accepted: 2 August 2018; Published: 3 August 2018

 Abstract: This study aimed to develop and optimize a novel biochar-based fertilizer composed of
 rice husk biochar and urea–hydrogen peroxide (UHP), which can simultaneously slowly release
 nitrogen and immobilize cadmium (Cd). Response surface methodology (RSM) was adopted to
 optimize the fertilizer formulation with the lowest nitrogen release rate. Under the optimized
 conditions, the cumulative nitrogen release rate of the biochar-based fertilizer was 17.63%, which was
 significantly lower than that of ordinary fertilizer. Elementary analysis, scanning electron microscopy
 (SEM) images, and Fourier transform infrared (FTIR) spectroscopy proved that UHP attached to
 the porous structures of the biochar. The adsorption test showed that the adsorption of Cd onto
 biochar-based fertilizer quickly reached equilibrium with an equilibrium adsorbing quantity (Qe )
 of 6.3279 mg·g−1 with an initial concentration of 10 mg·L−1 . Compared to original biochar, the Cd
 immobilization ability of biochar-based fertilizer was significantly better. The adsorption of Cd on
 biochar-based fertilizer is mainly based on a monolayer adsorption behavior. Finally, improved
 crop growth was demonstrated by pot experiments, which showed a significant increase in the
 biomass of cabbage. The concept and findings presented in this study may be used as references in
 developing a novel biochar-based fertilizer for simultaneously enhancing crop yield and reducing
 environmental risk.

 Keywords:     biochar-based fertilizer;                urea–hydrogen peroxide;   slow-release;     nitrogen;
 immobilization; cadmium

1. Introduction
     Fertilizers play a vital role in enhancing crop yield. Many diverse fertilizers have been applied
to soil [1]. However, the use of fertilizers has been labeled by environmentalists as a main source of
water and soil environment pollutants. The main environmental impacts associated with fertilizer
use have been linked to leaching and runoff of nutrients, especially nitrogen, which causes aquatic
eutrophication. The extensive use of fertilizers may also decrease the pH and increase the availability
of heavy metals in soil [2]. Typically, cadmium is a highly hazardous metal, which can be easily
absorbed by plants with a high transfer coefficient and then assimilated by animals and humans [3].
For example, Huang et al. reported that applying large amounts of compound fertilizers constantly
increased the available content of Cd in soils. Accordingly, Cd absorbed by plants also increased [4].
Considering the crop production and environmental risk, researchers and fertilizer producers have
attempted to search for means to achieve newly defined goals of fertilizer use: improved fertilizer
nutrient use efficiency and reduced bio-availability of heavy metals in soil or fertilizers [5].

Sustainability 2018, 10, 2740; doi:10.3390/su10082740                      www.mdpi.com/journal/sustainability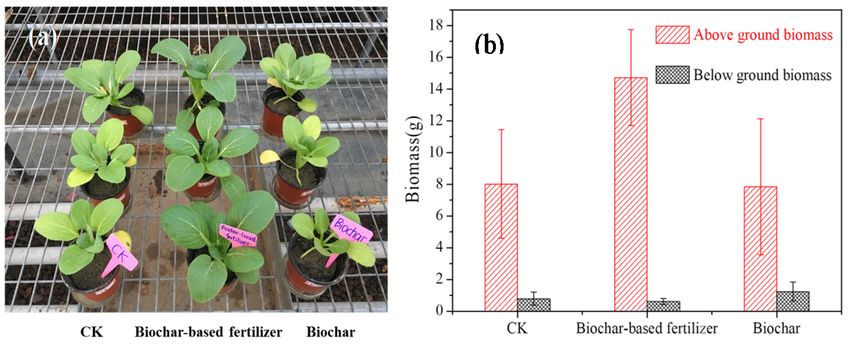
Sustainability 2018, 10, 2740                                                                        2 of 14

     Biochar is a carbon-enriched product obtained by heating biomass under low-oxygen or
oxygen-free conditions [6]. Biochar possesses specific properties, such as a porous structure, a relatively
large surface area, a large number of functional groups, and abundant mineral elements, that
benefit the immobilization of heavy metals and loading of fertilizer nutrients in soil. For example,
Yousaf et al. [7] demonstrated that biochar decreases the availability and uptake of Cd in wheat.
Numerous researchers also proved that supplementing biochar can reduce the fertilizer loss to
improve soil fertility. For instance, Kimetu [8] and Mizuta et al. [9] demonstrated that biochar,
which contains many functional groups, strongly adsorbs various nutrient ions, including nitrate,
ammonium, phosphate, and potassium ions, to load nutrients and reduce soil nitrogen nutrient loss.
     However, biochar itself does not contain enough nutrients for crop growth. Asai et al. [10] found
that grain yield decreased when only applying biochar due to the insufficient supply of nitrogen (N).
Thus, supplementing biochar with certain fertilizers (for example urea) renders biochar materials more
suitable for stimulating plant growth [11] and heavy metal adsorption [12]. Due to the agricultural
and environmental advantages, biochar-based fertilizer has been receiving increasing attention [13].
Many researchers have observed that biochar-based fertilizers delay the release of nutrients in soil
and display a slow-release effect [14–17]. Supplementing biochar-based fertilizer can adjust the soil
pH, reduce the bulk density to improve soil ventilation and permeability, and increase the crop yield
significantly [18–20]. However, the effectiveness of biochar-based fertilizer for simultaneously slowly
releasing nitrogen and immobilizing heavy metals requires further investigation. In the present study,
we attempted to use urea–hydrogen peroxide (H2 NCONH2 H2 O2 (UHP)) and biochar to prepare a
novel biochar-based fertilizer that can slowly release nitrogen and immobilize Cd simultaneously.
UHP is an oxygen–nitrogen fertilizer composed of a complex of urea with hydrogen peroxide (H2 O2 ).
In agriculture, UHP exhibits two properties: it delivers oxygen through hydrogen peroxide and
supplies nitrogen for fertilizer by urea. Frankenberger [21] demonstrated that using UHP as a watering
solution after flooding can improve the aeration of soil and crop growth.
     Although biochar-based fertilizers have many potential advantages, their storage, transport, and
application to soil remain challenging due to their irritation of human skin, eyes, and respiratory
system [22]. Husk and Major [23] found that 25% of their applied biochar was lost during field
spreading. Moreover, due to heavy rainfall events, 20–53% of biochar applied to the soil ran off [24].
Therefore, the development of suitable biochar-based fertilizer products that can provide a long-term
supply of nutrients and with a minimal loss of biochar is necessary. From this point of view,
pelletization can significantly alleviate the loss of biochar during application to soil and reduce
the costs of transport and handling [25]. However, some influencing factors, such as water addition,
mass ratio of fertilizer to biochar, and binder addition, affect pelletization [26]. Thus, optimization is
required. The traditional single-factor optimization is time-consuming and entails several experiments
for determining the optimal levels. This technique is also unreliable because of its exclusion of the
interactive effects among the variables studied [27].
     In the present study, a novel biochar-based fertilizer composed of biochar and UHP was
investigated for the simultaneous slow-release of N and enhancing Cd adsorption. We hypothesized
that (1) urea from UHP can be slow-released from optimized biochar-based fertilizer and further
stimulate crop growth; (2) H2 O2 from UHP could increase oxygen-containing functional groups on
the surface of biochar-based fertilizers and thus enhance its ability to adsorb Cd. The Box–Behnken
design (BBD) of the response surface methodology (RSM), an effective statistical and optimization
technique [28], was adopted to study the influences of important operating parameters, including
water addition, mass ratio of fertilizer to biochar, and kaolin addition, on the release rate of nitrogen.
The physicochemical properties of optimal biochar-based fertilizer were characterized in detail. The Cd
adsorption capacity of the optimal biochar-based fertilizer was assessed through an adsorption
experiment. The effect on crop growth was also investigated using pot experiments.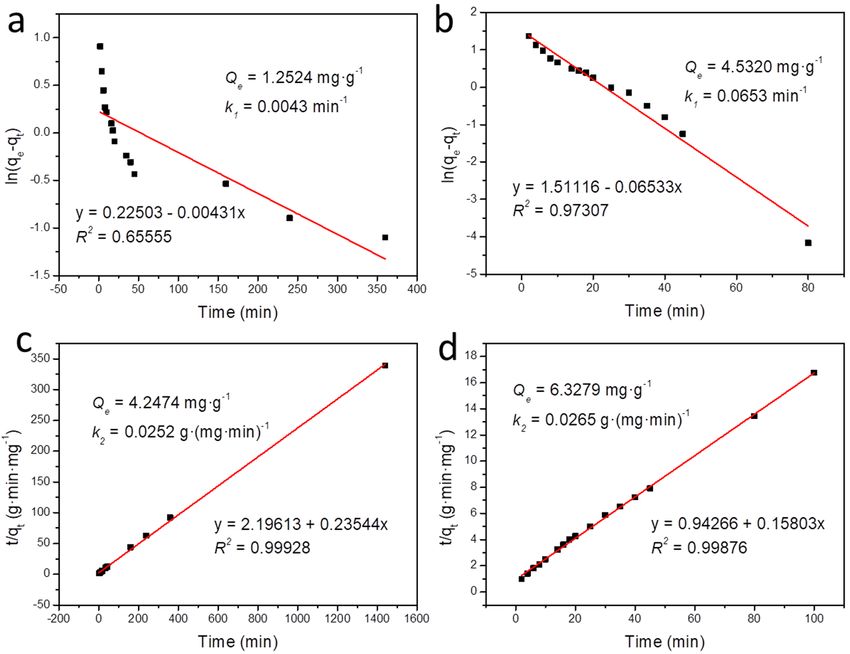
Sustainability 2018, 10, 2740                                                                                      3 of 14

2. Materials and Methods

2.1. Preparation Process of Biochar-Based Fertilizer
      Biochar was prepared through slow pyrolysis of rice husks at 500 ◦ C. The biochar was then placed
in UHP solution for 24 h at room temperature. After the impregnation procedure, the biochar-based
fertilizer samples were transferred in an electric thermostatic drying oven at 60 ◦ C for 24 h.
The biochar-based fertilizer was crushed and passed through 40-mesh (i.e., 425 µm mesh size) standard
metal sieves. Certain amounts of biochar-based fertilizer and kaolin were mixed and placed in a disc
pelletizer to begin pelletization. The rotating speed of the turntable was adjusted to 30 r·min−1 , and
the tilt angle of the turntable was 45◦ . When the material was fully mixed, distilled water was sprayed
onto the granulator with an atomizer. After being shaped, the granular biochar-based fertilizer was
removed from the disc granulator, placed in an electric thermostatic drying oven, and dried at 40 ◦ C.

2.2. Optimizing Parameters Using RSM
     To optimize the preparation conditions for the biochar-based fertilizer, Design-Expert 8.0.6
(Stat-Ease Inc., Minneapolis, MN, USA) with RSM was used. The total outline included three factors:
water addition, mass ratio of fertilizer to biochar, and kaolin addition, each of which was coded at three
levels (−1, 0, and 1; Table 1). Equation (1) was created by using RSM to determine the relationship
between experimental factors and the response surface.
                                          n             n                  n
                           Y = A0 + ∑i=1 Ai Xi + ∑i=1 Aii Xi2 + ∑i,j=1(i6= j) Aij Xi X j + ε                          (1)

where Y is the response value predicted by the model; A0 , Ai , Aii , and Aij represent the constant
term and coefficients of the linear, squared, and interaction terms, respectively; and ε is the residual
associated with the experiments.

                     Table 1. Levels and codes of experimental factors on the Box–Behnken design.

                                                            Experimental Factors
               Level
                            Water Addition X 1 (%)   Fertilizer-Biochar Mass Ratio X 2   Kaolin Addition X 3 (%)
                −1                    5                             0.1                             5
                0                    15                              1                             15
                1                    25                             1.9                            25

2.3. Leaching through a Sand Column Experiment
     A leaching experiment was performed in a series of specially designed polyvinyl chloride (PVC)
columns (Figure 1). In this study, to reasonably evaluate the slow-release property, inert quartz sand
(Shanghai Tian Scientific Co., Ltd., Shanghai, China) was used to create a pure system for our leaching
experiment [29–31]. PVC tubes with an inner diameter of 4 cm and a height of 30 cm were used.
The bottom of the tubes were sealed with double layer 100-mesh gauze, and 20 cm of each PVC tube
was loaded with quartz sand that was passed through 40-mesh standard metal sieves. Distilled water
was used for leaching. After the solution became clear and transparent, 5 g of biochar-based fertilizer
was added and covered with 5-cm-thick quartz sand. The intermittent leaching test was initiated.
To simulate natural rainfall, distilled water (100 mL) was slowly added every 24 h. The leaching
solution was collected using 250 mL conical flasks. The urea content in the leaching solution was
determined by spectrophotometry with P-dimethylaminobenzaldehyd [32]. Each group was measured
three times. Equation (2) was used to calculate the urea content in the leaching solution. V represents
the volume of leaching solution and c represents the concentration of leachate.

                                                       M=V×c                                                          (2)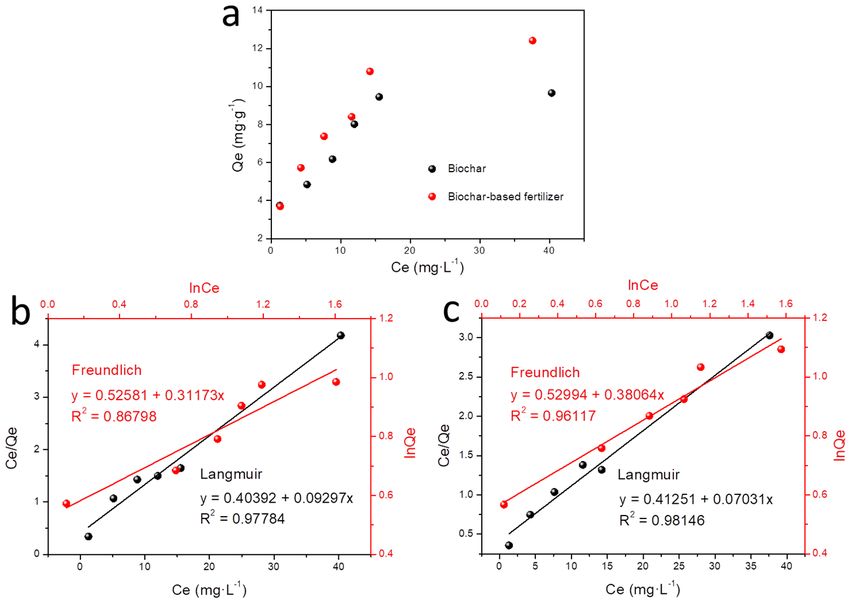
Sustainability 2018, 10, 2740                                                                                4 of 14
Sustainability 2018, 10, x FOR PEER REVIEW                                                                   4 of 14

                                    Figure 1. Overview of the column system.
                                    Figure 1. Overview of the column system.

2.4. Characterization of Biochar‐Based Fertilizer
2.4. Characterization of Biochar-Based Fertilizer
      The concentrations of C, H, O, and N in biochar‐based fertilizer were determined by an
elementalconcentrations
     The    analyzer (Vario  of EL
                                C, H,  O, and
                                   Cube,          N in biochar-based
                                           Elementar,    Langenselbold,fertilizer
                                                                          Germany).wereThe
                                                                                         determined
                                                                                            morphologyby an
                                                                                                          of
elemental   analyzer
biochar‐based          (Vario
                fertilizer  wasELanalyzed
                                   Cube, Elementar,
                                           by scanning Langenselbold,    Germany).
                                                          electron microscopy          The
                                                                                  (SEM).    morphology
                                                                                          Fourier         of
                                                                                                  transform
biochar-based
infrared (FTIR)fertilizer  was analyzed
                   spectroscopies          by scanningfertilizer
                                    of biochar‐based      electronwere
                                                                   microscopy     (SEM). by
                                                                         characterized   Fourier  transform
                                                                                             a Nicolet  6700
infrared  (FTIR)   spectroscopies   of biochar-based
spectrometer (Thermo Scientific, Waltham, MA, USA).     fertilizer were characterized    by a  Nicolet 6700
spectrometer (Thermo Scientific, Waltham, MA, USA).
2.5. Adsorption Experiments
2.5. Adsorption Experiments
      Adsorption experiments were conducted by mixing 0.5 g of biochar‐based fertilizer with 10
      Adsorption    experiments were conducted by mixing 0.5 g of biochar-based fertilizer with
mg∙L−1 Cd  2+ solution and stirring with a magnetic stirrer under 25 °C. The samples were obtained at
10 mg·L−1 Cd2+ solution and stirring2+with a magnetic stirrer under 25 ◦ C. The samples were obtained
different times to determine the Cd concentration by inductively coupled plasma optical emission
at different times to determine the Cd2+ concentration by inductively coupled plasma optical emission
spectrometry (ICP‐OES). Equation (3) was used to calculate the equilibrium adsorption capacity:
spectrometry (ICP-OES). Equation (3) was used to calculate the equilibrium adsorption capacity:
                                                Qe = V(ρ0 − ρe)/m                                         (3)
                                              Qe = V(ρ0 − ρe )/m                                           (3)
where V represents the volume (L) of Cd2+ solution; m represents the mass of biochar‐based fertilizer
(g); ρ0 V
where   and  ρe are the
          represents  theinitial
                           volumeand(L)
                                      final concentration
                                        of Cd              (mg∙L
                                              2+ solution; m      −1) of Cd2+ solutions, respectively; and Qe
                                                             represents   the mass of biochar-based fertilizer
represents
(g); ρ and ρtheare
                 amount    of Cd
                   the initial  andadsorbed
                                 2+           onto the biochar‐based
                                    final concentration  (mg·L−1 ) of fertilizer (mg∙g−1respectively;
                                                                        Cd2+ solutions,  ).            and Q
     0        e                                                                                                   e
represents the amount of Cd2+ adsorbed onto the biochar-based fertilizer (mg·g−1 ).
2.6. Pot Experiment Design
2.6. Pot Experiment
      Three           Design
             treatments,    each with three replicates, were used in the current pot experiment: control,
biochar,
      Three treatments, eachfertilizer
          and  biochar‐based      with threetreatment. A total
                                               replicates, wereofused
                                                                  ninein
                                                                       pots
                                                                          thewas  used.pot
                                                                              current     These  pots werecontrol,
                                                                                             experiment:     placed
in a greenhouse
biochar,             in a randomized
         and biochar-based      fertilizer arrangement.    Eachofpot
                                           treatment. A total     ninecontained   300 gThese
                                                                       pots was used.      soil. The
                                                                                                 pots biochar   and
                                                                                                      were placed
biochar‐based
in a greenhouse  fertilizer  amendmentarrangement.
                    in a randomized         rate was 2% w/wEachdry
                                                                 potweight.   Cabbage
                                                                      contained   300 gseeds
                                                                                          soil. (Brassica  chinensis
                                                                                                 The biochar    and
L.) were sprinkled
biochar-based           on amendment
                fertilizer  a filter paperratemoistened
                                                was 2% w/w with
                                                              drydeionized   water inseeds
                                                                  weight. Cabbage        a petri  dish. chinensis
                                                                                             (Brassica   On day L.)
                                                                                                                  7,
germinated
were          seeds
      sprinkled  on awere
                       filterrandomly    chosen and
                              paper moistened     withreplanted
                                                       deionizedinwater
                                                                    soil with  one plant
                                                                         in a petri  dish. per
                                                                                            On pot.  Allgerminated
                                                                                                day 7,    pots were
watered
seeds     every
       were      day under
             randomly    chosengreenhouse    conditions.
                                  and replanted   in soil After 30 days,
                                                          with one  plantall
                                                                          perplant
                                                                               pot. samples
                                                                                     All pots were harvested    and
                                                                                                    watered every
weights   of fresh biomass     were  determined.
day under greenhouse conditions. After 30 days, all plant samples were harvested and weights of
fresh biomass were determined.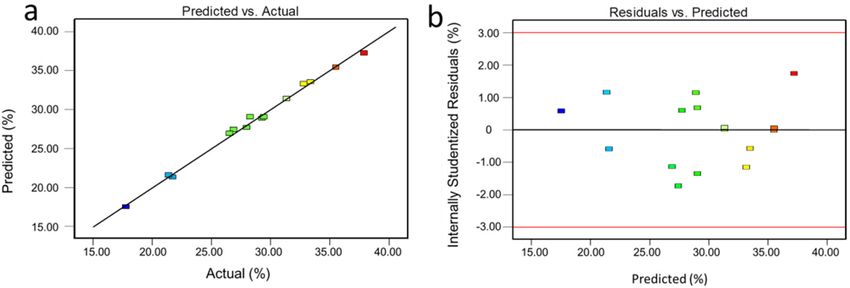
Sustainability 2018, 10, 2740 5 of 14
3. Results and Discussion
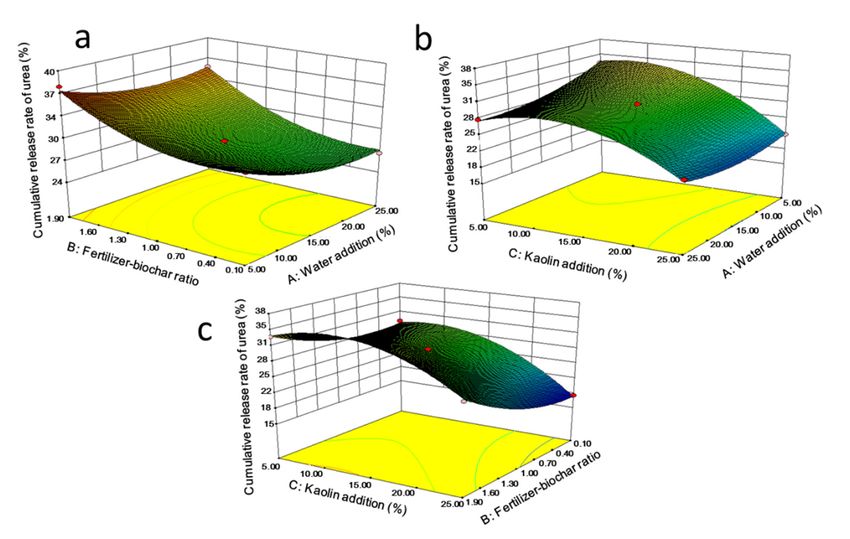
3.1. Model Establishment and Analysis
Based on single-factor experiments, the effects of water addition (X1 ), fertilizer–biochar mass ratio
(X2 ), and kaolin addition (X3 ) on the slow-release ability of biochar-based fertilizer were determined
by RSM. The corresponding ranges and cumulative release rate obtained from these ranges are listed
in Table 2. The second-order polynomial model denoting the relationship between the response and
the variables is as follows:
Y = 29.05 − 1.40X1 + 3.94X2 − 4.49X3 + 0.55X1 X2 + 1.31X1 X3 + 1.19X2 X3 + 1.54X12 + 2.29X22 − 4.62X32 . (4)
Table 2. Experimental design and results of the cumulative release rate of urea (n = 3, σ < 0.2).
Code Factors Response Y (%)
Runs
X1 X2 X3 Actual Predicted
1 0 1 −1 33.31 33.505
2 0 −1 −1 29.3 28.915
3 1 0 −1 27.95 27.75
4 −1 −1 0 31.35 31.345
5 1 0 1 21.77 21.380
6 1 1 0 35.51 35.515
7 0 −1 1 17.74 17.545
8 0 0 0 29.42 29.047
9 0 0 0 28.3 29.047
10 −1 0 1 21.37 21.570
11 0 0 0 29.42 29.047
12 −1 1 0 37.8 37.215
13 −1 0 −1 32.78 33.170
14 0 1 1 26.52 26.905
15 1 −1 0 26.85 27.435
Note: −1, 0, and 1 represent low, medium, and high levels, respectively; X1 , water addition; X2 , fertilizer–biochar
ratio; X3 , kaolin addition; and Y, cumulative release rate of urea.
Sustainability 2018, 10, x FOR PEER REVIEW 6 of 14
Analysis of variance (ANOVA) was used to evaluate the significance of each factor and interaction
terms. As shownX2 Xin3 Table 3, the distinction
5.69 between the1 coefficient of determination
5.69 (R2 = 0.9944)
12.49 0.0167 and
X 12 8.76 2 1 8.76
adjusted coefficient of determination (Adjusted R = 0.9843) was under 0.01. The model 19.24 0.0071
achieved
X22 19.37 1 19.37 42.53 0.0013
a significant result, with a p value less than 0.001; the lack-of-fit p value (p > 0.05) verified that the
X32 78.80 1 78.80 172.99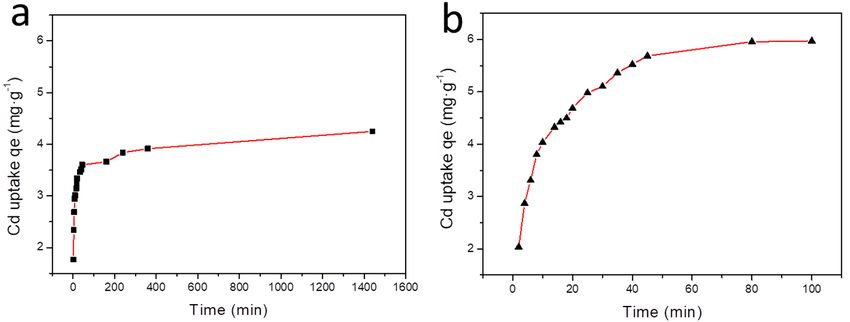
Sustainability 2018, 10, 2740                                                                                   6 of 14

                                      Table 3. ANOVA of the response surface quadratic model.

                                               Sum of       Degrees of                                    p Value
                    Source                                                Mean Square       F Value
                                               Squares       Freedom                                      Prob > F
                       Model                   403.92           9            44.88           98.53
Sustainability 2018, 10, 2740 7 of 14
The fertilizer–biochar mass ratio exerted a negative effect on the cumulative release rate, meaning
the response decreased as the biochar amount increased. This result is in accordance with Jiang’s
work [33]. The authors suggested that this effect was observed because some urea molecules entered
the pores of the biochar given the dissolution by water, mechanical agitation, and biochar adsorption.
The pores displayed a capillary effect due to their small pore size, and their strong adsorption of urea
molecules enabled the biochar to release the urea slowly.
Figure 3b,c shows the response surface obtained by plotting kaolin addition versus water addition
and fertilizer–biochar mass ratio. Kaolin addition exerted a negative effect on the cumulative release
rate, with the response decreasing as the kaolin amount increased. This phenomenon occurred because
higher kaolin amounts result in a high density of the fertilizer granules, which led to excellent resistance
and a longer time for nutrients to migrate from inside to the particle surface [33].
3.3. Experimental Validation of the Optimized Conditions
We validated the optimized conditions for the lowest cumulative nitrogen release rate of
biochar-based fertilizer. In particular, the optimized conditions for the slow-release ability of nitrogen
from biochar-based fertilizer were observed at 16.89% water addition under the use of 25% kaolin
when the fertilizer–biochar mass rate was 0.2. The minimum cumulative nitrogen release rate of
the biochar-based fertilizer at this condition was 17.66%. The optimized conditions were validated
repeatedly (n = 3). The results showed a cumulative nitrogen release rate of 17.63 ± 0.004%. A good
agreement between the experimental and calculated values (relative error = 0.178%) showed that
biochar could be used successfully for slowing fertilizer release. Compared with the control (UHP
application only, 68.66% of cumulative nitrogen release rate), application of biochar-based fertilizer
reduced the overall cumulative nitrogen via leaching by 74.32%. Ding et al. [34] reported that
application of bamboo charcoal reduced overall cumulative nitrogen via leaching by 15.2%. Therefore,
the nitrogen slow-release in biochar-based fertilizer increased significantly. This may be ascribed to the
H2 O2 from UHP.
3.4. Characterization of Biochar-Based Fertilizer
The SEM images of the biochar and biochar-based fertilizers (Figure 4) depict the active porous
structures on the biochar surface. Biochar (Figure 4a,b) exhibited a homogeneous pore distribution
with a relatively clean and smooth pore surface. Comparatively, some wrinkles appeared on the pore
surface of the biochar-based fertilizer sample, shown in Figure 4c,d. In addition, some white particles
were adsorbed on the pore surface of the biochar-based fertilizer. This above phenomenon may indicate
that the UHP fertilizers were strongly attached to the biochar without significantly influencing the
pore structure.
Table 4 indicates that the total carbon contents in biochar and biochar-based fertilizer were 50.10%
and 49.03%, respectively. The C/N ratio of biochar-based fertilizer was significantly lower compared
with that of untreated biochar. This result implies that the N content in UHP was loaded onto the
biochar and helped reduce the risk of effective nitrogen loss from soil, and thus the slow plant growth
was due to the application of biochar only. The O/C ratio of biochar can reflect the stability of
biological carbon in soil. Generally, a O/C ratio lower than 0.2 results in a minimum 1000 years of
biochar half-life [35]. As shown in Table 4, the O/C ratios of biochar and biochar-based fertilizer
were 0.17 and 0.18, respectively, which indicates that the rice-husk-derived biochar demonstrated
good stability.Sustainability 2018, 10, 2740 8 of 14
Sustainability 2018, 10, x FOR PEER REVIEW 8 of 14
Figure 4. Scanning electron microscopy (SEM) micrographs of (a,b) biochar and (c,d) biochar‐based
Figure 4. Scanning electron microscopy (SEM) micrographs of (a,b) biochar and (c,d) biochar-
fertilizer.
based fertilizer.
Table 4 indicates that the total carbon contents in biochar and biochar‐based fertilizer were
Table 4. Primary elements of biochar-based fertilizer, including the carbon–nitrogen (C/N) and
50.10% and 49.03%, respectively. The C/N ratio of biochar‐based fertilizer was significantly lower
oxygen–carbon (O/C) molar ratios.
compared with that of untreated biochar. This result implies that the N content in UHP was loaded
onto the biochar
Sampleand helped reduce C (%)the risk H
of (%)
effectiveNnitrogen
(%) loss from soil,
O (%) C/Nand thusO/Cthe slow
plant growth was due to the application of biochar only. The O/C ratio of biochar can reflect the
Biochar 50.10 1.71 0.72 11.33 81.18 0.17
stability of biological
Biochar-based carbon in soil.
fertilizer Generally,2.18
49.03 a O/C ratio5.60lower than 0.2 results
11.81 in a minimum
10.21 0.18 1000
years of biochar half‐life [35]. As shown in Table 5, the O/C ratios of biochar and biochar‐based
fertilizer were 0.17 and 0.18, respectively, which indicates that the rice‐husk‐derived biochar
Fourier transform infrared (FTIR) spectroscopy is an established tool for detecting functional
demonstrated good stability.
groups to further study adsorption behavior [36]. In this study, most of the FTIR spectra were similar
for biochar and
Table 4. biochar-based
Primary elements fertilizer, except for
of biochar‐based the peak
fertilizer, that appeared
including in biochar-based
the carbon–nitrogen (C/N)fertilizer
and at
− 1
1635 oxygen–carbon
cm corresponding to theratios.
stretching vibration of C=O (Figure 5) [37]. In addition, the broad peak
(O/C) molar
at 2360 cm−1 , associated with the stretching vibration of C–O in biochar-based fertilizer, was stronger
Sample
than that in biochar, implying the increase C (%)
in C–O Hin (%) N (%) fertilizer
biochar-based O (%) [38].C/N O/C
The appearance of
these oxygen-containing surface functional groups may be attributed to H2 O2 from UHP,0.17
Biochar 50.10 1.71 0.72 11.33 81.18 which can
cause theBiochar‐based
oxidization of fertilizer 49.03 thereby
carbonized surfaces, 2.18enhancing5.60the biochar’s
11.81 ability
10.21to adsorb
0.18 heavy
metals [39].
Fourier transform infrared (FTIR) spectroscopy is an established tool for detecting functional
groups to further study adsorption behavior [36]. In this study, most of the FTIR spectra were similar
for biochar and biochar‐based fertilizer, except for the peak that appeared in biochar‐based fertilizer
at 1635 cm−1 corresponding to the stretching vibration of C=O (Figure 5) [37]. In addition, the broad
peak at 2360 cm−1, associated with the stretching vibration of C–O in biochar‐based fertilizer, was
stronger than that in biochar, implying the increase in C–O in biochar‐based fertilizer [38]. The
appearance of these oxygen‐containing surface functional groups may be attributed to H2O2 from
UHP, which can cause the oxidization of carbonized surfaces, thereby enhancing the biochar’s ability
to adsorb heavy metals [39].Sustainability 2018, 10, 2740 9 of 14
Sustainability
Sustainability 2018,
2018, 10,
10, xx FOR
FOR PEER
PEER REVIEW
REVIEW 99 of
of 14
14
-1 -1
3368 1585
1585 cm
3368 cm
-1
cm
-1
Biochar
Biochar cm
-1 -1
2363 799
799 cm
2363 cm
-1 -1
cm cm
Biochar-based
Biochar-based fertilizer
fertilizer
-OH C=C
C=C
-OH 2360
2360 cm
cm
-1
-1
-1
(a.u.)
Intensity (a.u.) 788
788 cm
cm
-1
-1 -1
3343
3343 cm 1447
1447 cm
-1 -1
cm cm
-1
Urea-hydrogen 1615 cm -1
Urea-hydrogen peroxide
peroxide 1615 cm
Intensity
-1
1464
1464 cm
cm
-1
C=O
C=O -1
1635
1635 cm
cm
-1
3500
3500 3000
3000 2500
2500 2000
2000 1500
1500 1000
1000 500
500
-1
Wavenumber
Wavenumber (cm
(cm ))
-1
Figure 5. Stack
Figure 5.
5. Stack plot
plot of
of Fourier
Fourier transform
transform infrared
infrared (FTIR)
(FTIR) spectra
spectra of biochar, biochar-based
of biochar, biochar‐based
biochar‐based fertilizer,
fertilizer,
and urea–hydrogen
and urea–hydrogen peroxide
urea–hydrogen peroxide (UHP).
peroxide (UHP).
(UHP).
3.5.
3.5. Adsorption
Adsorption Kinetic
Kinetic Models
Models for
for Cadmium
Cadmium
The adsorption
The adsorptionkinetics
adsorption kinetics
kinetics are
arearean
an important characteristic
an important
important for
for defining
characteristic
characteristic the
the efficiency
for defining
defining the of
efficiency of adsorption
efficiency
adsorptionof
[40]. Figure
adsorption 6
[40].shows
Figure the
6 adsorption
shows the capacities
adsorption of Cd
capacities 2+ versus
of Cd 2+time
versusat an
time initial
at an concentration
initial of
concentration 10
[40]. Figure 6 shows the adsorption capacities of Cd versus time at an initial concentration of 10
2+
mg∙L .. At −1 . initial
·Lthe At thestage of the
of 10 −1
mg∙L mg
−1 At the initial initial
stage the adsorption
of stage adsorption process,
process, the
of the adsorption adsorption
process,
the rate
rate was
the adsorption
adsorption was veryrate high.
very was Then,
high.very the
high.
Then, the
rate
Then, exhibited
the rate a gradual
exhibited a decrease
gradual until
decrease adsorption
until adsorption equilibrium
rate exhibited a gradual decrease until adsorption equilibrium was reached. From this equilibrium was was reached.
reached. From
From this
characterization of the adsorption kinetics, the Cd 2+
Cd2+ were
were initially
initially rapidly
rapidly adsorbed
adsorbed onto onto the
the exterior
2+
characterization
characterization of of the
the adsorption
adsorptionkinetics,
kinetics,the
theCd exterior
surface
surface
surface of of biochar
biochar and then diffused
and then diffused intointo the
the pores
pores of
of biochar
biochar and and adsorbed
and adsorbed onto
adsorbed onto their
onto their interior
their interior surface.
interior surface.
surface.
Compared
Compared with biochar,
biochar, the
the time
time for biochar‐based
Compared with the biochar, the time for biochar‐based fertilizer to reach equilibrium decreased from
with the biochar-based fertilizer to reach equilibrium decreased from
1400
1400 min
1400 min
min to to 100
to100
100min,min,
min,andand the
andthe adsorption
theadsorption capacity
adsorptioncapacity increased
capacityincreased
increasedfrom from 4.2477
from4.2477
4.2477mg ·g−1−1−1to
mg∙g
mg∙g to 5.9702
to5.9702
5.9702mg ·g−−1−11..
mg∙g
mg∙g
Therefore, the amount of Cd 2+
Cd2+ adsorbed
adsorbed onto
onto the
the biochar‐based equilibrium
2+
Therefore,
Therefore, the theamount
amountof ofCd adsorbed biochar-based
biochar‐based fertilizer
fertilizer sample
sample under under equilibrium
equilibrium
was
was larger than that biochar sample, indicating that the biochar‐based
was larger than that of the biochar sample, indicating that the biochar‐based fertilizer exhibited better
larger than that of the biochar-based fertilizer exhibited better
Cd
Cd adsorption efficiency.
adsorption efficiency.
efficiency.
Figure 6.
6. Adsorption
Figure 6. kinetics
Adsorption kinetics of
kinetics of cadmium
of cadmium onto
cadmium onto (a)
onto (a) biochar
(a) biochar and
biochar and (b)
and (b) biochar‐based
(b) biochar-based fertilizer
biochar‐based fertilizer over
fertilizerover time.
overtime.
time.
Figure Adsorption
The
The adsorption
adsorption kinetics
kinetics of
of Cd
Cd on
on biochar
biochar and
and biochar‐based
biochar‐based fertilizer
fertilizer were
were analyzed
analyzed by
by two
two well‐
well‐
known
known kinetic models: the pseudo‐first‐order model and the pseudo‐second‐order model, which are
kinetic models: the pseudo‐first‐order model and the pseudo‐second‐order model, which are
shown
shown in
in Equations
Equations (5)
(5) and
and (6),
(6), respectively.
respectively.
Qtt == Q
Q Qee(1
(1 ‐‐ exp
exp ‐k
‐k11tt )) (5)
(5)Sustainability 2018, 10, 2740 10 of 14
The adsorption kinetics of Cd on biochar and biochar-based fertilizer were analyzed by two
well-known kinetic models: the pseudo-first-order model and the pseudo-second-order model, which
are shown in Equations (5) and (6), respectively.
Sustainability 2018, 10, x FOR PEER REVIEW 10 of 14
Qt = Qe (1 − exp(−k1 t)) (5)
Qt = Qe k2 t/(1 + Qm k2 t) (6)
Qt = Qe k2 t/(1 + Q m k2 t)) (6)
where t denotes the contact time (min); Qe and Qt denote the amounts of Cd2+ (mg∙g−1) adsorbed
where t denotesand
at equilibrium theacontact timerespectively;
given time, (min); Qe and andQt kdenote
1 (min the amounts
−1) and of Cd2+ (mg
k2 (g∙(mg∙min) g−1 ) adsorbed
−1), ·calculated from
at
theequilibrium
plots in Figureand 7,a given
are thetime, respectively;
rate constant and k1 (min−1 ) and
of pseudo‐first‐order and kpseudo‐second‐order −1
2 (g·(mg·min) ), calculated kinetics,
from the plots
respectively. in Figure 7,the
Accordingly, areR2 the
value rate constant
revealed thatofthe
pseudo-first-order
correlation coefficientand pseudo-second-order
of the pseudo‐second‐
kinetics, respectively. Accordingly, the R 2 value revealed that the correlation coefficient of the
order kinetic model was higher than that of the pseudo‐first order kinetic model, which suggested
pseudo-second-order
that the kinetics of Cd kinetic model wason
2+ adsorption higher than that offertilizer
biochar‐based the pseudo-first
could be order kinetic model,
described better bywhichthe
suggested that the kinetics
pseudo‐second‐order of Cd2+
equation. adsorption
Figure 7 showson that
biochar-based fertilizer
the Cd sorption could beofdescribed
capacity better by
the biochar‐based
the pseudo-second-order
fertilizer equation. Figure
significantly increased (48.98%) 7 shows that thewith
compared Cd sorption
that of capacity
biochar.of Whenthe biochar-based
the initial
fertilizer significantly
concentration of Cd increased
2+ was 10 mg∙L (48.98%)
−1 , thecompared
adsorbing with that ofat
quantity biochar. When of
equilibrium theCd
initial concentration
on biochar‐based
of Cd2+ was
fertilizer (Qe 10 mg·L−mg∙g
= 6.3279 1 , the
−1) adsorbing
was higherquantity
than thataton equilibrium
biochar (Qeof= Cd on mg∙g
4.2474 biochar-based
−1). Bhatnagarfertilizer
et al.
(Q − 1
·g the − 1
·g ). carbon
e =reported
[41] 6.3279 mg that ) was higher than
adsorption that on biochar
of cadmium (Qe =improved
significantly 4.2474 mgwhen Bhatnagar was et al. [41]
oxidized,
reported
which was thatattributed
the adsorptionto theofgenerated
cadmium carboxylic
significantly improved
acid groups when carbon was
contributing to the oxidized, which
adsorption of
was attributed to the generated carboxylic acid groups contributing to
cadmium. Based on the above analysis and FTIR results, the increase in Cd adsorption capacity in the adsorption of cadmium.
Based on the
our study above
may haveanalysis and to
been due FTIRtheresults, the increase insurface
oxygen‐containing Cd adsorption capacity5)inon
groups (Figure ourthe
study may
biochar‐
have
basedbeen due to the oxygen-containing surface groups (Figure 5) on the biochar-based fertilizer.
fertilizer.
Figure 7. Kinetic models of Cd2+ adsorption onto the (a,c) biochar and (b,d) biochar‐based fertilizer
Figure 7. Kinetic models of Cd2+ adsorption onto the (a,c) biochar and (b,d) biochar-based fertilizer
over time. (a,b) Pseudo‐first‐order plot and (c,d) pseudo‐second‐order plot.
over time. (a,b) Pseudo-first-order plot and (c,d) pseudo-second-order plot.
3.6. Adsorption Isotherms
3.6. Adsorption Isotherms
The typical adsorption isotherms of Cd on biochar and biochar‐based fertilizer were investigated
The typical adsorption isotherms of Cd on biochar and biochar-based fertilizer were investigated
at initial concentrations ranging from 1 to 50 mg∙L−1− . As shown in Figure 8a, both for biochar and
at initial concentrations ranging from 1 to 50 mg·L 1 . As shown in Figure 8a, both for biochar
biochar‐based fertilizer, the Cd2+ adsorption amounts gradually increased with the increase in Cd
and biochar-based fertilizer, the Cd2+ adsorption amounts gradually increased with the increase
concentration. The amounts adsorbed on biochar‐based fertilizer were higher than biochar. The
in Cd concentration. The amounts adsorbed on biochar-based fertilizer were higher than biochar.
obtained isotherm data were fitted and described using the Langmuir model and the Freundlich
The obtained isotherm data were fitted and described using the Langmuir model and the Freundlich
model, which are shown in Figure 8b,c, respectively. According to the obtained correlation
model, which are shown in Figure 8b,c, respectively. According to the obtained correlation coefficients,
coefficients, the Langmuir model (R2 = 0.97884 and 0.98146 for biochar and biochar‐based fertilizer,
respectively) can be used to fit the adsorption data better than the Freundlich model (R2 = 0.86798 and
0.96117 for biochar and biochar‐based fertilizer, respectively). These results indicated that the
adsorption of Cd on biochar and biochar‐based fertilizer is mainly based on a monolayer adsorption
behavior.Sustainability 2018, 10, 2740 11 of 14
the Langmuir model (R2 = 0.97884 and 0.98146 for biochar and biochar-based fertilizer, respectively)
can be used to fit the adsorption data better than the Freundlich model (R2 = 0.86798 and 0.96117 for
biochar and biochar-based fertilizer, respectively). These results indicated that the adsorption of Cd on
biochar and
Sustainability biochar-based
2018, fertilizer
10, x FOR PEER REVIEW is mainly based on a monolayer adsorption behavior. 11 of 14
Figure
Figure 8.
8. (a)
(a) Adsorption
Adsorption isotherm,
isotherm, the
the fitting
fitting Langmuir
Langmuir model
model (black),
(black), and
and the
theFreundlich
Freundlich model
model (red)
(red)
for the Cd adsorption by (b) biochar and (c) biochar‐based fertilizer.
for the Cd adsorption by (b) biochar and (c) biochar-based fertilizer.
3.7. Effects of Biochar‐Based Fertilizer on Plant Growth
3.7. Effects of Biochar-Based Fertilizer on Plant Growth
The improved crop growth was demonstrated using pot experiments. Figure 9a shows that the
The improved crop growth was demonstrated using pot experiments. Figure 9a shows that the
growth of Brassica chinensis L. in the pots with biochar‐based fertilizer was much stronger and the
growth of Brassica chinensis L. in the pots with biochar-based fertilizer was much stronger and the
foliage was greener than in the control and biochar treatments. The plants in biochar‐based fertilizer
foliage was greener than in the control and biochar treatments. The plants in biochar-based fertilizer
possessed broader leaf blades, and the color of the foliage was darker green. Data on biomass, shown
possessed broader leaf blades, and the color of the foliage was darker green. Data on biomass, shown
in Figure 9b, revealed that biochar‐based fertilizer addition increased above‐ground biomass by
in Figure 9b, revealed that biochar-based fertilizer addition increased above-ground biomass by 83.58%
83.58% over the unamended control (CK) and 87.79% over the biochar treatment. This finding
over the unamended control (CK) and 87.79% over the biochar treatment. This finding indicated
indicated that the resulting biochar‐based fertilizer has potential for improving fertilizer efficiency.
that the resulting biochar-based fertilizer has potential for improving fertilizer efficiency. Biochar has
Biochar has been shown to improve crop productivity in some but not all circumstances. In this study,
been shown to improve crop productivity in some but not all circumstances. In this study, biochar
biochar amendment had no significant improvement on cabbage growth. However, the below‐
amendment had no significant improvement on cabbage growth. However, the below-ground biomass
ground biomass in the biochar‐only treatment was 1.5–1.6 times higher than that in other treatments.
in the biochar-only treatment was 1.5–1.6 times higher than that in other treatments. A positive effect
A positive effect of biochar on root growth was also observed in pot experiments [42]. The root
of biochar on root growth was also observed in pot experiments [42]. The root stimulation effect
stimulation effect observed in these studies has frequently been ascribed to the changes in the soil
observed in these studies has frequently been ascribed to the changes in the soil physicochemical
physicochemical properties, such as pH and bulk density, that biochar could have induced. Ventura
properties, such as pH and bulk density, that biochar could have induced. Ventura et al. [43] postulated
et al. [43] postulated a stimulating effect of biochar‐derived organic compounds on plant root growth.
a stimulating effect of biochar-derived organic compounds on plant root growth. Further studies
Further studies concerning the mechanisms of biochar–UHP biochar‐based fertilizer on plant growth
concerning the mechanisms of biochar–UHP biochar-based fertilizer on plant growth and field-scale
and field‐scale experiments should be conducted.
experiments should be conducted.A positive effect of biochar on root growth was also observed in pot experiments [42]. The root
stimulation effect observed in these studies has frequently been ascribed to the changes in the soil
physicochemical properties, such as pH and bulk density, that biochar could have induced. Ventura
et al. [43] postulated a stimulating effect of biochar‐derived organic compounds on plant root growth.
Further studies concerning the mechanisms of biochar–UHP biochar‐based fertilizer on plant growth
Sustainability 2018, 10, 2740 12 of 14
and field‐scale experiments should be conducted.
Figure 9.
Figure 9. Photograph
Photograph (a)
(a) and
and Biomass
Biomass (b)
(b) of
of cabbage
cabbage (Brassica
(Brassica chinensis
chinensis L.)
L.) under
under different
different treatments.
treatments.
CK, unamended control.
CK, unamended control.
4. Conclusions
In summary, in this work we prepared a novel biochar-based fertilizer (blended with fertilizer
UHP followed by pelletization) that can simultaneously slowly release nitrogen and immobilize
Cd. The optimized formulation for biochar-based fertilizer was obtained using RSM. The minimum
cumulative release rate of granular biochar-based fertilizer was 17.63%, which was obtained through a
leaching experiment in an inert quartz sand system. The observed response was close to the predicted
value for the optimized formulation (17.66%). Morphology and component characterization showed
that UHP attached onto the porous surface of the biochar, leading to a novel biochar-based fertilizer.
The Cd adsorption onto biochar-based fertilizer reached equilibrium, with an equilibrium adsorbing
quantity of 6.3279 mg·g−1 following the pseudo-second-order model with the initial concentration of
Cd (10 mg·L−1 ). The adsorption capacity of biochar-based fertilizer toward Cd increased significantly
by 48.98% compared to that of biochar. The results from adsorption isotherms indicated that the
adsorption of Cd on biochar and biochar-based fertilizer is mainly based on a monolayer adsorption
behavior. The pot experiments showed that the resulting granular biochar-based fertilizer is beneficial
for the growth of cabbage. We think that the results in our work are of significance for the design and
development of a novel biochar-based fertilizer with high crop yield and low environmental risk.
Author Contributions: Conceived and designed the paper: G.S. and L.C. Collected and analyzed data: L.C., Q.C.,
and P.R. Wrote the paper: G.S., L.C., L.Y., and A.S.
Funding: This research was funded by the National Key Research and Development Program of China
(No. 2018YFD0800205), the SUES Sino-foreign Cooperative Innovation center for City Soil Ecological Technology
Integration (2017PT03) and First-rate Discipline Construction of Applied Chemistry of Shanghai University of
Engineering Science (No. 2018xk-B-06).
Conflicts of Interest: The authors declare no conflict of interest.
References
1. Qiao, D.L.; Liu, H.S.; Yu, L.; Bao, X.Y.; Simon, G.P.; Petinakis, E.; Chen, L. Preparation and characterization of
slow-release fertilizer encapsulated by starch-based superabsorbent polymer. Carbohydr. Polym. 2016, 147,
146–1541. [CrossRef] [PubMed]
2. Haygarth, P.M.; Jarvis, S.C. Agriculture, Hydrology and Water Quality, 1st ed.; CABI Publishing: Oxford, NY,
USA, 2002; ISBN 0-85199-545-4.
3. Qi, F.J.; Dong, Z.M.; Lamb, D.; Naidu, R.; Bolan, N.S.; Ok, Y.S.; Liu, C.; Khan, N.; Johir, M.A.H.; Semple, K.T.
Effects of acidic and neutral biochars on properties and cadmium retention of soils. Chemosphere 2017, 180,
564–573. [CrossRef] [PubMed]
4. Huang, B.; Kuo, S.; Bembenek, R. Availability of cadmium in some phosphorus fertilizers to field-grown
lattuc. Water Air Soil Pollut. 2004, 158, 37–51. [CrossRef]Sustainability 2018, 10, 2740 13 of 14
5. Su, C.; Jiang, L.Q.; Zhang, W.J. A review on heavy metal contamination in the soil worldwide: Situation,
impact and remediation techniques. Environ. Skept. Critics 2014, 3, 24–38.
6. Sohi, S.P. Carbon storage with benefits. Science 2012, 338, 1034–1035. [CrossRef] [PubMed]
7. Yousaf, B.; Liu, G.J.; Wang, R.W.; Rehman, M.Z.; Rizwan, M.S.; Imtiaz, M.; Murtaza, G.; Shakoor, A.
Investigating the potential influence of biochar and traditional organic amendments on the bioavailability
and transfer of Cd in the soil-plant system. Environ. Earth Sci. 2016, 75, 374. [CrossRef]
8. Kimetu, J.M.; Lehmann, J. Stability and stabilisation of biochar and green manure in soil with different
organic carbon contents. Aust. J. Soil Res. 2010, 48, 577–585. [CrossRef]
9. Mizuta, K.; Matsumoto, T.; Hatate, Y.; Nishihara, K.; Nakanishi, T. Removal of nitrate nitrogen from drinking
water using bamboo powder charcoal. Bioresour. Technol. 2004, 95, 255–257. [CrossRef] [PubMed]
10. Asai, H.; Samson, B.K.; Stephan, H.M.; Songyikhangsuthor, K.; Homma, K.; Kiyono, Y.; Inoue, Y.; Shiraiwa, T.;
Horie, T. Biochar amendment techniques for upland rice production in Northern Laos: 1. Soil physical
properties, leaf SPAD and grain yield. Field Crop. Res. 2009, 111, 81–84. [CrossRef]
11. Si, L.; Xie, Y.; Ma, Q.; Wu, L. The Short-Term Effects of Rice Straw Biochar, Nitrogen and Phosphorus
Fertilizer on Rice Yield and Soil Properties in a Cold Waterlogged Paddy Field. Sustainability 2018, 10, 537.
[CrossRef]
12. Zhao, L.; Cao, X.; Zheng, W.; Scott, J.W.; Sharma, B.K.; Chen, X. Copyrolysis of Biomass with Phosphate
Fertilizers to Improve Biochar Carbon Retention, Slow Nutrient Release, and Stabilize Heavy Metals in Soil.
ACS Sustain. Chem. Eng. 2016, 4, 1630–1636. [CrossRef]
13. Chen, P.; Sun, M.X.; Zhu, Z.X.; Zhang, J.D.; Shen, G.Q. Optimization of ultrasonic-assisted extraction for
determination of polycyclic aromatic hydrocarbons in biochar-based fertilizer by gas chromatography-mass
spectrometry. Anal. Bioanal. Chem. 2015, 407, 6149–6157. [CrossRef]
14. Khan, M.A.; Kim, K.K.; Wang, M.Z.; Lim, B.K.; Lee, W.H.; Lee, J.Y. Nutrient-impregnated charcoal:
An environmentally friendly slow-release fertilizer. Environmentalist 2008, 28, 231–235. [CrossRef]
15. Lee, J.W.; Hawkins, B.; Li, X.N.; Day, D.M. Biochar fertilizer for soil amendment and carbon sequestration.
In Advanced Biofuels and Bioproducts; Springer: New York, NY, USA, 2013; pp. 57–68.
16. Hagemann, N.; Kammann, C.I.; Schmidt, H.P.; Kappler, A.; Behrens, S. Nitrate capture and slow release in
biochar amended compost and soil. PLoS ONE 2017, 12, e0171214. [CrossRef] [PubMed]
17. Day, D.; Evans, R.J.; Lee, J.W.; Reicosky, D. Valuable and stable carbon co-product from fossil fuel exhaust
scrubbing. Prepr. Pap. Am. Chem. Soc. Div. Fuel Chem. 2004, 49, 352–355.
18. Agegnehu, G.; Bass, A.M.; Nelson, P.N.; Bird, M.I. Benefits of biochar, compost and biochar-compost for soil
quality, maize yield and greenhouse gas emissions in a tropical agricultural soil. Sci. Total Environ. 2016, 543,
295–306. [CrossRef] [PubMed]
19. Gao, H.Y.; He, X.S.; Chen, X.X. Effect of biochar and biochar-based ammonium nitrate fertilizers on soil
chemical properties and crop yield. J. Agro-Environ. Sci. 2012, 31, 1948–1955.
20. Li, Y.; Sun, Y.; Liao, S.; Zou, G.; Zhao, T.; Chen, Y.; Yang, J.; Zhang, L. Effects of two slow-release
nitrogen fertilizers and irrigation on yield, quality, and water-fertilizer productivity of greenhouse tomato.
Agric. Water Manag. 2017, 186, 139–146. [CrossRef]
21. Frankenberger, W.T. Factors Affecting the Fate of Urea Peroxide Added to Soil. Bull. Environ. Contam. Toxicol.
1997, 59, 50–57.
22. Schwab, C.V.; Hanna, H.M. Master Gardeners’ Safety Precautions for Handling, Applying, and Storing Biochar;
Agricultural and Biosystems Engineering Extension and Outreach Publications: Ames, IA, USA, 2012; p. 5.
23. Husk, B.; Major, J. Commercial Scale Agricultural Biochar Field Trial in Québec, Canada over Two Years: Effects of
Biochar on Soil Fertility, Biology and Crop Productivity and Quality; Blue Leaf Inc.: Quebec, QC, Canada, 2010.
24. Major, J.; Lehmann, J.; Rondon, M.; Goodale, C. Fate of soil-applied black carbon: Downward migration,
leaching and soil respiration. Glob. Chang. Biol. 2010, 16, 1366–1379. [CrossRef]
25. Reza, M.T.; Lynam, J.G.; Vasquez, V.R.; Coronella, C.J. Pelletization of biochar from hydrothermally
carbonized wood. Environ. Prog. Sustain. Energy 2012, 31, 225–234. [CrossRef]
26. Chen, S.L.; Yang, M.; Ba, C.; Yu, S.S.; Jiang, Y.F.; Zou, H.T.; Zhang, Y. Preparation and characterization of
slow-release fertilizer encapsulated by biochar-based waterborne copolymers. Sci. Total Environ. 2018, 615,
431–437. [CrossRef]
27. Bezarra, M.A.; Santelli, R.E.; Oliveira, E.P.; Villar, L.S.; Escaleira, L.A. Response surface methodology (RSM)
as a tool for optimization in analytical chemistry. Talanta 2008, 76, 965–977. [CrossRef] [PubMed]Sustainability 2018, 10, 2740 14 of 14
28. Ge, Y.; Ge, M. Development of tea tree oil-loaded liposomal formulation using response surface methodology.
J. Liposome Res. 2015, 25, 222–231. [CrossRef] [PubMed]
29. Perrin, T.S.; Boettinger, J.L.; Drost, D.T.; Norton, J.M. Decreasing Nitrogen Leaching from Sandy Soil with
Ammonium-Loaded Clinoptilolite. J. Environ. Qual. 1998, 27, 656–663. [CrossRef]
30. Mukherjee, A.; Zimmerman, A.R. Organic carbon and nutrient release from a range of laboratory-produced
biochars and biochar-soil mixtures. Geoderma 2012, 193–194, 122–130. [CrossRef]
31. Akinremi, O.O.; Cho, C.M. Phosphate and accompanying cation transport in a calcareous cation-exchange
resin system. Soil Sci. Soc. Am. J. 1991, 55, 959–964. [CrossRef]
32. Hussain, I.; Mahmood, Z.; Yasmeen, R.; Jahangir, M.; Hammed, R.; Nasir, R. Assay of urea with
p-dimethylaminobenzaldehyde. J. Chem. Soc. Pak. 2002, 24, 122–128.
33. Jiang, E.; Zhang, W.; Qing, L.; Wang, M.; Luo, L. Study on preparation of granular biochar-based urea and
property. J. Northeast Agric. Univ. 2014, 45, 89–94.
34. Ding, Y.; Liu, Y.X.; Wu, W.X.; Shi, D.Z.; Yang, M.; Zhong, Z.K. Evaluation of biochar effects on nitrogen
retention and leaching in multi-layered soil columns. Water Air Soil Pollut. 2010, 213, 47–55. [CrossRef]
35. Spokas, K.A. Review of the stability of biochar in soils: Predictabity of O: C molar ratios. Carbon Manag.
2010, 1, 289–303. [CrossRef]
36. Yenisoy-Karakaş, S.; Aygün, A.; Güneş, M.; Tahtasakal, E. Physical and chemical characteristics of
polymer-based spherical activated carbon and its ability to adsorb organics. Carbon 2004, 42, 477–484.
[CrossRef]
37. Byler, D.M.; Susi, H. Examination of the secondary structure of proteins by deconvolved FTIR spectra.
Biopolymers 1986, 25, 469–487. [CrossRef] [PubMed]
38. Liu, P.; Jiang, R.; Zhou, W.; Zhu, H.; Xiao, W.; Wang, D.; Mao, X. g-C3N4 Modified biochar as an adsorptive
and photocatalytic material for decontamination of aqueous organic pollutants. Appl. Surf. Sci. 2015, 358,
231–239.
39. Song, X.L.; Liu, H.Y.; Cheng, L.; Qu, Y.X. Surface modification of coconut-based activated carbon by
liquid-phase oxidation and its effects on lead ion adsorption. Desalination 2010, 255, 78–83. [CrossRef]
40. Kılıc, M.; Kırbıyık, C.; Çepelioğullar, Ö.; Pütün, A.E. Adsorption of heavy metal ions from aqueous solutions
by bio-char, a by-product of pyrolysis. Appl. Surf. Sci. 2013, 283, 856–862. [CrossRef]
41. Bhatnagar, A.; Hogland, W.; Marques, M.; Sillanpää, M. An overview of the modification methods of
activated carbon for its water treatment applications. Chem. Eng. J. 2013, 219, 499–511. [CrossRef]
42. Prendergast-Miller, M.T.; Duvall, M.; Sohi, S.P. Localisation of nitrate in the rhizosphere of biochar-amended
soils. Soil Biol. Biochem. 2011, 43, 2243–2246. [CrossRef]
43. Ventura, M.; Zhang, C.; Baldi, E.; Fornasier, F.; Sorrenti, G.; Panzacchi, P.; Tonon, G. Effect of biochar addition
on soil respiration partitioning and root dynamics in an apple orchard. Eur. J. Soil Sci. 2014, 65, 186–195.
[CrossRef]
© 2018 by the authors. Licensee MDPI, Basel, Switzerland. This article is an open access
article distributed under the terms and conditions of the Creative Commons Attribution
(CC BY) license (http://creativecommons.org/licenses/by/4.0/).You can also read