Effect of Bioactive Glass-Containing Light-Curing Varnish on Enamel Remineralization
←
→
Page content transcription
If your browser does not render page correctly, please read the page content below
materials
Article
Effect of Bioactive Glass-Containing Light-Curing Varnish on
Enamel Remineralization
Hyun-Jung Kim 1 , So-Yeon Mo 2 and Duck-Su Kim 3, *

                                          1   Department of Conservative Dentistry, Kyung Hee University Dental Hospital, Seoul 02447, Korea;
                                              kimhyunjung@khu.ac.kr
                                          2   Department of Conservative Dentistry, Graduate School, Kyung Hee University, Seoul 02447, Korea;
                                              iammosso@hanmail.net
                                          3   Department of Conservative Dentistry, School of Dentistry, Kyung Hee University, Seoul 02447, Korea
                                          *   Correspondence: dentist96@khu.ac.kr

                                          Abstract: This study aimed to evaluate the effect of novel experimental light-curing bioactive glass
                                          (BAG)-containing varnish on enamel remineralization. An experimental light-curing, BAG-containing
                                          varnish and two commercial varnishes (Nupro White Varnish; Dentsply International, York, PA, USA
                                          and Tooth Mousse; GC Corporation, Tokyo, Japan) were used. Microhardness tests (n = 3), field
                                          emission scanning electron microscopy (FE-SEM) coupled with energy dispersive X-ray spectroscopy
                                          (EDS) (n = 5), and X-ray diffraction (XRD) analysis (n = 5) were performed to compare the remineral-
                                          ization effect of three varnishes with and without ultrasonication. The data of microhardness test
                                          were analyzed using one-way ANOVA and Tukey’s post hoc comparison (P < 0.05). Microhardness of
                                          demineralized enamel increased after the application of three varnishes (P < 0.05). The experimental
                                          BAG-containing varnish showed the highest microhardness among the three varnishes (P < 0.05).

                                   Ultrasonication decreased microhardness of Tooth Mousse and BAG-containing varnish groups
                                          (P < 0.05). FE-SEM and XRD revealed precipitates of hydroxyapatite (HAP) or fluorapatite (FAP)
Citation: Kim, H.-J.; Mo, S.-Y.; Kim,
D.-S. Effect of Bioactive Glass-
                                          crystals of three varnishes. The novel experimental BAG-containing varnish may be a promising
Containing Light-Curing Varnish on        clinical strategy for the remineralization of early carious lesions or demineralized enamel surfaces.
Enamel Remineralization. Materials
2021, 14, 3745. https://doi.org/          Keywords: enamel remineralization; varnish; bioactive glass; light-curing varnish; BAG varnish;
10.3390/ma14133745                        dental materials; biomaterials

Academic Editors: Dohyun Kim,
Sung-Ho Park and Yooseok Shin
                                          1. Introduction
Received: 24 May 2021
                                               Enamel is the most mineralized tissue in the body, consisting of 95% (wt/wt) minerals,
Accepted: 29 June 2021
                                          4% (wt/wt) water, and 1% (wt/wt) organic material [1]. The inorganic content of enamel is
Published: 4 July 2021
                                          composed of biological hydroxyapatite (HAP) crystals, Ca10 (PO4 )6 (OH)2 , and its rods are
                                          arranged into a highly organized prism [2,3]. Enamel has a higher inorganic content (~90%)
Publisher’s Note: MDPI stays neutral
                                          than dentin, bone (~70%), and cementum (45%). With high inorganic content, the enamel is
with regard to jurisdictional claims in
                                          tougher and more resistant to force than any other hard tissue in the body. In a healthy oral
published maps and institutional affil-
                                          environment, there is an equilibrium between demineralization and remineralization of
iations.
                                          tooth structure. A pronounced demineralization process could cause an initial pathologic
                                          change, ultimately leading to destruction of the tooth structure. This can be caused by
                                          local cariogenic bacteria in plaque (caries), non-bacterially derived erosive challenges (such
                                          as acidic beverages), or mechanical force [2]. Hard tissues in the body have different
Copyright: © 2021 by the authors.
                                          regeneration capabilities, except enamel, which shows no further biological activity [4].
Licensee MDPI, Basel, Switzerland.
                                               However, since enamel regeneration is particularly challenging, remineralization, as
This article is an open access article
                                          a natural repair process, can only result in net mineral gain in demineralized lesions [5].
distributed under the terms and
                                          The remineralization process is usually regulated by saliva, remineralization solutions,
conditions of the Creative Commons
Attribution (CC BY) license (https://
                                          or agents. Topical application of fluoride has long been practiced to arrest and rem-
creativecommons.org/licenses/by/
                                          ineralize initial or advanced demineralized enamel lesions [6]. It aids remineralization
4.0/).

Materials 2021, 14, 3745. https://doi.org/10.3390/ma14133745                                               https://www.mdpi.com/journal/materials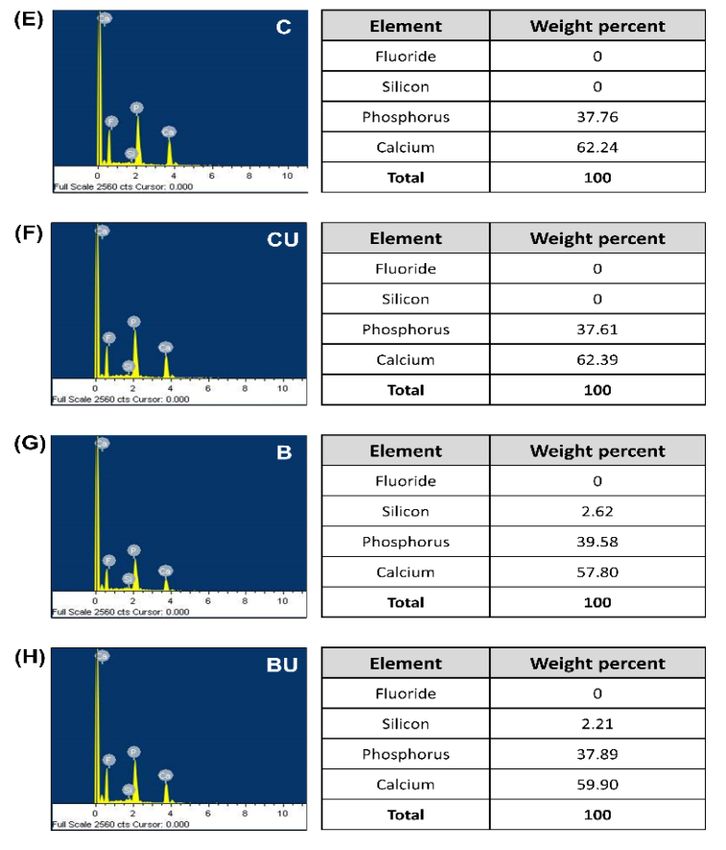
Materials 2021, 14, 3745                                                                                          2 of 13

                           by forming fluorapatite (FAP) crystals on the enamel surface [7]. It has been incorpo-
                           rated in varnishes, gels, toothpastes, mouthwash, and other dental restorative materials.
                           Casein-phosphopeptides (CPPs) with amorphous calcium phosphate (ACP) are the main
                           components of commercially available anti-cariogenic agents [8]. CPP-ACP is based on
                           milk-derived proteins and promotes remineralization of carious lesions by maintaining a
                           supersaturated state of the enamel mineral [9]. In addition to these remineralization agents,
                           various nanoparticles, such as silver, zinc oxide, titanium oxide, quaternary ammonium
                           salt polyethylenimine nanoparticles, and nano-fluorapatite, have been studied for the
                           prevention of early caries or enamel demineralization [10–12].
                                Bioactive glass (BAG) is a remineralization agent developed by Larry Hench in 1969.
                           BAG has appealing characteristics as a scaffold material for bone tissue engineering [13]. It
                           binds both soft and hard tissues and stimulates tissue mineralization owing to its superior
                           bioactivity [14]. It has been adopted for medical use, such as for bone regeneration, and
                           recent research has focused on its use in dental applications [15,16]. Several previous
                           studies have indicated that BAG can remineralize enamel [17] and dentin [16] and has
                           antimicrobial effect on oral bacteria [18].
                                Many studies have been conducted on BAG-containing experimental products in
                           dentistry. BAG-containing dentin adhesive increases the nano-mechanical properties of
                           demineralized dentin [19]. BAG releases calcium and fluoride ions when added to resin
                           as a filler [20] and exhibits antibacterial activity [21] while maintaining the mechanical
                           properties of the composite resin [22]. Placement of BAG-containing composites in close
                           proximity to demineralized dentin can aid in remineralization [23]. In addition, BAG
                           application can enhance the adhesion of resin-modified glass ionomers [24] and precipitate
                           FAP crystals at the interface between demineralized dentin and BAG-incorporated GIC [25].
                           These studies indicate that presence of BAG in dental materials induces remineralization
                           of the enamel and dentin without hampering its bioactivity [19,22,23].
                                Considering these bioactivities of BAG, it is assumed that it can be incorporated into
                           the enamel varnish. Because most commercial varnishes applied on the enamel surface are
                           easily removed by water rinsing, eating, or tooth brushing, more substantivity is necessary.
                           Thus, a light-curable BAG-containing varnish was experimentally manufactured for this
                           purpose. Light-cured varnish is advantageous because retention on the tooth surface is an
                           important factor in delivering effective factors for remineralization of hard tissue [26].
                                The purpose of this study was to evaluate the effect of a novel experimental light-
                           curing BAG varnish on enamel remineralization and to compare its efficacy with that
                           of commercially available fluoride varnish and CPP-ACP varnish. In this study, micro-
                           hardness, field emission scanning electron microscopy (FE-SEM) coupled with energy
                           dispersive X-ray spectroscopy (EDS), and X-ray diffraction (XRD) were used for analysis.

                           2. Materials and Methods
                           2.1. Enamel Specimen Preparation and Experimental Materials
                                The study protocol was approved by the Institutional Review Board of the Kyung Hee
                           University Dental Hospital (KHD IRB 1902-1). One hundred and four caries-free extracted
                           human third molars were obtained for the preparation of enamel specimens. Enamel
                           specimens (3.0 × 3.0 × 2.0 mm3 ) were fabricated using a high-speed saw (IsoMet 5000
                           Precision Saw; Buehler, Lake Bluff, IL, USA). The top surface of the specimen was ground
                           using a fine diamond bur to obtain a flat enamel surface, which was then serially polished
                           with 320, 400, 600, 800, 1200, and 1500-grit silicon carbide (SiC) paper. Phosphoric acid
                           etchant, at 37% concentration (ETCH-37™; BISCO, Schaumburg, IL, USA), was applied to
                           the enamel surfaces for 20 min to form a demineralized lesion, excluding the specimens
                           assigned to the positive control group (undemineralized enamel).
                                Three varnishes were used in this study: (1) Nupro White Varnish (Dentsply Interna-
                           tional, York, PA, USA), a fluoride-based enamel remineralization agent; (2) Tooth Mousse
                           (GC Corporation Tokyo, Japan), a CPP-ACP-based agent; and (3) novel BAG-containing
                           experimental varnish. For the preparation of experimental BAG-containing varnish, BAG
Materials 2021, 14, 3745 3 of 13
63S (Bonding Chemical, Katy, TX, USA) was selected as the active component. It was
developed using the sol-gel method with particle size less than 20 µm. The composition of
these materials is listed in Table 1.
Table 1. List of varnishes used in this study.
Materials Composition Applications
Urethane Dimethacrylate Resin 30–40 wt%
Fluoride varnish
2-Propanol 20–30 wt%
(Nupro White; Dentsply Apply once (2 h)
Sodium Fluoride 5 wt%
international, York, PA, USA)
Titanium DioxideMaterials 2021, 14, 3745 4 of 13
Table 2. Protocol for each experimental group.
Groups Description Procedures
Positive control
Group P Untreated
(Undemineralized enamel)
Negative control
Materials 2021, 14, 3745 Group N Demineralization (37% phosphoric acid, 20 min)
4 of 14
(Demineralized enamel)
Demineralization (37% phosphoric acid, 20 min)
Group F Nupro White Varnish → Nupro White Varnish application (once, 2 h)
→ Storage
→ Storage (artificial
(artificial saliva, 2saliva,
weeks) 2 weeks)
Demineralization (37% phosphoric acid, 20 min)
Demineralization (37% phosphoric acid, 20 min)
Nupro White Varnish → Nupro White Varnish application (once, 2 h)
Group FU Nupro White Varnish → Nupro White Varnish application (once, 2 h)
Group FU + Ultrasonication → Storage (artificial saliva, 2 weeks)
+ Ultrasonication → Storage (artificial saliva,(32 min)
→ Ultrasonication weeks)
→ Ultrasonication (3 min)
Demineralization (37% phosphoric acid, 20 min)
→ Tooth mousse
Demineralization (37% phosphoric
applicationacid,
(for 720days,
min)30 min
Group C Tooth mousse
Group C Tooth mousse → Tooth mousse application (for 7 days, 30 min per day)
per day)
→ Storage
→ Storage (artificial
(artificial saliva, 2saliva,
weeks) 2 weeks)
Demineralization (37% phosphoric acid, 20 min)
Demineralization (37% phosphoric acid, 20 min)
→ Tooth mousse application (for 7 days, 30 min
Tooth
Tooth mousse
mousse → Tooth mousse application (for 7 days, 30 min per day)
Group
GroupCU
CU per day)
+ Ultrasonication
+ Ultrasonication → Storage (artificial saliva, 2saliva,
weeks)
→ Storage (artificial 2 weeks)
→ Ultrasonication (3 min)
→ Ultrasonication (3 min)
Demineralization (37% phosphoric
Demineralization acid, 20acid,
(37% phosphoric min)20 min)
GroupBB BAG-containing varnish → BAG → BAG varnish
varnish application
application (indirectly,
(indirectly, light light 20 s)
curing
Group BAG-containing varnish
curing
→ Storage 20 s) saliva, 2 weeks)
(artificial
→ Storage (artificial saliva, 2 weeks)
Demineralization (37% phosphoric acid, 20 min)
Demineralization (37% phosphoric acid, 20 min)
BAG-containing varnish → BAG varnish application (indirectly, light curing 20 s)
Group BU → BAG varnish application (indirectly, light
BAG-containing varnish → Storage (artificial saliva, 2 weeks)
Group BU + Ultrasonication curing 20 s)
+ Ultrasonication → Ultrasonication (3 min) saliva, 2 weeks)
→ Storage (artificial
→ Ultrasonication (3 min)
Figure 1. Classification of experimental groups and analysis methods.
Figure 1. Classification of experimental groups and analysis methods.
Nupro White Varnish and Tooth Mousse were applied according to the manufac-
turer’s instructions (Table 1). The BAG-containing varnish was applied indirectly to the
teeth because its removal could affect the remineralized enamel surface [23,25]. For indi-
rect application of experimental varnish, blocks of composite resin (Any-Com; MEDI-
CLUS, Cheongju, Korea) with dimensions of 6.0 × 6.0 × 4.0 mm3 were prepared as the BAGMaterials 2021, 14, 3745 5 of 13
2.3. Microhardness Test
Three specimens from each experimental group were rinsed thoroughly with deion-
ized water and were air-dried at room temperature. The microhardness of the enamel
surface was measured using a VHN with a microhardness tester (HMV-2, Shimadzu Co.,
Kyoto, Japan) at 300 g for 5 s. The VHN was obtained using the following equation:
VHN = 1854.4 P/d2 , where P is the applied load in grams and d is the average length of
the indentation measured in millimeters [6]. The VHN was measured at 20 different points
of each specimen, and each measured point was at a constant distance from each other.
2.4. FE-SEM/EDS Analysis
Five specimens were used for the FE-SEM analysis in each experimental group. All
specimens were stored in 20, 50, 75, 95, and 100% ethanol for 20, 20, 20, 30, and 60 min,
respectively, for complete dehydration, and then air-dried at room temperature. The
specimens were gold-sputtered and analyzed using FE-SEM (S-4700; Hitachi, Tokyo, Japan)
at 10 kV. The same specimens were prepared for the detection of calcium, phosphorus,
fluorine, and silicon using EDS analysis.
2.5. XRD Analysis
Five specimens were examined using an X-ray diffractometer (D8 advance; Bruker
AXS, Karlsruhe, Germany) with Cu Kα radiation at 40 kV and 100 mA using a Ni filter.
The diffraction intensities were measured by scanning in the range of 2θ (i.e., 20–60◦ in
0.01◦ steps for 0.1 s per step).
2.6. Statistical Analysis
The results of the microhardness tests of all experimental groups were analyzed by
one-way ANOVA to reveal significant differences between the groups. Tukey’s test was
used for post hoc comparisons. The level of significance was set at P = 0.05. All statistical
analyses were performed using SPSS 23.0.0.0 (IBM Corp., Armonk, NY, USA).
Materials 2021, 14, 3745 6 of 14
3. Results
3.1. Microhardness Test
The microhardness values of all experimental groups are shown in Figure 2.
Figure 2. Results of the microhardness test. (n = 20). The unmineralized positive control (Group P)
exhibited
Figure the highest
2. Results of theVickers harnesstest.
microhardness number (VHN)
(n=20). and Group N positive
The unmineralized the lowest. The(Group
control VHN of P)all three
exhibited the highest
varnish groups was Vickers
greaterharness number
than that (VHN)
of Group N. and Group
Among theNthree
the lowest. The
varnish VHN ofGroup
groups, all three
B showed
varnish groups was greater than that of Group N. Among the three varnish groups, Group B showed
the highest VHN, followed by groups C and F. The asterisk (*) indicates statistically significant
the highest VHN, followed by groups C and F. The asterisk (*) indicates statistically significant dif-
differences between groups (P < 0.05).
ferences between groups (P < 0.05)
Group P had the highest Vickers hardness number (VHN) among all experimental
groups (P < 0.05), and Group N the lowest (P < 0.05). Groups F, C, and B had a higher
VHN than Group N (P < 0.05). Group B had the highest VHN, followed by Groups C andMaterials 2021, 14, 3745 6 of 13
Group P had the highest Vickers hardness number (VHN) among all experimental
groups (P < 0.05), and Group N the lowest (P < 0.05). Groups F, C, and B had a higher
VHN than Group N (P < 0.05). Group B had the highest VHN, followed by Groups C
and F, among the three varnish groups. The differences among Groups F, C, and B were
significant (P < 0.05).
The VHNs of Groups FU, CU, and BU were slightly lower than those of Groups F,
C, and B, respectively, but higher than the VHN of Group N (P < 0.05). The difference in
the VHN of Groups F and FU was not significant (P > 0.05), but the differences between
Groups C and CU and between Groups B and BU were significant (P < 0.05). The VHN of
Groups CU and BU was significantly different than that of Group FU (P < 0.05).
Materials 2021, 14, 3745 3.2. FE-SEM/EDS Analysis 7 of 14
Representative FE-SEM images are shown in Figure 3.
Figure
Figure 3. Representative
3. Representative FE-SEMFE-SEM
images ofimages of all the experimental
all the experimental groups.
groups. (A) Group P, (B)(A) Group
Group N, P, (B) Group N,
(C)(C) Group
Group F,Group
F, (D) (D) Group
FU, (E)FU, (E)C,Group
Group C, (F)
(F) Group CU,Group CU,B,(G)
(G) Group andGroup
(H) GroupB, and (H) Group BU. Exposed
BU. Exposed
enamel rodsrods
enamel in Group N wereNcovered
in Group with precipitates
were covered after the application
with precipitates after theof application
three varnishesofwith
three varnishes with
or without ultrasonication.
or without ultrasonication.
An enamel surface covered with a smear layer was observed in Group P (Figure 3A).
After the enamel surface was demineralized, eroded enamel rods were observed in group
N (Figure 3B). When each varnish was applied (Groups F, C, and B), demineralized
enamel surfaces were covered with amorphous precipitates (Figure 3C,E,G). The mor-
phology was similar to that seen in Group P. On performing ultrasonication (Groups FU,Materials 2021, 14, 3745 7 of 13
An enamel surface covered with a smear layer was observed in Group P (Figure 3A).
After the enamel surface was demineralized, eroded enamel rods were observed in group
Materials 2021, 14, 3745 N (Figure 3B). When each varnish was applied (Groups F, C, and B), demineralized 8 of 14enamel
surfaces were covered with amorphous precipitates (Figure 3C,E,G). The morphology was
similar to that seen in Group P. On performing ultrasonication (Groups FU, CU, and BU),
a slight
CU, and loss
BU), of theseloss
a slight precipitates was observed,
of these precipitates while most
was observed, precipitates
while remained
most precipitates re- on the
enamel on
mained surface (Figure
the enamel 3D,F,H).
surface The 3D,F,H).
(Figure results ofThe
theresults
EDS analysis foranalysis
of the EDS all experimental
for all ex- groups
are shown groups
perimental in Figure
are4.
shown in Figure 4.
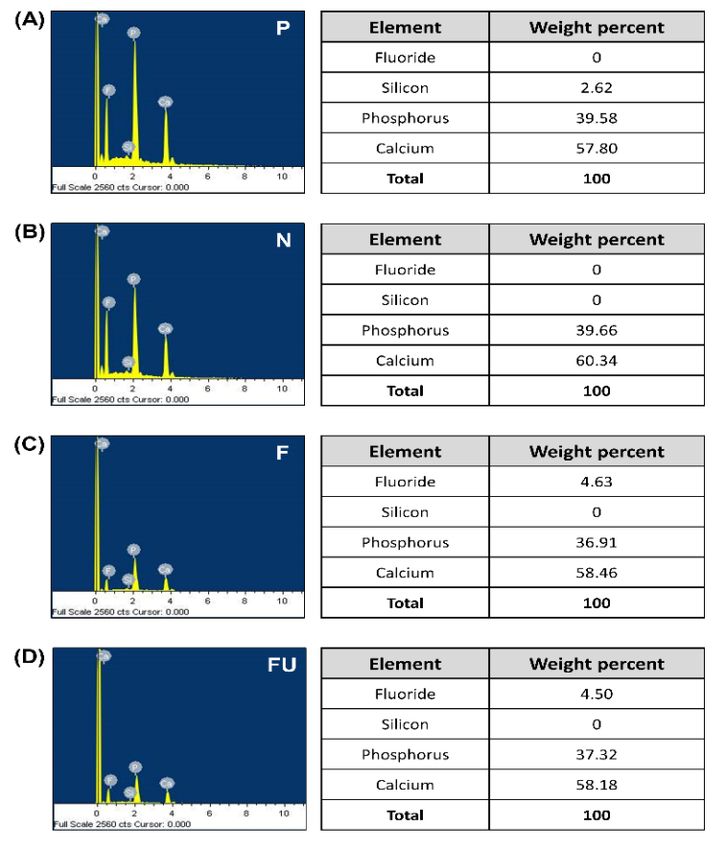
Resultsofof
Figure4.4.Results
Figure EDS
EDS analysis.
analysis. (A) (A) Group
Group P, (B)P,Group
(B) Group
N, (C)N, (C) Group
Group F, (D) Group
F, (D) Group FU, (E) FU, (E) Group
Group
C, (F)
C, (F)Group
GroupCU,
CU,(G)(G) Group
Group B, B,
and and
(H)(H) Group
Group BU. BU. Calcium
Calcium and phosphorus
and phosphorus ionsdetected
ions were were detected
in in
Group F and FU, and silica ion was in Group B and
Group F and FU, and silica ion was in Group B and BU. BU.Materials 2021, 14, 3745 9 of 14
Materials 2021, 14, 3745 8 of 13
Chemical characterization revealed that the phosphorus and calcium content was
Chemical
similar characterization
in all experimental groups.revealed
The Ca/P that thewas
ratio phosphorus
1.4–1.6 inand calcium content
all experimental was
groups,
similar in all experimental groups. The Ca/P ratio was 1.4–1.6 in
similar to that of HAP. Calcium and phosphorus ions were the main components in all experimental groups,
similar to
Groups that N
P and of (Figure
HAP. Calcium and Groups
4A,B) [28]. phosphorusF andions
FUwere the 4C,
(Figure mainD)components
showed thein Groups
presence
P and N (Figure 4A,B) [28]. Groups F and FU (Figure 4C,D) showed the presence
of fluoride. Groups C and CU (Figure 4E,F) had a similar composition as that of the control of fluoride.
Groupswith
groups, C and noCU (Figure
presence of4E,F) hadora silicon.
fluoride similar Groups
composition
B andasBUthat of the4G,H)
(Figure control groups,
contained
with no
silicon presence
(2.62 of fluoride
and 2.21%, or silicon.
respectively) Groups Btoand
in addition BU (Figure
calcium 4G,H) contained silicon
and phosphorus.
(2.62 and 2.21%, respectively) in addition to calcium and phosphorus.
3.3. XRD Analysis
3.3. XRD Analysis
The results of the XRD analysis of all experimental groups are shown in Figure 5.
The results of the XRD analysis of all experimental groups are shown in Figure 5.
Figure 5. Results of XRD analysis. (A) Group P, (B) Group N, (C) Group F, (D) Group FU, (E) Group
Figure 5. Results
C, (F) Group CU,of XRD
(G) analysis.
Group B, (H)(A)
andGroup
GroupP,BU.
(B) The
Group N, (C)ofGroup
decrease F, (D) [26
HAP peaks ◦ of (002)
Group FU, (E) Group
reflection
C, (F) Group ◦ CU, (G) Group B, (H) and Group BU. The decrease of HAP peaks [26° of (002) reflection
and at 31.8 of (211) reflection] in Group N was obvious. It increased after the application of three
and at 31.8°
varnishes of (211)
with reflection]
or without in Group N was obvious. It increased after the application of three
ultrasonication.
varnishes with or without ultrasonication.
Group P showed intense peaks at approximately 26◦ of (002) reflection and at 31.8◦
Group P showed
of (211) reflection intense
(Figure peaks
5A). at peaks
These approximately 26° of (002)
are representative of reflection and at
HAP crystals 31.8°
[29–31].
of
The(211) reflection
intensity (Figure
of these 5A). These
peaks peaks are
was reduced inrepresentative of HAP
Group N (Figure 5B).crystals [29–31].
The peak The
intensityMaterials 2021, 14, 3745 9 of 13
increased after the application of varnishes (Figure 5C,E,G) and slightly decreased after
ultrasonication, except for Group FU (Figure 5D,F,H).
4. Discussion
Remineralization of early carious lesions is naturally achieved by salivary ions or
pH [32] and can be accelerated by adjunctive remineralizing agents [33]. Among them,
fluoride-based agents are the most widely used and have the highest level of support-
ing evidence [34,35]. Although fluoride has a high affinity for HAP crystals, it has the
disadvantage of forming FAP crystals only on the superficial layer because of its low
penetration ability [36]. In addition, careless handling of fluoride can cause side effects,
such as fluorosis [37]. At the population level, the effect of fluoride on prevention of
dental caries has plateaued [38]. A significant remineralizing effect has been observed
with CPP-ACP [8,39,40]; however, reviews have raised concerns about the excessive use of
short-term in situ models, which have limited clinical reliability [33,41]. Additionally, most
studies have been conducted on orthodontics-related incipient lesions, thus limiting the
generalizability of the results to other carious lesions [33]. Consequently, the development
of new agents has been attempted to overcome these limitations.
BAG can react with saliva, inducing the release of Ca2+ , PO4 3− , and Si4+ at the glass
surface, and the subsequent precipitation of a polycondensated silica-rich layer serves as a
template for the formation of calcium phosphate [42]. As the reaction and the deposition of
Ca-P complexes continue, this layer crystallizes into hydroxycarbonate apatite, which is
chemically and structurally similar to biological apatite. BAG was originally developed as
a bone-regenerative material and has recently found use in oral care products, such as in
toothpastes and mouth-rinses [43].
However, the application of BAG as a remineralization agent has been limited, ow-
ing to its relatively long reaction time. According to Hench, the release of calcium and
phosphate ions from BAG requires at least 2 h [31]. Moreover, newly formed calcium and
phosphate compounds from BAG were detectable after 24 h [44]. Originally, BAG was pre-
pared by the melt-quenching method, and its particle size was considerably large. Because
of the large particle size, it was not easy to incorporate BAG into dental materials. Thus,
the sol-gel method was developed to prepare BAG to reduce the particle size and increase
bioactivity [45]. It is known that BAG made by the sol-gel method has higher porosity
levels and a larger surface area than BAG made by the melt-quenching method [46]. These
porous structures can increase the bioactivity of BAG [47]. Based on these results, the BAG
used in this study was prepared using the sol-gel method, to enhance bioactivity.
Numerous studies have been conducted on the enamel remineralization effect of BAG.
The 45S5 BAG paste reportedly improved the microhardness of the subsurface eroded
enamel surface [6]. Application of BAG paste to incipient enamel erosive lesions was seen to
restore lesions with an abrasion durable layer of HAP [48]. BAG-containing toothpaste had
a greater effect on the remineralization of carious-like lesions in permanent teeth compared
to that of fluoride-containing toothpaste [49]. In addition, BAG showed remineralization of
caries in primary teeth similar to that by 500 ppm fluoride toothpaste and CPP-ACP [50].
As reported in previous studies, BAG is mostly used as a paste. Unfortunately, this form
does not have sufficient substantivity on the enamel surface. Therefore, to increase the
application time, a light-curing BAG-containing varnish was designed and used in this
study. In a previous study of a light-curable fluoride varnish, it was suggested that the
varnish can provide protection for up to 4 months or even longer [26]. Longer retention
of varnish might enable a decrease in the frequency of application and maximize the
remineralizing effect with a single application in clinics. To the best of our knowledge, a
light-curing BAG varnish has not yet been developed and reported in dentistry, although
experimental BAG varnish without a curing procedure has been introduced [51]. In a
previous study, the experimental BAG varnish showed that BAG formed apatite at 0, 3, 6,
24, 72, and 168 h of immersion. The longer it was immersed, the more ion release of theMaterials 2021, 14, 3745 10 of 13
BAG-incorporated varnish was reported with more dissolution of Ca2+ , Sr2+ , PO4 3− , and
F− [51].
In this study, we confirmed that the experimental BAG varnish regained the highest
microhardness after demineralization compared to the other experimental groups (Groups
F and C) (Figure 1). The microhardness of remineralized groups (Groups F, C, and B)
was significantly lower than that of the positive control (Group P) but higher than that
of the complete mineralized negative control (Group N). Ultrasonication decreased the
microhardness of the remineralized groups, except that of Group F (P < 0.05), but not the
microhardness of the negative control (Group N). The VHN was measured at 20 different
points on each specimen, and each measured point was at a constant distance from each
other. This was to control the variation of tooth substrate, so that 20 measurements were
conducted in one specimen; conclusively, 60 VHN results were acquired in each group.
FE-SEM analysis revealed amorphous precipitate deposition on the enamel surface,
except in the control groups (Groups P and N) (Figure 3). XRD analysis showed representa-
tive peaks at approximately 26◦ of (0 0 2) reflection and 31.8◦ of (2 1 1) reflection, which
indicates HAP crystals in all the experimental groups except Group N (Figure 5) [29–31].
HAP and FAP have similar diffraction patterns and are known to be difficult to identify
through XRD data because their lattice parameters are very close and structurally sim-
ilar [52]. However, in Groups F and FU, it was assumed that both peaks represented
FAP. Formation of FAP is preferred over the production of HAP in a fluoride-containing
environment because FAP is chemically more stable and shows less dissolution at low
pH [12,53]. EDS spectra confirmed the presence of fluoride in Groups F and FU, but not in
the other groups (Figure 4). Based on these experimental results, it was suggested that the
remineralizing agent, including BAG-containing experimental varnish, can deposit HAP or
FAP crystals on the demineralized enamel surface; in particular, the experimental varnish
showed the highest recovery of microhardness (P < 0.05).
In this study, ultrasonication was performed to confirm the substantivity of the newly
formed layer. According to the results, most of the precipitates remained on the enamel
surfaces. This suggests that the newly formed layer could chemically interact with the
underlying enamel or that precipitates tended to be retained in the demineralized lacunae.
The durability of the crystalline layer formed by the application of BAG had been confirmed
in previous studies; the layer showed resistance to brushing-abrasion and transformed to
HAP crystals in the remineralizing solution after 14 days [48].
BAG-containing varnish was applied indirectly to the specimens for the easy removal
of varnish in this study. Direct application is more similar to clinical situations. In case of
direct application, removal of varnish might deform the enamel surface, which is presumed
to be remineralized.
The BAG-containing varnish has clinical advantages, such as immediate adhesion to
the enamel surface by light curing and sufficient reaction time. Even if it is expected to
have long sustainability, it is inevitable that it might be partly removed by brushing and
chewing. Nevertheless, it could persist for a longer time than conventional varnishes, and it
is predicted that the remineralization process would be more stable. Moreover, silica glass
particles might impart wear resistance to the experimental BAG-varnish before mechanical
deformation. It was reported that a dental varnish with high filler content can resist up to
5000 strokes of brushing [26].
Factors affecting the remineralization ability of BAG-containing varnish include the
amount of BAG and the substantivity of varnish. If more BAG content and longer appli-
cation time are guaranteed, more remineralization might occur. However, an excessive
amount of BAG may change the mechanical properties of the varnish. Therefore, further
studies are necessary to determine the optimal amount of BAG and the optimal duration
of application.
This study examined the effect of a novel light-curing BAG-containing varnish on
enamel remineralization. The varnish exhibited superior recovery of microhardness in
demineralized enamel and showed equal or better HAP crystal precipitation comparedMaterials 2021, 14, 3745 11 of 13
to commercial dental varnishes. It may be adopted for early enamel lesion treatment, can
persist for a longer time than conventional varnishes, and can be applied more conve-
niently. The experimental light-curing BAG-varnish can provide protection for a relatively
long application time and may also reduce the frequency of patient visits for preventive
dental care.
Although this study proved the effectiveness of novel BAG-containing varnish on
enamel remineralization in vitro, further studies are necessary to determine the optimal
content of BAG and retention period of BAG-containing varnish on enamel. In addition,
for clinical application of the BAG varnish, in vivo tests and clinical trials will be necessary.
5. Conclusions
We conclude that BAG-containing varnish can help regain the microhardness of
demineralized enamel and increase HAP crystal precipitation on the demineralized surface.
The BAG-containing varnish has clinical advantages, such as immediate adhesion to the
enamel surface by light curing and sufficient reaction time. The newly formed HAP layer
was relatively stable under ultrasonication conditions.
The application of light-curing experimental BAG varnish could be a useful strategy
to promote remineralization of early carious lesions or demineralized enamel surfaces in
minimally invasive dentistry with a prolonged application time and greater convenience
of use.
Author Contributions: Conceptualization, D.-S.K.; methodology, D.-S.K.; validation, D.-S.K., S.-Y.M.,
and H.-J.K.; formal analysis, H.-J.K. and S.-Y.M.; investigation, S.-Y.M.; resources, D.-S.K.; data cura-
tion, H.-J.K.; writing—original draft preparation, S.-Y.M. and H.-J.K.; writing—review and editing,
D.-S.K. and H.-J.K.; visualization, S.-Y.M. and H.-J.K.; supervision, D.-S.K.; project administration,
D.-S.K.; funding acquisition, D.-S.K. All authors have read and agreed to the published version of the
manuscript.
Funding: This work was supported by the National Research Foundation of Korea (NRF) grant
funded by the Korean government (MSIT) (No. 2019R1F1A1057615).
Institutional Review Board Statement: The study was conducted according to the guidelines of the
Declaration of Helsinki and approved by the Institutional Review Board of Kyung Hee University
Dental Hospital (KHD IRB 1902-1 at 21 February 2019).
Informed Consent Statement: Patient consent was waived because comprehensive consent was
obtained when the patient’s teeth were extracted in our institution. This indicates that the extracted
teeth might be used for future research. Therefore, individual patient consent was not required in the
studies using only previously extracted teeth.
Data Availability Statement: The data presented in this study are available on request from the
corresponding author.
Acknowledgments: The authors appreciate MEDICLUS for generous support of the novel experi-
mental BAG-containing varnish and composite resin.
Conflicts of Interest: The authors declare no conflict of interest.
References
1. Lippert, F.; Parker, D.M.; Jandt, K.D. In vitro demineralization/remineralization cycles at human tooth enamel surfaces investi-
gated by AFM and nanoindentation. J. Colloid Interface Sci. 2004, 280, 442–448. [CrossRef] [PubMed]
2. Wu, D.; Yang, J.; Li, J.; Chen, L.; Tang, B.; Chen, X.; Wu, W.; Li, J. Hydroxyapatite-anchored dendrimer for in situ remineralization
of human tooth enamel. Biomaterials 2013, 34, 5036–5047. [CrossRef] [PubMed]
3. Arends, J.; Cate, J.T. Tooth enamel remineralization. J. Cryst. Growth 1981, 53, 135–147. [CrossRef]
4. Neel, E.A.A.; Aljabo, A.; Strange, A.; Ibrahim, S.; Coathup, M.; Young, A.M.; Bozec, L.; Mudera, V. Demineralization–
remineralization dynamics in teeth and bone. Int. J. Nanomed. 2016, ume 11, 4743–4763. [CrossRef]
5. Philip, N. State of the Art Enamel Remineralization Systems: The Next Frontier in Caries Management. Caries Res. 2019, 53,
284–295. [CrossRef]
6. Bakry, A.S.; Marghalani, H.Y.; Amin, O.A.; Tagami, J. The effect of a bioglass paste on enamel exposed to erosive challenge. J.
Dent. 2014, 42, 1458–1463. [CrossRef]Materials 2021, 14, 3745 12 of 13
7. Rošin-Grget, K.; Peroš, K.; Sutej, I. The cariostatic mechanisms of fluoride. Acta Medica Acad. 2013, 42, 179–188. [CrossRef]
8. Rahiotis, C.; Vougiouklakis, G. Effect of a CPP-ACP agent on the demineralization and remineralization of dentine in vitro. J.
Dent. 2007, 35, 695–698. [CrossRef] [PubMed]
9. Reynolds, E.; Cai, F.; Shen, P.; Walker, G. Retention in Plaque and Remineralization of Enamel Lesions by Various Forms of
Calcium in a Mouthrinse or Sugar-free Chewing Gum. J. Dent. Res. 2003, 82, 206–211. [CrossRef]
10. Chen, H.; Gu, L.; Liao, B.; Zhou, X.; Cheng, L.; Ren, B. Advances of Anti-Caries Nanomaterials. Molecules 2020, 25, 5047.
[CrossRef] [PubMed]
11. Borzabadi-Farahani, A.; Borzabadi, E.; Lynch, E. Nanoparticles in orthodontics, a review of antimicrobial and anti-caries
applications. Acta Odontol. Scand. 2013, 72, 413–417. [CrossRef]
12. Moshaverinia, M.; Sameni, A.; Ansari, S.; Moshaverinia, A.; Borzabadi-Farahani, A. Effects of incorporation of nano-fluorapatite
particles on microhardness, fluoride releasing properties, and biocompatibility of a conventional glass ionomer cement (GIC).
Dent. Mater. J. 2016, 35, 817–821. [CrossRef] [PubMed]
13. Fu, Q.; Saiz, E.; Rahaman, M.N.; Tomsia, A.P. Bioactive glass scaffolds for bone tissue engineering: State of the art and future
perspectives. Mater. Sci. Eng. C 2011, 31, 1245–1256. [CrossRef]
14. Thompson, I.D.; Hench, L.L. Mechanical properties of bioactive glasses, glass-ceramics and composites. Proc. Inst. Mech. Eng.
Part H J. Eng. Med. 1998, 212, 127–136. [CrossRef] [PubMed]
15. Milly, H.; Festy, F.; Watson, T.F.; Thompson, I.; Banerjee, A. Enamel white spot lesions can remineralise using bio-active glass and
polyacrylic acid-modified bio-active glass powders. J. Dent. 2014, 42, 158–166. [CrossRef] [PubMed]
16. Vollenweider, M.; Brunner, T.J.; Knecht, S.; Grass, R.N.; Zehnder, M.; Imfeld, T.; Stark, W.J. Remineralization of human dentin
using ultrafine bioactive glass particles. Acta Biomater. 2007, 3, 936–943. [CrossRef]
17. Bakry, A.S.; Abbassy, M.A.; Alharkan, H.F.; Basuhail, S.; Al-Ghamdi, K.; Hill, R. A Novel Fluoride Containing Bioactive Glass
Paste is Capable of Re-Mineralizing Early Caries Lesions. Materials 2018, 11, 1636. [CrossRef]
18. Salehi, S.; Davis, H.B.; Ferracane, J.L.; Mitchell, J.C. Sol-gel-derived bioactive glasses demonstrate antimicrobial effects on common
oral bacteria. Am. J. Dent. 2015, 28, 111–115.
19. Sauro, S.; Osorio, R.; Watson, T.F.; Toledano, M. Therapeutic effects of novel resin bonding systems containing bioactive glasses
on mineral-depleted areas within the bonded-dentine interface. J. Mater. Sci. Mater. Med. 2012, 23, 1521–1532. [CrossRef]
20. Davis, H.B.; Gwinner, F.; Mitchell, J.C.; Ferracane, J.L. Ion release from, and fluoride recharge of a composite with a fluoride-
containing bioactive glass. Dent. Mater. 2014, 30, 1187–1194. [CrossRef]
21. Khvostenko, D.; Hilton, T.; Ferracane, J.; Mitchell, J.; Kruzic, J. Bioactive glass fillers reduce bacterial penetration into marginal
gaps for composite restorations. Dent. Mater. 2016, 32, 73–81. [CrossRef]
22. Khvostenko, D.; Mitchell, J.; Hilton, T.; Ferracane, J.; Kruzic, J. Mechanical performance of novel bioactive glass containing dental
restorative composites. Dent. Mater. 2013, 29, 1139–1148. [CrossRef] [PubMed]
23. Jang, J.-H.; Lee, M.G.; Ferracane, J.L.; Davis, H.; Bae, H.E.; Choi, D.; Kim, D.-S. Effect of bioactive glass-containing resin composite
on dentin remineralization. J. Dent. 2018, 75, 58–64. [CrossRef] [PubMed]
24. Sauro, S.; Watson, T.F.; Thompson, I.; Toledano, M.; Nucci, C.; Banerjee, A. Influence of air-abrasion executed with polyacrylic
acid-Bioglass 45S5 on the bonding performance of a resin-modified glass ionomer cement. Eur. J. Oral Sci. 2012, 120, 168–177.
[CrossRef] [PubMed]
25. Kim, H.-J.; Bae, H.E.; Lee, J.-E.; Park, I.-S.; Kim, H.-G.; Kwon, J.; Kim, D.-S. Effects of bioactive glass incorporation into glass
ionomer cement on demineralized dentin. Sci. Rep. 2021, 11, 1–10. [CrossRef]
26. Mehta, A.; Paramshivam, G.; Chugh, V.K.; Singh, S.; Halkai, S.; Kumar, S. Effect of light-curable fluoride varnish on enamel
demineralization adjacent to orthodontic brackets: An in-vivo study. Am. J. Orthod. Dentofac. Orthop. 2015, 148, 814–820.
[CrossRef] [PubMed]
27. Huang, S.B.; Gao, S.S.; Yu, H.Y. Effect of nano-hydroxyapatite concentration on remineralization of initial enamel lesion in vitro.
Biomed. Mater. 2009, 4, 034104. [CrossRef] [PubMed]
28. Cengiz, B.; Gokce, Y.; Yildiz, N.; Aktas, Z.; Calimli, A. Synthesis and characterization of hydroxyapatite nanoparticles. Colloids
Surf. A Physicochem. Eng. Asp. 2008, 322, 29–33. [CrossRef]
29. Aljabo, A.; Neel, E.A.A.; Knowles, J.C.; Young, A.M. Development of dental composites with reactive fillers that promote
precipitation of antibacterial-hydroxyapatite layers. Mater. Sci. Eng. C 2016, 60, 285–292. [CrossRef] [PubMed]
30. Brundavanam, R.K.; Poinern, G.E.J.; Fawcett, D. Modelling the crystal structure of a 30 nm sized particle based hydroxyapatite
powder synthesised under the influence of ultrasound irradiation from X-ray powder diffraction data. Am. J. Mater. Sci. 2013, 3,
84–90.
31. Hench, L.L. Bioceramics: From Concept to Clinic. J. Am. Ceram. Soc. 1991, 74, 1487–1510. [CrossRef]
32. Gavic, L.; Gorseta, K.; Borzabadi-Farahani, A.; Tadin, A.; Glavina, D.; Gavic, L.; Gorseta, K.; Borzabadi-Farahani, A.; Tadin, A.;
Glavina, D. Influence of toothpaste pH on its capacity to prevent enamel demineralization. Contemp. Clin. Dent. 2018, 9, 554–559.
[CrossRef] [PubMed]
33. González-Cabezas, C.; Fernandez, C.E. Recent Advances in Remineralization Therapies for Caries Lesions. Adv. Dent. Res. 2018,
29, 55–59. [CrossRef] [PubMed]
34. Amaechi, B.T.; Van Loveren, C. Fluorides and non-fluoride remineralization systems. Toothpastes 2013, 23, 15–26.Materials 2021, 14, 3745 13 of 13
35. Fernández, C.E.; Fontana, M.; Samarian, D.; Cury, J.A.; Rickard, A.H.; González-Cabezas, C. Effect of Fluoride-Containing
Toothpastes on Enamel Demineralization and Streptococcus mutans Biofilm Architecture. Caries Res. 2016, 50, 151–158. [CrossRef]
36. Reynolds, E.C.; Cai, F.; Cochrane, N.J.; Shen, P.; Walker, G.D.; Morgan, M.V. Fluoride and Casein Phosphopeptide-Amorphous
Calcium Phosphate. J. Dent. Res. 2008, 87, 344–348. [CrossRef]
37. Lagerweij, M.; Cate, J.T. Remineralisation of Enamel Lesions with Daily Applications of a High-Concentration Fluoride Gel and a
Fluoridated Toothpaste: An in situ Study. Caries Res. 2002, 36, 270–274. [CrossRef]
38. Haugejorden, O.; Birkeland, J.M. Ecological time-trend analysis of caries experience at 12 years of age and caries incidence from
age 12 to 18 years: Norway 1985–2004. Acta Odontol. Scand. 2006, 64, 368–375. [CrossRef]
39. Li, J.; Xie, X.; Wang, Y.; Yin, W.; Antoun, J.S.; Farella, M.; Mei, L. Long-term remineralizing effect of casein phosphopeptide-
amorphous calcium phosphate (CPP-ACP) on early caries lesions in vivo: A systematic review. J. Dent. 2014, 42, 769–777.
[CrossRef]
40. Wu, G.; Liu, X.; Hou, Y. Analysis of the effect of CPP-ACP tooth mousse on enamel remineralization by circularly polarized
images. Angle Orthod. 2010, 80, 933–938. [CrossRef]
41. ZERO, D.T. Recaldent™—Evidence for clinical activity. Adv. Dent. Res. 2009, 21, 30–34. [CrossRef] [PubMed]
42. Andersson, Ö.H.; Kangasniemi, I. Calcium phosphate formation at the surface of bioactive glass in vitro. J. Biomed. Mater. Res.
1991, 25, 1019–1030. [CrossRef] [PubMed]
43. Burwell, A.K.; Litkowski, L.J.; Greenspan, D.C. Calcium Sodium Phosphosilicate (NovaMin® ): Remineralization Potential. Adv.
Dent. Res. 2009, 21, 35–39. [CrossRef]
44. Bakry, A.S.; Takahashi, H.; Otsuki, M.; Sadr, A.; Yamashita, K.; Tagami, J. CO2 Laser Improves 45S5 Bioglass Interaction with
Dentin. J. Dent. Res. 2010, 90, 246–250. [CrossRef] [PubMed]
45. Lucas-Girot, A.; Mezahi, F.Z.; Mami, M.; Oudadesse, H.; Harabi, A.; Le Floch, M. Sol–gel synthesis of a new composition of
bioactive glass in the quaternary system SiO2 –CaO–Na2 O–P2 O5 : Comparison with melting method. J. Non-Cryst. Solids 2011,
357, 3322–3327. [CrossRef]
46. Sepulveda, P.; Jones, J.R.; Hench, L.L. In vitro dissolution of melt-derived 45S5 and sol-gel derived 58S bioactive glasses. J. Biomed.
Mater. Res. 2002, 61, 301–311. [CrossRef]
47. Lukowiak, A.; Lao, J.; Lacroix, J.; Nedelec, J.-M. Bioactive glass nanoparticles obtained through sol–gel chemistry. Chem. Commun.
2013, 49, 6620–6622. [CrossRef]
48. Bakry, A.; Takahashi, H.; Otsuki, M.; Tagami, J. Evaluation of new treatment for incipient enamel demineralization using 45S5
bioglass. Dent. Mater. 2014, 30, 314–320. [CrossRef]
49. Golpayegani, M.V.; Sohrabi, A.; Biria, M.; Ansari, G. Remineralization Effect of Topical NovaMin Versus Sodium Fluoride (1.1%)
on Caries-Like Lesions in Permanent Teeth. J. Dent. 2012, 9, 68–75.
50. Benjasuwantep, P.; Rirattanapong, P.; Vongsavan, K. The remineralization effect of bioactive glass on enamel caries-like lesions in
primary teeth. Southeast Asian J. Trop. Med. 2017, 48, 1127–1132.
51. Al-Khafaji, T.J.; Wong, F.; Fleming, P.S.; Karpukhina, N.; Hill, R. Novel fluoride and strontium-containing bioactive glasses for
dental varnishes-design and bioactivity in Tris buffer solution. J. Non-Cryst. Solids 2019, 503–504, 120–130. [CrossRef]
52. Almeida, A.P.G.; Braz, D.; Colaço, M.V.; Barroso, R.C.; Porto, I.M.; Gerlach, R.F.; Droppa, R. Analysis of synchrotron X-ray
diffraction patterns from fluorotic enamel samples. In Proceedings of the International Nuclear Atlantic Conference, Rio de
Janeiro, RJ, Brazil, 27 September–2 October 2009.
53. Mneimne, M.; Hill, R.G.; Bushby, A.J.; Brauer, D.S.; Mneimne, M.; Hill, R.G.; Bushby, A.J.; Brauer, D.S. High phosphate content
significantly increases apatite formation of fluoride-containing bioactive glasses. Acta Biomater. 2011, 7, 1827–1834. [CrossRef]
[PubMed]You can also read