Structural characterisation of rock mass defects: a comparison of traditional and emerging technologies - 6th ...
←
→
Page content transcription
If your browser does not render page correctly, please read the page content below
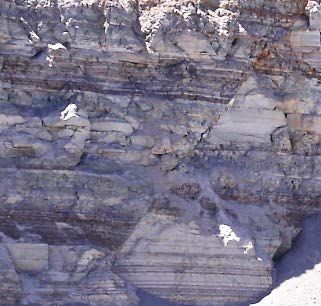
Structural characterisation of rock mass defects: a
 comparison of traditional and emerging technologies
 S. Fityus / K. Thoeni
 The University of Newcastle, Callaghan, Australia, Stephen.fityus@newcastle.edu.au
 J. Cudmore, A. Giacomini
 The University of Newcastle, Callaghan, Australia

ABSTRACT: Emerging technologies are revolutionising the way in which rock mass defects are being characterised.
The traditional approach of measuring rock discontinuities using a geological compass is being replaced, both by alter-
native direct-contact measurement devices as smartphones with applications that directly give dip and dip direction, and
by low-cost non-contact approaches such as photogrammetry performed on digital images to develop a 3D model of the
rock face, thereby allowing virtual measurements of discontinuities to be taken. This paper presents a comparison of the
accuracy of these different approaches to gathering orientation data (dip angle and dip direction) for discontinuities in
natural rock masses, with accompanying consideration of the efficiency and relative cost of various contact and non-
contact methods. Two mobile phones with different apps were used to take contact measurements and several different
cost/quality image sensors were used to capture digital images for the photogrammetric models. Several image sets were
collected and subsequently processed using Agisoft Metashape to develop 3D point clouds and eventually a high-resolu-
tion 3D model. The open-source package CloudCompare was used to virtually take measurements of the features. The
average of conventional geological compass measurements was used as a benchmark. From the results, most of the meth-
ods were generally found to be acceptably reliable. Of the results from the smartphone applications, that of the iPhone 4
(an older generation) was more unreliable. It provided inaccurate dip direction due to the device constantly requiring
calibration. Generally, the dip angle was approximated better than the dip direction for both devices. The photogrammetric
models provided results closest to the compass from the highest quality sensor as expected. All models performed rela-
tively well, the dip angle was close to the compass for most approaches, and the dip direction provided least error on the
higher accuracy approaches.

Keywords: geostructural mapping, low-cost sensors, photogrammetry, point cloud, smartphone

 The traditional method of obtaining geostructural data
1. Introduction is a geological compass. The modern geological compass
 has been in use for around 70 years, however the concept
 Discontinuities, “geostructural features” or “rock de- is based on magnetic compasses which have been in use
fects” are general terms used to describe a variety of fea- since the 11th century [1]. Major issues with manual field
tures of rock masses. These rock features can have ad- data collection include safety, accessibility, human error
verse effects on the engineering behaviour of rock and time.
masses, such as reduction in strength, increase in deform-
ability and anisotropic permeability. Failure in a rock
mass will usually occur within or involve these defects,
where they exist.
 Geostructural features in rock masses include bedding
surfaces, foliations, joints and faults (Figure 1). They in-
clude both actual defects as well as structures and fabrics
which represent potential defects. On a small scale (at
least), these features usually present approximately pla-
nar surfaces, the orientation of which can be character-
ised by a set of angular measurements such as dip direc-
tion, dip angle and strike, as defined in Figure 2.
 The dip angle is the steepest inclination of the struc-
tural feature plane, relative to the horizontal plane, as
shown in green on Figure 2. Therefore, by definition, the
dip angle must be between zero (perfectly horizontal) and
ninety (vertical) degrees. The dip direction is the declina-
tion angle from north to the projection of the dip angle
vector into the horizontal plane. The dip direction is usu-
ally defined by a full circle angle between zero to three
 Figure 1. Geostructural features: bedding (top left); foliation (top
hundred and sixty degrees.
 right); joints (bottom left) and faults (bottom right).
2. Scope
 For this study, a variety of different technologies were
 used to obtain geostructural data, and this was compared
 with the data for the same geostructural surfaces meas-
 ured using a geological compass as the benchmark. A
 Freiberger geological compass (Figure 3) was used to
 produce the benchmark measurements for this study.
 The new technologies for geostructural feature
 measurement include both devices which act as direct
 alternatives to compasses, and which measure through
 direct contact with rock, and technologies which can
 produce virtual 3D models of rock exposures, from
 which measurements can be taken.
 Whilst accuracy is the primary consideration, the cost
 Figure 2. Geostructural feature orientation definitions.
 and efficiency of the technology was also considered.
 Measurements of designated rock surface features were
 taken which included the dip angle and dip direction,
 It has only been with recent technological advances with the strike also found by subtracting 90° from the dip
that devices like smartphones have been able to make use direction. The accuracy of measurements is evaluated by
of built-in sensors such as accelerometer, gyroscope and determining the absolute error produced from subtracting
compass via applications to measure discontinuities [2- the various method measurements from an average
7]. This has created opportunity for potentially more ef- compass measurement.
ficient methods of obtaining geostructural information.
Compared to a geological compass that gives only raw
data and generally requires software to plot the data, the
phone applications can measure the orientation of fea-
tures and then present a plot of the data collected. Stream-
lining of the process is the main allure of the use of
smartphones in measuring the attitude of geostructural
features. The purpose of using virtual compasses in the
form of phone applications is mainly the ease of use and
convenience. Taking measurements using traditional
methods like the geological compass is often difficult and
time consuming [5]. Figure 3.Freiberger geological compass.
 Proximity remote sensing methods such as photo-
grammetry and terrestrial laser scanning (TLS) are alter-
natives that provide new avenues of data collection and 3. Technologies studied
analysis [8-15]. These methods allow to gather a large The technologies used in this study fall into two main
amount of data in the form of 3D point clouds (and/or 3D categories: contact-based technologies, which comprise
surface models) of rock mass exposures, from which vir- devices that are effectively alternatives to the traditional
tual measurements can be taken. Whereas a laser scanner geological compass and which must be placed on the sub-
samples millions of points to create a dense 3D point ject surface to obtain a measurement; and non-contact
cloud of its own, the collected digital images need to be technologies, which are devices that can scan and meas-
post-processed using for example SfM-MVS software. ure a rock exposure remotely to create a 3D virtual model
The latter can be computationally very demanding. How- (point cloud and/or mesh), from which measurements of
ever, recent advances in computer vision and increasing the surface can be recreated and geostructural data ex-
processing power have facilitated a new era of 3D map- tracted. A wide variety of technologies was selected
ping. In addition, the power of photogrammetry has been ranging in quality and price.
strengthened by the deployment of sensors using comple-
mentary technologies such as unmanned aerial vehicles
(UAVs) [16-20]. 3.1. Contact Technologies
 These proximity remote sensing methods provide The contact technologies included in this study were
added benefits such as keeping the user safe and provid- all smartphones, employing applications allowing them
ing more data in an automated way. The advancements in to be used as a geological compass through data provided
clever and efficient TLS technologies over the last 15-20 by the built-in sensors that are available on many
years might have discouraged the development of other smartphones these days. Smartphones require compass
techniques such as photogrammetry, however with grow- and inclinometer sensors to utilise geological compass
ing computational power and the development of new applications. The compass sensor acts the same as a mag-
low-cost sensors it has been quite the opposite [21-23]. netic compass and is used to measure orientation of the
 This paper compares and evaluates some of these phone. The inclinometer sensor is used to measure the
emerging technologies by conducting a systematic anal- inclination of the smartphone at any given time. Whereas
ysis of measurements taken at a rock face.
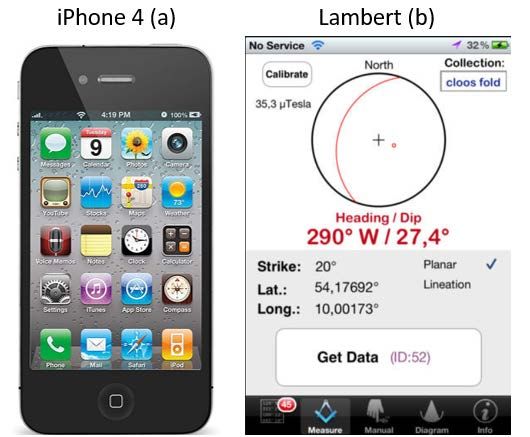
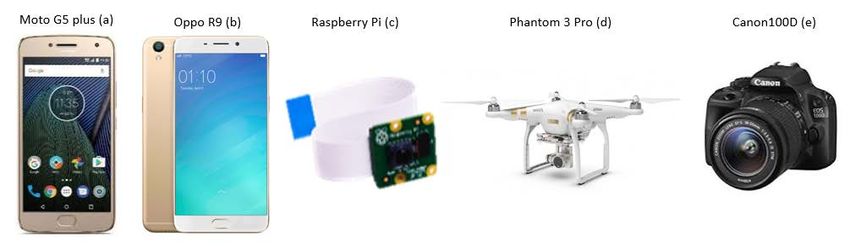
inclinometer sensors are very common and present in al- For this study an Android Oppo R9 phone and an Ap-
most every smartphone, this is not the case for the com- ple iPhone 4 were considered and used in conjunction
pass sensor. with varying compass applications (Figure 4). For the
 Smartphone geological compass applications provide Android Oppo R9, the Geological Compass (GC) free
an array of features and benefits such as ease of use and from the Android store was used. The eGEO Compass
accessibility. They also streamline the tasks, can store the Pro was also considered but it is not free and initial tests
measurements to a file and even plot the measurements showed that it is giving the same results as the GC free.
stereographically on the go. For the apple iPhone 4, the Lambert app from the Apple
 store was used.

 Figure 4. Oppo Android phone (image from productreview.com.au) with applications (left) and Apple iPhone (image from amazon.com) with
 application (right).

3.2. Non-Contact Technologies They were selected for their variety in cost and resolu-
 tion. Low-cost cameras generally have smaller sensors
 Non-contact technologies are also commonly referred and less stable optics when compared to higher cost cam-
to as ‘remote sensing’ technologies. For this study, the eras like DSLR.
technologies chosen all work by utilising a photographic Shown in Figure 6 is a diagram of how a camera takes
sensor within a device to capture photographic digital im- an image. What the sensor actually acquires in a 2D im-
ages. These are then processed using a software which age, and its resolution, depends upon a combination of
creates a high-resolution 3D model (dens point cloud and the physical size of the sensor (width in mm), the object
mesh) of the rock face/exposure. The geostructural char- distance (mm) and the focal length (mm). The sensor cap-
acteristics of any facet of the modelled surface can then tures information pixel by pixel, where the width of a
be extracted, either manually or automatically. pixel (mm) is the sensor width divided by the number of
 A variety of different devices from very low cost to pixels. The corresponding size of the view that is cap-
professional grade cameras were used to acquire imagery tured by each pixel is known as the Ground Sampling
for this study to compare how their properties affect the Distance (GSD, in mm per pixel) which determines the
result and to see whether simple everyday cameras can size of one pixel in the field. The accuracy of the final 3D
produce reliable information. Figure 5 shows the differ- model is directly affected by the resolution and quality of
ent contact-less devices used in this study, which include the image sensor and its optics [23].
two smartphones (Moto G5 plus and Oppo R9), a Rasp- Listed in Table 1 are the properties of each of the cam-
berry Pi with a camera module, a Phantom 3 Pro UAV era sensors used as contact-less devices for this compari-
with inbuilt camera and a Canon 100D DSLR camera. son study. They were obtained from the manufacturer’s
 specifications.

 Figure 5. Non-Contact (photographic sensors) used in this study (images from: productreview.com.au, amazon.com, bhphotovideo.com).
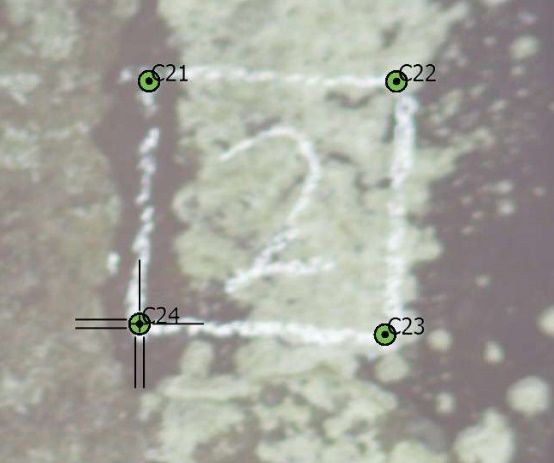
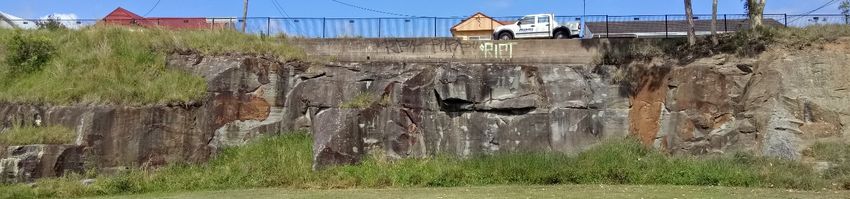
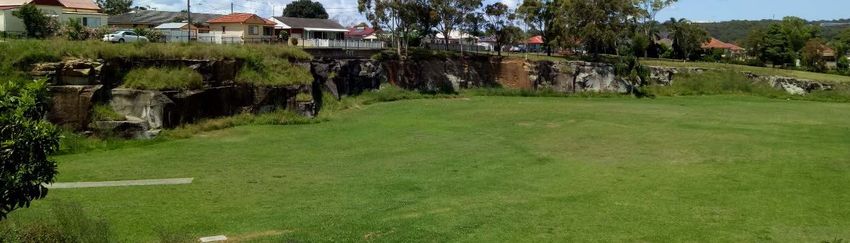
Table 1. Properties of each of the camera sensors used as non-contact devices for this comparison study

 Sensor Focal Focal
 Resolution Resolution Sensor size Pixel size
 Sensor model type length length
 MP pixels - mm μm mm pixels
 Canon 100D 18 5184x3456 CMOS 22.3x14.9 4.38 24 5738.88
 Moto G5 plus 12.2 4032x3024 CMOS 5.65x4.24 1.4 4.28 3059.04
 Raspberry pi 8 3280x2464 CMOS 3.68x2.76 1.12 3.04 2580.03
 Oppo R9 (and GPS) 12.98 4160x3120 CMOS 4.69x3.52 1.127 3.5 3143.38
 Phantom 3 Pro (and GPS) 12 4000x3000 CMOS 6.30x4.72 1.56 3.61 2322.29

 A complication arising from the low-cost non-contact
 technologies that employ photogrammetric surface mod-
 elling is that the digital surfaces created are generally not
 explicitly referenced in space (unless built-in GPS data is
 available), so that absolute geostructural data cannot be
 directly extracted. To obtain meaningful geostructural
 data, the models produced via photogrammetry must be
 georeferenced. This was achieved using ground control
 points (GCP) which were measured using a total station.
 The use of the total stations allows for accurate 3D posi-
 tioning of points on a rock mass surface to the nearest
 millimetre. The GCP were then selected on the images
 before processing the image sets with the SfM-MVS soft-
 ware to obtain the virtual models. The virtual models
 were then exported and inspected using the open-source
 tool CloudCompare [25].
 The GPS models use the GPS coordinates stored from
 ( in mm x ℎ in mm)
 the image set (geographic coordinates of the built-in GPS
 (mm per pixel) = antenna at the time of the image acquisition are recorded
 ( ℎ in mm x ℎ in pixels)
 in the EXIF metadata of the image) taken as a georefer-
 Figure 6.Relationship between the GSD and the sensor width. ence rather than the GCP in the images. This exercise was
 performed to get an idea how accurate measurements
 from models georeferenced using standard built-in GPS
 could be, knowing that the accuracy of the built-in GPS
 is rather low (generally in the range of 5-10 m).

 4. Study Site
 The site chosen for this study was Pilkington Street
 Reserve, North Lambton, NSW, Australia. The site is a
 disused quarry which formerly produced blocks of the
 Permian Waratah Sandstone, a very-thickly bedded,
 Figure 7.Relationship between GSD and the object distance for massive, medium-grained, lithic sandstone. This site has
 various camera sensors. since been rehabilitated and is now used as a recreational
 area. Images of the site are shown in Figure 8.
 From the data in Table 1, and the geometry of Figure The specific area worked on for measurements is
6, the relationship between GSD and object distance was illustrated from A-A to B-B in Figure 8. The width of the
determined for each sensor, as shown in Figure 7. This rock mass studied was around 25-30 m and the average
was utilised in determining a suitable distance from the height was around 6 m. The rock mass investigated is
studied rock surface to take photographs used for the ge- characterised by widely-spaced, joints that are mostly
ostructural analysis. planar and smooth, which form the majority of exposed
 The acquired digital images were processed to pro- surfaces. There are two perpendicular, persistent,
duce dense 3D point clouds from which measurements of primary joint sets as well as some non-persistent joints
geostructural data were taken. The software used for this and some quarry-induced fractures. These afforded a
process was Agisoft Metashape [24]. This software uti- good variety of sloping surfaces in many directions to
lises SfM-MVS to process 2D digital images to obtain 3D serve as places for measurement. There is a small
information. In comparison to traditional optical survey- retaining wall built on the top portion and there is some
ing techniques, SfM-MVS is much faster and cheaper in significant grassy vegetation around the rock face and a
terms of data acquisition [10]. few trees on top, to the right.
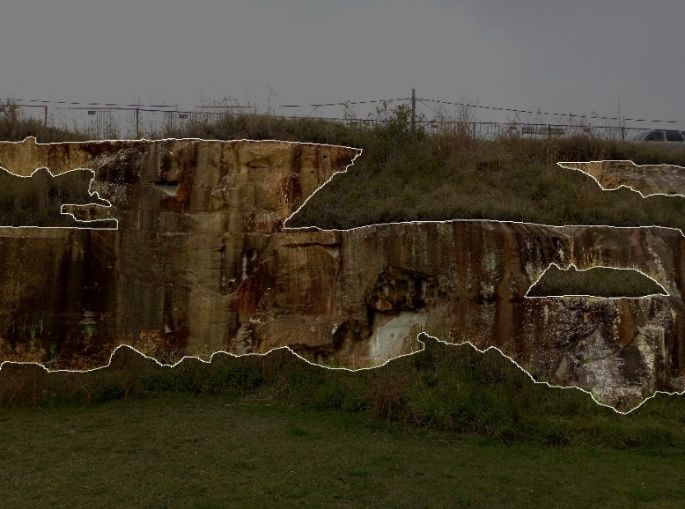
B-B
 A-A

 (a) General view of Pilkington Street Reserve, North Lambton, NSW.

 A-A B-B

 6m

 25-30m
 (b) Specific measurement area.

 Figure 8 Images of the studied rock faces at the study site.

5. Methodology The coordinates of the GCP were measured using a to-
 tal station set up at a distance of approximately 20 m of
 the centre of the rock face. Measurements were taken to
5.1. Fieldwork the coordinates of the four corners of the square. The ac-
 A set of GCP were established on the site for accurate curacy of the coordinates of the GCP and check points
georeferencing of the photogrammetric models. These should ideally be smaller than that of the GSD [23]. Due
were positioned to be clearly visible points that were easy to the high accuracy of the total station and the rather
to find. GCP typically are coded targets or natural fea- close set up this was easily achieved.
tures, depending on accessibility [19]. For the purpose of Due to the positioning of the rock face, the optimum
this paper, an intermediate method was used. Chalk tar- time for lighting is in the afternoon. This is when the least
gets (10 × 10 cm square) were drawn on selected features amount of shadow is on the rock face, with the sun shin-
of the rock face, as shown in Figure 9. The inner corners ing directly on the face. This meant that the photogram-
of the square were used as GCP. metry data collection would be completed late in the af-
 ternoon.
 The image footprint was selected to achieve an image
 overlap of about 80% since an overlap of 60-80% is rec-
 ommended as a basis for good quality models [10].

 5.1.1. Contact Data Acquisition
 Locations were selected for the contact measurement
 points. At each location, a 10 × 10 cm flat plywood block
 was placed on the rock face in the general position to take
 the measurements. The block was translated and rotated
 until it sat firmly and relatively flat on the rock face, then
 chalk was used to mark a square around the block. The
 block was taken off and a point number was written in
 the centre of the square to identify the point of measure-
 ment. The marked squares where the same one as the
 used for the GCP (see Figure 9).
 Figure 9 Set of Ground Control Points (GCP). The four inner
 corners of the square where measured and used as GCP.
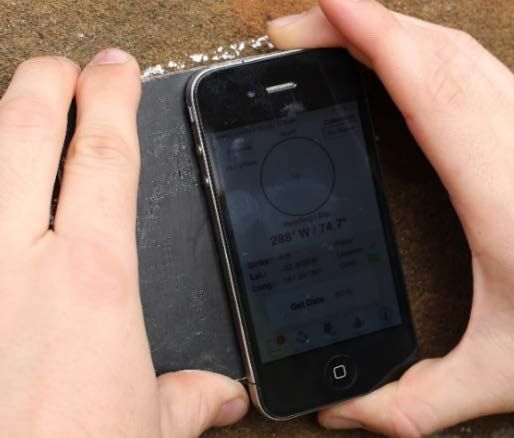
Two sets of contact measurements were made; one set 5.1.2. Non-Contact Data Acquisition
with the block in place as a base for the device, and the
second with the device resting directly on the rock. Using the charts previously discussed in Figure 7, the
Firstly, the android application Geological Compass free lowest possible GSD was selected that allowed a reason-
was used through the Oppo phone orientated in both por- able object distance to minimise the number of photos
trait and landscape orientations. The phone was placed in needed to capture the whole rock face. A GSD of 2-3
the centre of the block, the application was opened on the mm/pixel was chosen. Once all image footprints were de-
phone and the dip angle and dip direction were written termined for the chosen GSD, the object distances were
down on a data sheet. This same process was applied to physically marked out in front of the rock face, maintain-
the apple application Lambert via the iPhone 4. This is ing approximately the same distance from the irregular
shown in Figure 10. After this the geological compass rock face along its length.
was used to measure the dip direction and angle. For the required image overlap of 80%, the distance
 between each photo was roughly 1 m between photos for
 all the models.

 5.2. Data Analysis

 5.2.1. Processing of Digital Images
 The commercial program Agisoft Metashape Profes-
 sional [24] (previously known as Agisoft Photoscan) was
 used to process the digital images into 3D models (dens
 point clouds and meshes). The same processing parame-
 ters as in Thoeni et al. [23] were used for all models. Ta-
 ble 2 summarises information relating to each non-con-
 tact sensor and the data acquired.
 Figure 10 Contact measurement with block.

 Table 2. Contact-less Data Statistics.
 Once the measurements from the applications and the Sensor GCP Images Object GSD Coverage
compass were taken, the 10 × 10 cm block was removed model Distance Area
from the surface and the same measurements were taken # # m mm/ m2
directly on the rock surface within the marked square. pixel
Figure 11 shows examples of the measurements without Canon
 100 46 14.5 2.52 82.9
the block on the surface. The same notation was used for 100D
 Moto G5
the corresponding devices with a * at the end, for exam- plus
 100 60 7.8 2.57 93.9
ple the Oppo portrait measurement was called “OP*. Rasp. Pi 100 68 7.7 2.99 110
 This process was repeated for 22 points at the base of
 Oppo R9 100 60 9.7 3.1 102
the rock face, then 5 points at the top of the rock face with
the final 3 points on the retaining wall above the rock face Phantom 3
 104 73 7.8 3.34 122
making a total of 30 points. Pro
 Oppo R9
 0 60 9.7 3.1 102
 GPS
 Phantom 3
 0 73 7.3 2.93 242
 Pro GPS

 Image processing to build rock surface models in-
 volves a series of steps [23]. Image masking is first per-
 formed to remove sections of foliage. This only left the
 rock face fully visible to be used in the model. An exam-
 ple of an image with the foliage masked is shown in Fig-
 ure 12.

 Figure 11 Contact measurement capture modes.
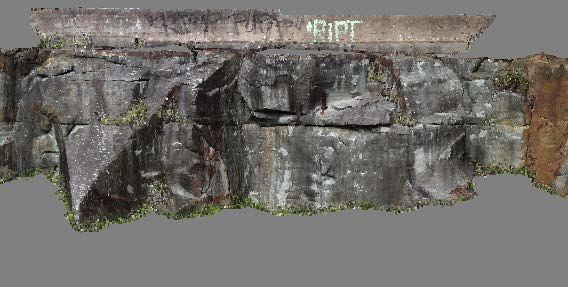
generally not practical, all GCP were used to get the best
 accuracy. This is seen as an academic exercise. A more
 practical relevant scenario would be the use of coded tar-
 gets and minimise the number of GCP needed for accu-
 rate georeferencing.
 Generally, after processing the sparse point cloud, the
 point cloud was cleaned of any noticeably incorrect
 points. Scattered points (outliers) that clearly were not
 part of the desired model were removed manually. In ad-
 dition, points with a high reprojection error were gradu-
 ally selected and removed. The latter improves the over-
 all accuracy of the model [23].
 A dense point cloud of high quality was then generated
 for each sparse point cloud. Each model took between 19
 and 37 minutes to calculate, generally turning the sparse
 point cloud of ~30,000 points into a dense point cloud of
 ~10 million points. Shown on Figure 14 is part of the
 Figure 12. Example of image masking in Metashape.
 dense point cloud produced from the Canon 100D after it
 Once all the image masks were created, photo align- has been cleaned up.
ment was carried out in preparation to build a sparse point
cloud. The program identifies the position and orientation
of the camera, for each of the photos imported into the
project. Two sparse clouds were generated for each
model at high resolution. Shown in Figure 13 is a portion
of the initial sparse point cloud generated for the Moto
G5 plus after the alignment process.

 Figure 14. Typical dense point cloud.

 5.2.2. Measurements on Digital Models
 Measurements of dip and dip direction from the pho-
 togrammetric models were made at the marked locations
 Figure 13. Typical initial sparse point cloud. on the rock face using the Compass plugin tool [14] in
 CloudCompare which involved fitting the diameter of a
 The coordinates of the GCP were imported into circle to pass through the points on the corners of the
Metashape to georeference and constrain the 3D model. marked square on the rock face, as is shown on Figure
During the field work photos were taken of each meas- 15a. The software then finds a plane that best fits the
urement point with the GCP marked on them, these were points within the circle (Figure 15b).
used to cross reference the image in the sparse point
cloud with the survey data. For each GCP, an image con-
taining that point was identified within the data set of the
sparse point cloud. Once it was found, the four markers
were placed on the four inner corners. This was repeated
for two images in the data set, after which the software
located other photos with the same point.
 Filtering the photos to show only the images with the
measurement sites after they had been selected on the im-
age pairs allowed them to then be corrected and in turn,
un-corrected ones were adjusted by the software and
made slightly more accurate.
 It took around 4 hours to mark all GCP correctly for (a) (b)
each model; in all, 120 GCP were manually located on as Figure 15. Selection of region (a) and fitting of a plane (b) in
many as 60 images for each model. It should be noted CloudCompare using the Compass plugin.
that generally only 3 GCP are needed for georeferencing
but additional GCP improve the accuracy of the model,
especially because they can be used as external con-
straints in the bundle adjustment [23]. Hence, although
6. Results and Discussion exceeding 10 degrees. The same information is also
 captured in Table 4.
 In the results that follow, Table 3 explains the codes to Table 5 presents the data of Table 4, for all of the
identify the various results. tested technologies, complied for comparison. In general,
 Table 3. Codes used in the presentation of results. there is not much difference between the available
 technologies, and certainly, the performance is not
 Technology Code Category Set Coverage Area
 directly proportional to price. Both contact and non-
Freiberger - contact Block contact technologies appear to be capable of giving
Compass * Rock
Lambert app I contact IP Block, portrait
 reliable measurements of dip and dip direction in most
on iPhone 4 IP* Rock, portrait situations. There is no case to argue that contact
 IL Block, landscape technologies are more or less reliable than non-contact
 IL* Rock, landscape technologies.
GC free app O contact OP Block, portrait Of the two contact methods considered, the GC free
on Oppo R9 OP* Rock, portrait
 app on the Oppo R9 smartphone did clearly outperform
 OL Block, landscape
 OL* Rock, landscape the Lambert app on the apple iPhone, with similar
Canon 100D C1 non- C1 3D model abilities to reliably determine dip angle, but a much lower
 contact likelihood of returning an error in dip direction in excess
Moto G5 plus M1 non- M1 3D model of 10 degrees.
 contact Of the different non-contact approaches, all but the
Raspberry Pi R1 non- R1 3D model model derived from the Oppo R9 images gave similarly
 contact reliable values of dip and dip direction. Data derived
Oppo R9 O1 non- O1 3D model
 from the Oppo R9 images had a significantly higher
 contact likelihood of being in error by more than 10 degrees. This
 might indicate that the image sensor is of less quality than
Phantom 3 Pro P1 non- P1 3D model
 contact the one for the other sensors. A standout in relative
 performance was the model derived from the Raspberry
Oppo R9 GPS OG1 non- OG1 3D model
 contact
 Pi camera module, which supported values as reliable as
 those derived from images captured by the much more
Phantom 3 Pro PG1 non- PG1 3D model
GPS contact
 expensive Canon 100D or Phantom 3 Pro.
 To provide some additional sense of overall
 performance, Figure 17 shows a comparison of results for
 In evaluating the different measurement technologies, two different measurement points (i.e. locations marked
it is assumed here that the measurements made using the out on the rock face): Point 2 which gave relatively
conventional Freiberger compass are correct, and the consistent values of dip and dip direction for all of the
performance of the different technologies is based upon different technologies, and Point 16, which displayed
how well their measurements compare with the compass relatively greater variability. For Point 2, both dip and dip
measurements, for the 30 different surfaces measured. direction fall within 2 degrees of the benchmark values,
 For each of the different technologies trialled, a set of except for the GC free app which underestimates the dip
results like the ones in Figure 16 were generated. It is direction by 8 degrees. For Point 16, the contact methods
apparent from Figure 16 that the 39 surfaces captured in generally overestimate the dip and the non-contact
the study included a diverse range of dip angles (almost generally underestimate, but in each case by not more
flat to vertical), but a less diverse range of dip directions, than 1 or 2 degrees. The dip direction, however, is
being somewhat biased by the exposures available in a overestimated by the iPhone by more than 30 degrees,
localised exposed rock face. and underestimated by the model derived from the Oppo
 Figure 16 shows the results for the GC free app on the G9 images by 20 degrees (due to a noisy point cloud).
Oppo R9 device. Figures 16a-b indicate that the error in The inaccuracy of the iPhone meaurement might be
this measurement technique is relatively small and realated to some calibation issues, whereas the one of the
randomly scattered on either side of the compass value. Oppo G9 is related to some noise in the 3D model.
Greater detail on the absolute error is given by Figures Table 5 also summarises the cost and time for each
16c-f, which suggest that there may be a slightly greater sensor. It should be noted that for the contact
tendency to overestimate both the dip and dip direction measurements the time refers to the time spend on the site
with this approach. The error in dip angle is generally less to conduct the actual measurements. It should also be
than 2 degrees but may be as big as 7 degrees. The error noted that more than one measurement per location was
in dip direction is generally less than 10 degrees but may carried out. For the non-contact technologies, the time
be up to 20 degrees. refers to the total time including capturing of images,
 The results of Figure 16 also suggest that the error in processing and taking the measurements on the virtual
the dip angle is not affected by whether the device is models. It should be noted that the time also includes the
oriented in portrait or landscape on the face, or whether time to select all GCP (about 4 hours), except for the one
it is placed on a backing block, or directly against the with GPS, which might not have a practical relevance
rock. The error in dip direction is also unaffected by the (e.g. coded targets can be used and only 3 GCP are
use of a mounting block, but it does seem that the error is necessary for georeferencing). Hence, without
reduced when the device is oriented in landscape considering this time all technologies are similarly
position; this seems to reduce the incidence of errors efficient.
(a) (b)

 (c) (d)

 (e) (f)

Figure 16. Typical results; example contact measurement results for the Oppo R9 phone with the GC free software.

 Table 4 Summary of errors in measurements using the Oppo R9 phone with the GC free app.

 Key OP OL OP* OL* OP OL OP* OL*
 Error Percentile (°) Angle Direction
 xxxx
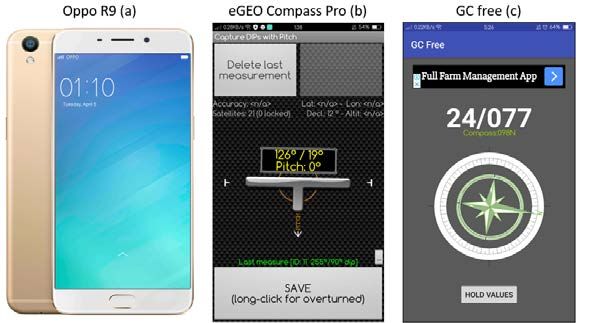
Table 5 Summary of errors for the different technologies tested.

 Sensor Keys Category Dip Occurrence of error (out of 30) Time Sensor Cost
reliable measurements of dip and dip direction in most
7. Conclusions situations. There is no case to argue that contact
 technologies are more or less relaible than non-contact
 This paper presents a systematic comparison of meas- technologies. Hardware and software have advanced
urements of geological features (i.e. dip and dip direc- very rapidly over the last decade and have initiated a new
tion) taken by different technologies and sensors. Two era of 3D mapping. Proximity remote sensing methods
different smartphones were used to take contact measure- provide added benefits such as keeping the user safe and
ments by placing the device on the features. Images were providing more data in an automated way. Virtual models
collected using different sensors and different platforms can be stored on devices for record keeping and there is
including a low-cost camera module, two smartphones, no need to go back to take additional measurements.
an off-the-shelf UAV and a DSLR. The acquired image There is no doubt that these technologies will offer new
sets were processed using Agisoft Metashape to obtain and even better possibilities in the future at even lower
virtual high-resolution 3D models. The 3D models were cost.
analysed in CloudCompare to derive measurements of
the same features. All measurements were compared References
against measurements taken by a conventional geological
compass. [1] Clar, E., “A dual-circle geologist’s and miner’s compass for the
 measurement of areal and linear geological elements”, Separate
 From the results it can be seen that most of the meth-
 print from the negotiations of the Federal Institute of Geology Vi-
ods were generally found to be acceptably reliable. Of the enna, Vol. 4, 1954
results from the smartphone applications, that of the iPh- [2] Diggelen, F. V., Enge, P. “The world’s first GPS MOOC and
one 4 (an older generation) was more unreliable. It pro- Worldwide Laboratory using Smartphones”, Proceedings of the
 28th International Technical Meeting of The Satellite Division of
vided inaccurate dip direction due to the device con-
 the Institute of Navigation, pp. 361–369, 2015
stantly requiring calibration. Generally, the dip angle was [3] Allmendinger, R. W., Siron, C. R., Scott, Chelsea P. “Structural
approximated better than the dip direction for both de- data collection with mobile devices: Accuracy, redundancy, and
vices tested. Further the results suggest that the error in best practices”, Journal of Structural Geology, 102, 98–112, 2017
 [4] Djuric, U., Dragana, P., Marjanovic, M., Kuzmic, P. “Portable Ge-
the dip angle is not affected by whether the device is ori- otechnics – Using Android Smartphones and Tablets for Geotech-
ented in portrait or landscape on the face, or whether it is nical Field Investigations”, Proceedings of the International Mul-
placed on a backing block, or directly against the rock. tidisciplinary Scientific GeoConference SGEM. pp. 513–520,
The error in dip direction is also unaffected by the use of 2013
 [5] Farny, N. J. “Comparing Rock Discontinuity Measurements Us-
a mounting block, but it does seem that the error is re- ing Geological Compass, Smartphone Application, and Laser
duced when the device is oriented in landscape position. Scanning Methods”, Environmental & Engineering Geoscience,
 All photogrammetric sensors tested performed rela- XXIII(2), pp. 97–111, 2017
tively well. Generally, the measurements were more ac- [6] Lee, S., Suh, J., Park, H. D. “Smart Compass-Clinometer: A
 smartphone application for easy and rapid geological site investi-
curate for the dip angle than the dip direction. As ex-
 gation”, Computers & Geoscience, 61, pp. 32–42, 2013
pected, the highest resolution camera, the Canon 100D [7] Weng, Y-H., Sun, F-S., Grigsby, J. D. “GeoTools: An android
produced the most accurate measurements when com- phone application in geology, Computers & Geosciences, 44, pp.
pared to the geological compass. On average 90% of the 24–30, 2012
 [8] Haneberg, W. “Using close range terrestrial digital photogramme-
points measured for the dip angle fell in the less than try for 3-D rock slope modeling and discontinuity mapping in the
three degree error category. 70% of points measured for United States”, Bulletin of Engineering Geology and the Environ-
dip direction had less than three degree error. This trend ment, 67(4), pp. 457–469, 2008
was uniform across all photogrammetric models. It was [9] Assali, P., Grussenmeyer, P., Villemin, T., Pollet, N., Viguier, F.
 “Surveying and modelling of rock discontinuities by terrestrial la-
also found that the measurements from the model built ser scanning and photogrammetry: Semi-automatic approaches
from the images taken with the Moto G5 had roughly the for linear outcrop inspection”, Journal of Structural Geology, 66,
same degree of error as the one taken from the Canon pp. 102–114, 2014
100D model yet the retail price is less than half the price. [10] Smith, M. W., Carrivick, J. L., Quincey, D. J. “Structure from mo-
 tion photogrammetry in physical geography”, Progress in Physi-
Even more impressive was the performance of the Rasp- cal Geography, 40(2), pp. 247–275, 2016
berry Pi, being the cheapest sensor tested, with an 83% [11] Thoeni, K., Giacomini, A., Murtagh, R. K., Kniest, E. “A Com-
less than three degree error for dip angle and 66% less parison of Multi-view 3D Reconstruction of a Rock Wall using
than three degree error for dip direction. The accuracy Several Cameras and a laser scanner”, The International Archives
 of the Photogrammetry, Remote Sensing and Spatial Information
was slightly lower, but the cost is significantly different Sciences, XL-5, pp. 573–580, 2014
meaning the Raspberry Pi was a viable option. Further- [12] Lato, M.J., Vöge, M. “Automated mapping of rock discontinuities
more, the GPS model produced from the Phantom UAV in 3D LiDAR and photogrammetry models”, International Jour-
had 83% less than three degree error for dip angle and nal of Rock Mechanics and Mining Sciences, 54, pp. 150–158,
 2012
73% less than three degree error for dip direction. This is [13] Sturzenegger, M., Stead, D. “Quantifying discontinuity orienta-
a very promising results indicating that low-cost off-the- tion and persistence on high mountain rock slopes and large land-
shelf UAVs might be suitable for geostructural mapping slides using terrestrial remote sensing techniques”, Natural Haz-
applications. The major advantage of such platforms is ards and Earth System Sciences, 9, pp. 267–287, 2009
 [14] Thiele, S. T., Grose, L., Samsu, A., Micklethwaite, S., Vollgger,
also the ease of use and the benefit of achieving vantage S. A., Cruden, A. R. “Rapid, semi-automatic fracture and contact
points which would not otherwise be possible. mapping for point clouds, images and geophysical data”, Solid
 Overall, there is not much difference between the Earth, 8, pp. 1241–1253, 2017
different technologies, and certainly, the performance is [15] Westoby, M. J., Brasington, J., Glasser, N. F., Hambrey, M. J.,
 Reynolds, J. M. “‘Structure-from-Motion’ photogrammetry: A
not directly proportional to price. Both contact and non- low-cost, effective tool for geoscience applications”, Geomor-
contact technologies appear to be capable of giving phology, 179, pp. 300–314, 2012
[16] Aguera-Vega, F., Carvajal-Ramirez, F., Martinez-Carricondo, P.,
 Sanchez-Hermosilla Lopez, J., Mesas-Carrascosa, F. J., Garcia-
 Ferrer, A., Perez-Porras, F. J. “Reconstruction of extreme topog-
 raphy from UAV structure from motion photogrammetry”, Meas-
 urement, 121, pp. 127–13,8 2018
[17] Bemis, S. P., Micklethwaite, S., Turner, D., Bangash, H. A.,
 James, M. R., Akcize, S., Thiele, S. “Ground-based and UAV-
 Based photogrammetry: A multi-scale, high-resolution mapping
 tool for Structural Geology and Paleoseismology”, Journal of
 Structural Geology, 69, pp. 163–178, 2014
[18] Kong, D., Saroglou, C., Wu, F., Sha, P., Li, B. “Development and
 application of UAV-SfM photogrammetry for quantitative char-
 acterization of rock mass discontinuities”, International Journal
 of Rock Mechanics and Mining Sciences, 141, 104729, 2021
[19] Thoeni, K., Guccione, D. E., Santise, M., Giacomini, A., Roncella,
 R., Forlani, G. “The potential of low-cost RPAS for multi-view
 reconstruction of sub-vertical rock faces”, The International Ar-
 chives of the Photogrammetry, Remote Sensing and Spatial Infor-
 mation Sciences, XLI-B5, pp. 909–916, 2016.
[20] Tscharf, A., Rumpler, M., Fraundorfer, F., Mayer G., Bischof, B.
 “On the use of UAVs in mining and archaeology – geo-accurate
 3D reconstruction using various platforms and terrestrial views”,
 ISPRS Annals of the Photogrammetry, Remote Sensing and Spa-
 tial Information Sciences, II-1/W1, pp. 15–22, 2015
[21] Santise, M., Thoeni, K., Roncella, R., Sloan, S. W., Giacomini, A.
 “Preliminary tests of a new low-cost photogrammetric system”,
 The International Archives of the Photogrammetry, Remote Sens-
 ing and Spatial Information Services, XLII-2/W8, pp. 229–236,
 2017
[22] Tannant, D. D. “Review of Photogrammetry-Based Techniques
 for Characterization and Hazard Assessment of Rock Faces”, In-
 ternational Journal of Georesources and Environment, 1(2), pp.
 76–87, 2015.
[23] Thoeni, K., Santise, M., Guccione, D. E., Fityus, S., Roncella, R.,
 Giacomini, A. “Use of low-cost terrestrial and aerial imaging sen-
 sors for geotechnical applications”, Australian Geomechanics
 Journal, 53(3), pp. 101–122, 2018
[24] Agisoft Metashape (2021). Version 1.7.2. Available at:
 http://www.agisoft.com [Accessed: 17 May 2021]
[25] CloudCompare (2021). Version 2.11.3 Available at:
 http://www.danielgm.net/cc [Accessed: 17 May 2021]
You can also read