Defy winter: breakthrough in road damage prevention
←
→
Page content transcription
If your browser does not render page correctly, please read the page content below
Akzo Nobel Industrial Chemicals B.V.
Salt

Defy winter:
breakthrough in road
damage prevention
Short research report, 2013

February 10, 2014
E.R. de Jong & R.L.M. Demmer, Akzo Nobel Industrial Chemicals B.V.
M. Skakuj & H. Balck, HELLER Ingenieursgesellschaft
Professor M. Stöckner, Steinbeis Transfer Centers GmbH – Karlsruhe University of applied Science Transfer
Center for Infrastructure Management in Transportation Engineering
Defy winter: breakthrough in road damage prevention                  02

Contents
Defy winter: breakthrough in road damage prevention             3
ABSTRACT                                                        3
1.   Introduction                                               4
1.1. What is raveling?                                          4
1.2.   What is cracking?                                        5
1.3.   Test partners                                            6
2.     Experimental design                                      6
2.1.   Research Objectives                                      6
2.2.   Road selection, additive dosing and spreading actions.   7
2.3.   Detailed Pavement Analysis                               8
3.     Results and discussion                                   11
3.1.   What influences the propensity to raveling?              13
3.2.   Ecosel®AsphaltProtection reduces raveling 30-80%         16
3.3.   Pavement lifetime extension                              18
4.  Conclusions                                                 19
5.  Further research                                            19
6.  Acknowledgements                                            19
REFERENCES                                                      20
Defy winter: breakthrough in road damage prevention                                                              03

Defy winter: breakthrough in road damage prevention
E.R. de Jong & R.L.M. Demmer
Akzo Nobel Industrial Chemicals B.V., Amersfoort, the Netherlands
ed.deJong@akzonobel.com
***
M. Skakuj & H. Balck
HELLER Ingenieursgesellschaft, Darmstadt, Germany
marek.skakuj@heller-ig.com
***
Professor M. Stöckner
Steinbeis Transfer Centers GmbH – Karlsruhe University of applied Science Transfer Center for
Infrastructure Management in Transportation Engineering, Karlsruhe, Germany
markus.stoeckner@stw.de
***

ABSTRACT
It is a widely recognized fact that winter weather causes damage to asphalt roads [1; 2; 3]. Repeated
freeze-thaw cycles greatly reduce the cohesion of asphalt mixtures causing raveling and cracks to occur,
which leads to accelerated deterioration of the road surface in general. This in turn leads to significant
expenditure on (ad hoc) road repairs and potentially entails consequent safety issues due to pothole
formation. For example, it costs the Dutch and Danish Road Authorities each about €25 million annually.

AkzoNobel has developed a genuinely ecological and economically sustainable solution to this problem:
Ecosel®AsphaltProtection. In collaboration with the national road authorities in the Netherlands, Denmark,
and Sweden, as well as the Austrian state of Tyrol, AkzoNobel has tested an eco-sustainable product that
can be added to liquid NaCl de-icing brine.

As water freezes, its volume expands (ca. 9%) as it transforms from liquid water into hard ice. Water
trapped inside asphalt pores and cracks therefore break up the asphalt, while surface damage is further
accelerated by passing traffic. Ecosel®AsphaltProtection prevents hard ice formation and makes the ice
slushy. The slushy or brittle ice is mechanically weaker than the asphalt and is therefore unable to cause
any damage to it.

Based on high-resolution photographic data obtained from testing 900 kilometers of asphalt pavement,
independent engineering firm HELLER and Prof. Stöckner, who specialize in detailed pavement
assessment and pavement constructions, respectively, determined in a preliminary study, that sections
treated with additive showed 30-80%, less frost damage with the additive concentration representing only
0.7% of the total deicer amount spread. This could imply a tremendous saving on the asphalt maintenance
expenditure. If the presented results are to be interpreted in terms of pavement lifetime extension, they will
have to be confirmed in further studies.
Defy winter: breakthrough in road damage prevention                                                               04

1. Introduction
Under wintry weather conditions various de-icing methods are applied in order to ensure safe traffic
conditions. On the one hand, it relates to a suitable pavement structure, while on the other hand, it relates
to the asphalt surface layers. Winter conditions and the use of deicers leads to the early deterioration of the
surface asphalt layers, with raveling or cracking being the type of damage most observed. This paper
discusses the phenomenon of frost damage to pavements caused by volume expansion of water inside the
asphalt when it freezes. Preventing frost damage is of course best achieved if water inside the pavement
structure, especially in the surface layer, does not freeze at all. Ice formation can occur at different depths
of the surface layer, leading to considerable pressure. This results in damage such as raveling and rutting.
For environmental reasons, however, increasing the amount of salt is not the solution. Other technologies
have to be found in order to solve the problem of early deterioration during the winter season.

The presence of deicer on the roads is apparently not enough to depress the freezing point of water inside
the asphalt sufficiently to prevent frost damage. As the Van’t Hoff law states that freezing point depression
can only be achieved with high concentrations of small ions, it is impossible to find any applicable salt more
effective at freezing point depression in the most interesting temperature range (0ºC to -20ºC) than Sodium
Chloride itself. Therefore, common deicers and other freezing point depressants cannot be a solution to this
problem.

Hence it was tested in a laboratory whether small amounts of additive could influence the freezing process
of ice. The initial, challenging property prerequisites of those additives were:

         Readily biodegradable, no environmental issues, no Biological or Chemical Oxygen Demand
         (BOD/COD) issues
         Safe for traffic: no skidding issues, no opacity of windshields, no blockage of water drainage on
         porous asphalt

Various additives were identified that were able to keep ice in a slushy state at temperatures far below the
freezing point of brine. Moreover, it was observed that even at lower temperatures the frozen brine turned
opaque instead of remaining clear and transparent. This indicates that there are many more ice (and
dihydrate) crystals formed than without additive. The current hypothesis is that smaller crystals are unable
to exert a high mechanical force on the pavement materials, resulting in less frost damage. This paper
neither supports nor disproves this hypothesis, but it shows that the chosen additive combination is
effective against pavement distress under wintry conditions.

1.1. What is raveling?
Asphalt material is composed of two materials with very different properties: aggregate, filler and bitumen.
Bitumen ensures the cohesion of the asphalt mastics. The aggregate ensures the load transfer and the skid
resistance of the pavement’s surface. In total, the asphalt should have the required bearing capacity and
surface conditions. If the bond between the aggregate and bitumen is weakened, individual stones can be
released from the pavement surface. This process of material loss and raveling increases with aged
asphalt, but it is also influenced by traffic and the asphalt production process. Furthermore, repeated
freezing and thawing (thus expansion and contraction) of water inside asphalt pores induces considerable
mechanical stress at the interface between the stone aggregate and the bitumen, thereby leading to
cracking and/or material loss. As a long-term result, the material loss eventually leads to potholes,
Defy winter: breakthrough in road damage prevention                                                                     05

endangering traffic safety and the asset value of the roads or road networks. The material loss generally
only occurs at the pavement surface, but depending on the void content of the asphalt (i.e. porous asphalt
types for noise reduction and enhanced drainage purposes) it can also affect the cohesion of the inner
asphalt.

Figure 1 – Examples of light, medium and heavy raveling (from right to left). These are defined as single-stone loss,
multiple-stone loss and rough surface, and large areas of intensive stone-loss, respectively.

1.2. What is cracking?
Under the influence of heavy loads pressing down on the asphalt surface, cracks can occur inside the
asphalt, starting at the bottom of the asphalt layer. Within time, these cracks reach up to the top layer. The
deterioration mechanism is material dependent and cracks can also start on top of the layer. Either way,
temperature changes influence the cracking enormously. Temperature changes and gradients additionally
induce repeated stress and contraction of the pavement layers, causing the asphalt to tear at its weakest
points. In some cases cracks can weaken the asphalt to such an extent that potholes are formed.
Defy winter: breakthrough in road damage prevention 06
Figure 2 – Crack formation process, that can Figure 3 – The participating countries and test locations. At each
eventually lead to a pothole location two lanes were evaluated on the reference and additive
side, amounting to approximately 900 kilometers of pavement
surface.
1.3. Test partners
A previous full-scale field test on the M52 highway in Denmark during the winter season of 2011-2012 has
qualitatively shown that the additive substantially reduced frost damage (more than 50%). The first test was
extended in the winter season of 2012-2013 to four other European countries.
Country Partner Road Section
Denmark Vejdirektoratet M52 Kolding – Holsted
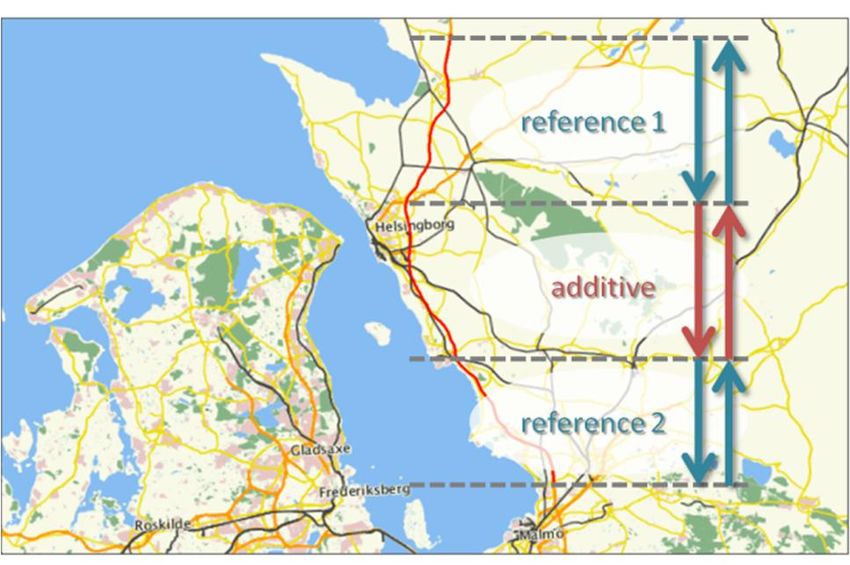
Sweden Trafikverket & Mesta E6 Lomma – Hjärnarp
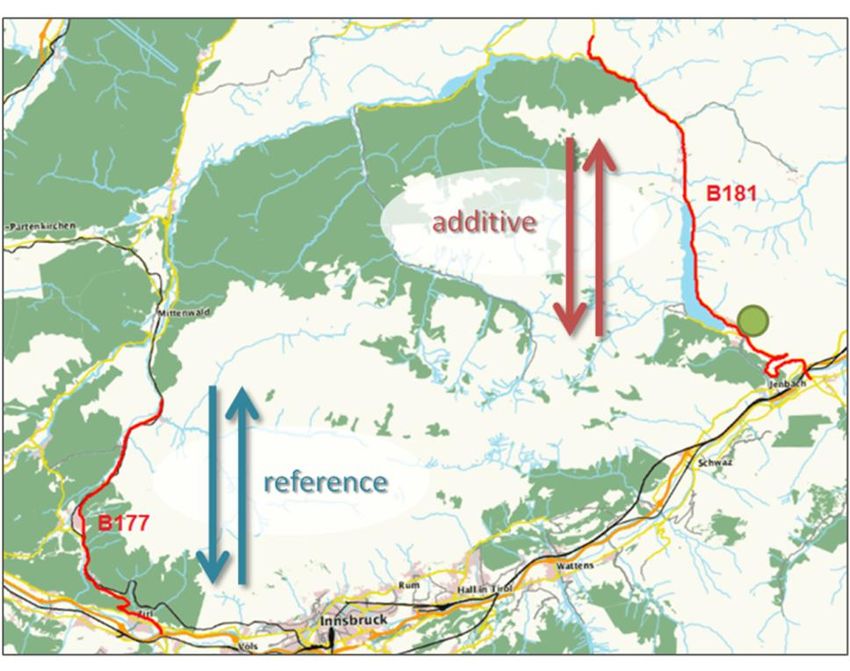
Austria State of Tyrol B177 Zirl – Scharnitz
B181 Wiesing – Achenpass
The Netherlands Rijkswaterstaat A58 Vlissingen – Markiezaat
2. Experimental design
2.1. Research Objectives
The test had the following objectives:
Quantitatively measure the additive’s ability to reduce frost damage to asphalt in the form of
raveling and cracks.
Quantitatively determine the relationship between raveling and:
o Pavement materials
o Pavement age
o Traffic density
o Weather (number of frost-thaw cycles)
Determine the additive’s effect on the above relationships.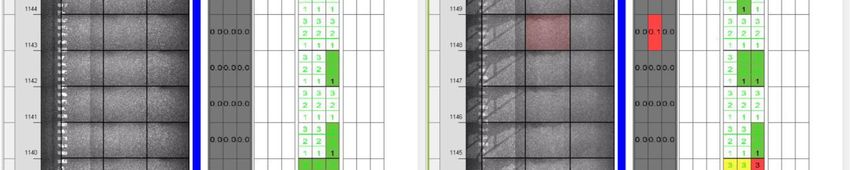
Defy winter: breakthrough in road damage prevention                                                                     07

2.2. Road selection, additive dosing and spreading actions.
Together with the local road authorities, roads were selected subject to strict requirements:

         Pavement in intermediate condition: frost damage is to be expected so the additive is truly
         challenged, but the condition should not have too much heavy initial raveling so that the potential
         effect of the additive can actually be observed.
         Each road should have a reference and an additive section that:
             o are strictly, physically separated
             o have very similar pavement structure and age distributions
             o have identical traffic load and weather conditions, and
             o have identical de-icing regimes.

The additive is a liquid comprising of multiple ingredients, each of which is fully soluble in Sodium Chloride
brine. It leaves no sediments and thus has no adverse effect on the spreading action or the equipment. As
all test partners use pre-wetted spreading as the de-icing method, the additive was accurately dosed into
the brine component from IBC containers using an accurate dosing system. As all partners used different
spreading ratios (solid salt / brine), the dosing rate was adapted to the local conditions so that the additive
represented exactly 0.7% of the total spread amount of de-icing composition.

The spreading actions were organized in such a way that no confusion of the spreading routes was
possible. Drivers always de-iced the same route using the same vehicle. For the four countries it was
arranged as indicated at Figure 4 through to Figure 7.

Figure 4 – M52 between Kolding and Holsted. Two
spreading trucks drove from spreading hub “Tankedal”
(indicated with the green circle) and onto the M52
direction Esbjerg. At Holsted they both returned to
Tankedal. Only one truck had the additive mixed into its
brine. In one direction truck A de-iced the main road and
truck B de-iced the exits and stopovers. In the opposite    Figure 5 – Highway E6 between Lomma and Hjärnarp.
direction they swapped tasks, therewith ensuring that       Each spreading truck was refilled in Helsingborg directly
additive was applied onto the main road only in one         after each action and returned to their bases near to the
direction.                                                  routes. Each truck de-iced their highway section in both
                                                            driving directions.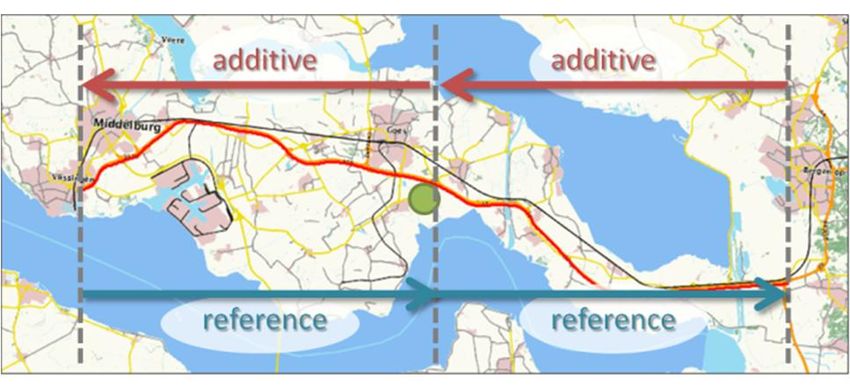
Defy winter: breakthrough in road damage prevention 08
Figure 7 – Measurement sections on highway A58
between Vlissingen and the Markiezaat junction in The
Netherlands. Four spreading routes departed from de-
icing hub “Vierwegen”, indicated by the green circle. The
two trucks covering the highway sections east from
Vierwegen and two trucks covering the sections west from
Vierwegen and working pairs, applied the same strategy
as the two trucks in Denmark (see Figure 4).
Figure 6 – B181 in Austria was de-iced with additives in
both directions from the hub at Maurach, indicated by the
green circle. B177 was the reference section. Both roads
are national roads (80-100 kph) connecting Germany and
Austria.
2.3. Detailed Pavement Analysis
In order to ensure the absolute objectivity of this research, HELLER conducted all measurements,
assessments and data analysis independently.
Data collection
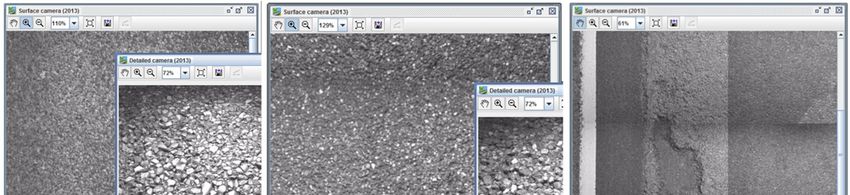
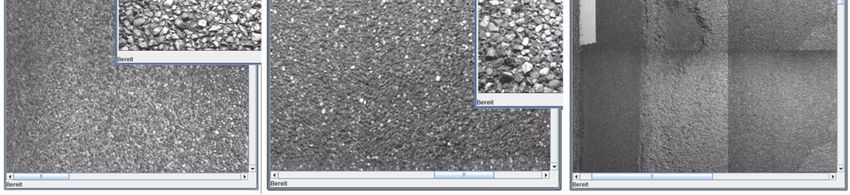
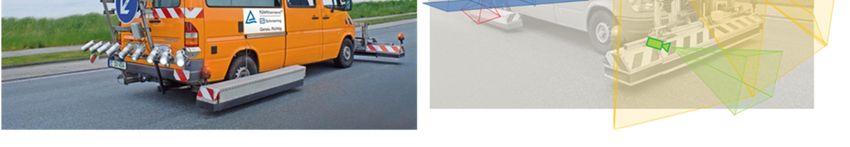
Subcontractor TÜV Rheinland Schniering carried out the pavement condition survey with their ARGUS III
vehicle, equipped with 8 cameras and other devices. The vehicle drove at 80-90 kph and collected pictures
using three high-speed and high-resolution cameras fitted at the rear. The pavement was lit with a
synchronized stroboscope for homogeneous illumination. All measurement campaigns were carried out
under excellent (dry) conditions, ensuring optimal image quality.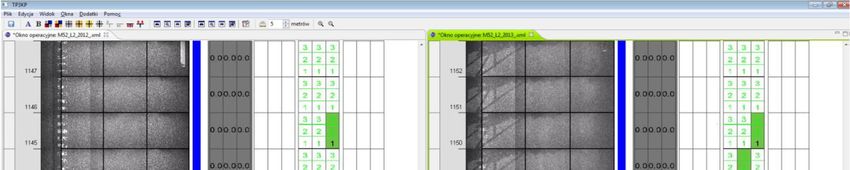
Defy winter: breakthrough in road damage prevention                                                                          09

Figure 8 – The ARGUS III vehicle, equipped with 8 high-resolution cameras, laser equipment for longitudinal and
transversal evenness and rutting measurements, GPS localization. The yellow and green front cameras give an
overview from different perspectives, the blue cameras record images that capture all pavement details and the red
camera captures an extreme zoom image from the rut.

The three cameras fitted at the rear provided pictures that were used for detailed assessment of the
pavement condition. These pictures were stitched together with zero gap and zero overlap as depicted in
Figure 9.

Figure 9 – The three cameras recorded the width of exactly one lane. These three images were stitched together and
connected with neighboring images along and across the driving direction with zero gap and overlap. The left hand
figure shows the coding strategy: the raveling is indicated in black and the images, to which this raveling is attributed,
are marked in red.

In order to quantify the effect of the additive, the pavement condition was assessed before and after one
entire winter season. All the images that amounted to 2 Terabytes of data were analyzed by a team of eight
experts at HELLER and the assessment took nearly four months to complete.

Data Analysis
                                           2
Every image (each approximately 1 m ) was coded for its raveling intensity. Four intensities were defined in
accordance with a standard developed at the Karlsruhe University of Applied Sciences. These intensities
are Zero, Light, Medium and Extreme, as described in paragraph 1.1. The images were qualitatively coded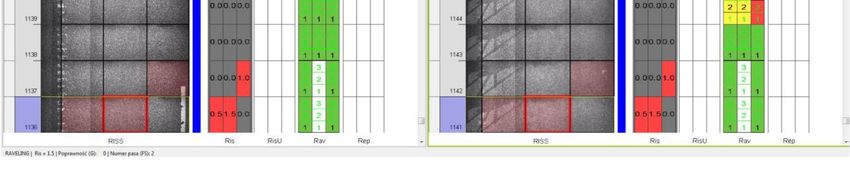
Defy winter: breakthrough in road damage prevention                                                              10

for raveling as depicted in Figure 9. They received a qualitative flag representing one of the raveling
intensities, regardless of how much of its surface area had raveled. This is further illustrated in Figure 10.

Figure 10 – Two measurement campaigns (before and after winter) compared. Each square meter is coded either
blank, green, yellow or red, corresponding to zero, light, medium and extreme raveling. Each dataset can be
reassessed if necessary, also the first campaign. Every change is logged with its time stamp.

Similarly, each image was coded for the presence of cracks and the crack length, which was measured
precisely (±10 cm) using a dedicated software tool.

In order to compare quantitatively the pavement condition before and after the winter, data were
aggregated into groups with an exact length of 50 meters. Each 50 meter section described an areal
               2 2
percentage (m /m ) of each of the four raveling categories.

Synchronization
Comparing the same position before and after the winter required extremely accurate synchronization of
the position of each picture. The automatic GPS tag for every picture was not accurate enough. Moreover,
on a total distance of many kilometers, the number of pictures in both campaigns could differ slightly.
Therefore the exact position was also reassessed during analysis, using unambiguous details from the
pictures. These details were given an accurate position and the datasets were then synchronized.
Consequently, it was very likely that the unambiguous details mentioned earlier, were not in exactly the
same position on a picture before and after the winter. However, the images were never shifted more than
50 cm and aggregation of data almost completely eliminates errors in quantification of raveling per 50 meter
section.
Defy winter: breakthrough in road damage prevention 11 Subjectivity eliminated As the image analysis was performed by humans, it was by definition a subjective process. However, 60% of all data have been analyzed at least twice by two different operators. The two assessments per 50 meter section were recorded and compared. Road sections that showed a standard deviation larger than 5% on this comparison were discarded and reassessed entirely. The operators were also regularly shown calibration images, without the operators actually knowing that they were shown calibration images. If the assessment was significantly different from what it should have been, their assessment was checked and discarded if necessary. In other words, the degree of subjectivity was quantitatively measured and it was concluded that it had no significant influence on the data interpretation. 3. Results and discussion Four field tests in four different countries were arranged. At every location two surveys were carried out: one in late November 2012 and one early in April 2013. In all locations the winter started in December and lasted until early April. At each location, one highway section acted as a reference (conventional pre-wetted spreading) and one highway section acted as the test section and was treated with additive along with pre- wetted spreading. The raveling development between the two surveys on the additive section was compared with the development on the reference section in order to draw a conclusion regarding the effect of the additive. For each highway lane, the raveling was analyzed as described in paragraph 0. The surface area fraction (% m 2/m2) corresponding to each of the four raveling intensities was plotted as a bar graph per 50 meter section, as illustrated in Figure 11. During winter, raveling can increase from Zero to Light, Zero to Extreme, Medium to Extreme, etc. Figure 12 provides an excerpt of both surveys and all possible changes in raveling are plotted as an areal percentage. Cracking turned out to be a parameter that was impossible to study. At somewhat elevated temperatures, asphalt is a plastic material. It deforms more easily and it can expand or shrink with temperature fluctuations. It was observed that many smaller cracks “disappeared” during the experiment. Obviously, cracks do not self-repair, but volume expansion of the asphalt can push the two physically separated slabs of asphalt together, therewith making it appear as if the crack had disappeared. Therefore visual assessment does not realistically represent the number and length of observed cracks. This effect distorted analysis to such an extent that no conclusions were drawn with respect to cracks.
12

                                                      Figure      12    –
                                                      Excerpt (ca 12
                                                      km)      of     the
                                                      aggregated data
                                                      from Denmark.
                                                      This           data
                                                      corresponds to
                                                      the fast lane of
                                                      the      reference
                                                      section. Each bar
                                                      corresponds to
                                                      the data from of
                                                      one 50 meter
                                                      section.       The
                                                      blue, yellow and
                                                      red bars on the
                                                      second row show
                                                      the light, medium
                                                      and        extreme
                                                      raveling before
                                                      the winter. The
                                                      third row shows
                                                      the raveling after
                                                      the winter. All
                                                      purple bars on
                                                      the rows below
                                                      that show all
Defy winter: breakthrough in road damage prevention

                                                      raveling
                                                      development,
                                                      with the first one
                                                      being the change
                                                      from     zero-light
                                                      raveling.
                                                      Figure     11     –
                                                      Detailed example
                                                      of a raveling bar
                                                      plot, taken from
                                                      the slow lane on
                                                      the      reference
                                                      side in Denmark.
                                                      The vertical axis
                                                      is truncated at
                                                      50% raveling, so
                                                      that       smaller
                                                      changes         are
                                                      visible as well.
Defy winter: breakthrough in road damage prevention 13
3.1. What influences the propensity to raveling?
Among many factors that affect the rate at which raveling develops, the following were expected to have
the most influence:
1. AGE : pavement age
2. TYPE : asphalt type
3. LANE : lane (fast or slow lane)
4. INIT _RAV : initial raveling (present at the start of the experiment)
5. COUNTRY : traffic density (vehicle count & load)
: weather (specifically the number of freeze-thaw cycles)
6. TREATMENT : reference or additive
It is important to study each of these parameters before drawing conclusions about the efficacy of the
additive.
As traffic density and weather are local parameters, it was decided to strictly separate the analysis of each
country as far as the additive was concerned. This eliminated the effect of local circumstances without
jeopardizing the value of the experiment, because variations in circumstances for each country were
negligible over the whole set of 50 meter sections. Austria may be an exception though, due to the
selection of roads and differences in traffic intensity for example. Hence, the results from Austria must be
interpreted with caution.
The size of the dataset (approximately 15,000 50 meter sections) allowed statistical analysis of each factor
mentioned earlier. It was possible to assess the influence of each factor separately by comparing a
reference set and additive set of sections in pairs while keeping all other factors constant. However this
proved to be very laborious. Therefore it was decided to perform statistical analysis in order to
simultaneously assess the influence of multiple factors. The analysis was conducted by K. Opara (Polish
Academy of Sciences). It was divided into two steps in order to increase the accuracy of the results. First,
the probability that raveling occurs at all in a 50 meter diagnostic section was determined by means of
logistic regression. Next, for those sections that showed increased raveling, the rate of raveling
development was determined using a multiplicative model. Both models are variants of linear regression
where the response variable is transformed either by a logit function or by a logarithmic one. After fitting the
model and applying inverse logit or inverse exponential, it was possible to analyze the influence of different
factors. For instance in the multiplicative model, as shown below in simplified form, each of the above
parameters affected the raveling probability with a specific multiplication factor b that depended on the
value of that particular parameter (e.g. b1 is different for old and new asphalt). Each section was given a
random error, expressed by .
P(RAV) = eb1.AGE . eb2.TYPE . eb3.LANE . eb4.INIT_RAV . eb5.COUNTRY . eb6.TREATMENT . e
Each influence was expressed as an exponential, because for every possible set of parameters the
response of the raveling probability is not normally distributed, but had the shape of exponential decay. The
model fitted well, but explained only 32% of the variability of the raveling probability (the rest was explained
by the random factor e ), this only affected the accuracy with which the influence of each parameter was
quantified. Finally, both logistic and multiplicative model results were merged to obtain an overall influence
of each parameter. More details about the statistical model can be obtained upon request [4].Defy winter: breakthrough in road damage prevention 14 All data for each of the parameters was supplied by the collaborating authorities and the research was based only on those sections for which all parameters were accurately known. Influence of lane, pre-existing raveling and asphalt type It is known that the slow lane is more prone to raveling than the fast lane. This is due to the larger number and load sizes of the vehicles normally using the slow lane. This effect could be consistently observed on all test sections except in Austria (no fast lane available). The influence of this parameter was separated from the others and as expected, Figure 13 shows that on the fast lane, raveling develops at only 34% of the rate at the slow lane. Figure 13 – The influence of lane Figure 14 – The influence of Figure 15 – The influence of (traffic) on the raveling asphalt type on the raveling existing raveling on the raveling probability. probability. probability. For each parameter one category was selected to act as a reference and the graphs were all normalized to the raveling probability of that category. The error bars in the graphs indicate the 95% confidence intervals for each reported value. The influence of asphalt type was derived the same way (Figure 14). The sections on the four locations came to a total of 20 different types. Hence three main categories were created: PA - porous asphalt, AC - asphalt concrete and SMA - stone mastic asphalt. In line with the practical experience, porous asphalt ravels faster. Bear in mind that 98% of the porous asphalt was located in the Netherlands, which means that those two variables are highly correlated. This implies that the statistical fitting procedure is not capable of deciding the extent to which the increased raveling was due to the country, and which was due to the asphalt type. This problem is known as collinearity and usually results in one parameter being underestimated, while the other is overestimated, but the sum of the two being correct. Moreover, the confidence intervals showing the accuracy of the estimation for collinear parameters are typically very wide.
Defy winter: breakthrough in road damage prevention                                                                     15

Collinearity was also the reason that traffic intensity and weather conditions were not introduced directly
into the model.

Initial raveling also influences the rate at which it develops (Figure 15). If a couple of percent of a specific
surface is raveled, its raveling probability is five times higher (44%) than without initial raveling.

Influence of pavement age and country
The sections were constructed between 1985 and 2012 and therefore age was categorized in increments of
5 years. As one might expect, Figure 16 shows a clear trend for raveling dependency with asphalt age: the
older the road surface, the more sensitive it is to frost damage. The age category 15-20 years, however,
shows collinearity with Denmark (most of the sections on the M52 fell in that age category). The light
colored bar indicates what could be roughly anticipated.

Similarly, the raveling probability in the Netherlands is a few hundred percent higher than in the other
countries. Most likely it is overestimated at the expense of underestimated influence of the porous asphalt,
however it is not clear how to “correct” the collinearity problem in this case.

Figure 16 – The influence of pavement age on the raveling       Figure 17 – Influence of the measurement location
probability. One may adjust the 15-20 yrs category according    on the raveling probability. The adjustment in Figure
to the trend (light bar) due to collinearity issues.            16 greatly affects the raveling probability in
                                                                Denmark.

The country parameter could be considered as a container of several parameters, such as weather and
traffic and other influences that have not yet been considered. It clearly showed that circumstances differ
between the countries and that one cannot simply compare results from one country with the other,
regardless of similarities in age, type, etc, without fitting the model with this parameter. The collinearity
mentioned earlier for sections in Denmark in the age group of 15-20 years, had implications for the raveling
Defy winter: breakthrough in road damage prevention 16
probability reported for Denmark. Aligning the probability for that age category with the general trend
affected the probability for Denmark as plotted with the light-colored bar.
3.2. Ecosel®AsphaltProtection reduces raveling 30-80%
In order to provide the full picture, we first analyze the raveling development on reference and additive
sections based purely on experimental data. Subsequently we used statistical models to filter out the
influence of other variables and to observe the extent to which the differences between the sections could
be attributed solely to the influence of additives.
Notes:
legend indices 1 and 2 refer to the slow and fast lanes respectively.
index R refers to the direction as described in the table in section 1.3 and index L refers to the
opposite traffic direction. This is only relevant for Austria, where R and L have been treated the
same way.
indices “ref” and “add” refer to the section spread with and without additives, respectively.
Raveling development per country
Figure 18 shows how the raveling developed during the winter per lane in each country. In each country
(except Austria) two comparisons were made: reference sections vs. additive sections on either a fast or
slow lane. Each comparison clearly showed that the additive side shows substantially less raveling
development. In Austria, the results were shown separately for the right and left road sides, although they
have been treated the same way. This is to emphasize that both reference lanes suffered much more from
winter damage than the lanes on the additive side.
Figure 18 – Average raveling development in each country for two transitions (zero to light raveling and light to medium
raveling). FRTL: The Netherlands, Denmark, Sweden and Austria.
Bear in mind, however, that Figure 18 displays the raveling rate as a result of all combined influences
(asphalt type and age etc). It only shows a strong general trend in favor of the additive. In the next
paragraph the raveling reduction by the additive is (selectively) quantified.Defy winter: breakthrough in road damage prevention 17 The probabilities plotted in Figure 19, represent how often a certain areal percentage of a 50 meter section develops new raveling. Figure 19 – Raveling probability for the development of zero raveling to light raveling. The horizontal axis shows the raveling increase per 50 meter section (areal percentage, categorized in 5% increments), the vertical axis shows the normalized frequency at which this raveling increase is occurring. Many sections showed no raveling development, as shown in the left hand column in each graph. The higher the probability on the left of each graph, the less the pavement suffers from raveling. Two things are observed in the graph: (1) the left hand column (no new raveling) is always higher when using additive, and (2), the probability distributions are more left-skewed when using additive. Both observations mean that the additive effectively reduces the propensity to raveling.
Defy winter: breakthrough in road damage prevention                                                           18

Raveling probability modelled
As for the other parameters, the influence of the additive on the raveling propensity was determined by the
statistical modelling procedure. All raveling probabilities for the reference sections were set at 100% and
the probabilities on the additive side were reported as percentages of the reference probability. In each
country, the additive sections once again showed a clearly reduced raveling probability (Figure 20).
Although Sweden had the widest 95% confidence margins, the raveling was still reduced by 37%. Denmark
and Holland showed a 79% reduction of raveling and Austria (with caution) showed a 94% raveling
reduction.

Figure 20 – The influence of the additive on the probability of raveling, shown per country.

The values in Figure 20 are model fits assuming that the additive’s efficacy was not affected by other
parameters or local circumstances. This assumption will be tested and any necessary corrections from
earlier values that have been stated will be reported.

3.3. Pavement lifetime extension
Pavement performance depends on material and construction quality, traffic load, climate conditions and
M&R-Level [5; 6]. Pavement lifetime prediction models are very difficult to calculate at the object level.
Prediction models should deliver information about the anticipated, future pavement performance.
However, the accuracy of these models strongly influences the later decision-making process. The
calculations in the current EU models are being strongly debated, because:

         The time period for the observations, one winter period – is too short to derive model parameters
         for lifetime prediction models
         It is unsure which model should be used. With more data, recent efforts at Karlsruhe University of
         Applied Research may provide a solution.
Defy winter: breakthrough in road damage prevention 19 The current test sections seem to have a suitable length for this type of analyses, however longer term surveys are required for accurate lifetime modelling. 4. Conclusions A preliminary full-scale test in Denmark (2011-2012) already indicated significant reduction of the raveling rate when using the additive. All four experiments described in this paper confirm this trend. Ecosel®AsphaltProtection, when added to NaCl de-icing brine in a dosage level of 0.7% of the de-icing material that is spread, prevents on average 30-80% of the frost damage development in the form of raveling. The additive is effective on all asphalt types, regardless of age, or any pre-existing raveling. Moreover, the effect of each of the latter parameters on raveling probability was further quantified. Testing the additive with deicers other than NaCl was not within the scope of this experiment. 5. Further research As mentioned earlier, understanding the underlying mechanism(s) of frost damage and the effect of the additive is essential, certainly for further development and improvement of the additive. Different asphalt samples can be tested for their mechanical properties and stress-resistance with the focus on different air void content, different bitumen types, artificially aged materials and not least different climatic conditions. It is expected that the F-T-Test and mechanical stress tests such as the Cantabro-Test will concur with the actual, and encouraging, results and that these will give a valuable understanding of the underlying mechanisms related to frost damage and the effect of the additive. In order to develop a more accurate, holistic asphalt lifetime model, it is recommended that the current tests are continued for at least another season in order to obtain a longer term evaluation. 6. Acknowledgements The authors wish to sincerely thank all their partners for their innovative mindset and the active contributions they have made to this project. At every level in their organizations, we have experienced full cooperation and a hands-on approach that helped ensure maximum reliability of the results: Vejdirektoratet Denmark, Trafikverket Sweden and Mesta Sweden, Land Tirol Austria and the Dutch Rijkswaterstaat. Furthermore, the contributions made by the Vegagerdin Iceland, MOW Belgium and GDDKiA Poland on this project are very much appreciated. A special thanks to W. Maslow for his indispensable contribution to the development of the additive and K. Opara from the Polish Academy of Sciences for providing the statistically waterproof models and to Professor J. Mielniczuk for the valuable discussions concerning their interpretation.
Defy winter: breakthrough in road damage prevention                                                           20

REFERENCES
1.      Pavement distress and roadway damage caused by subsurface moisture and freezing
        temperatures: Case histories from Alaska. Tart, R.G. 2000, Journal of the Transport Research
        Board, Vol. 1709.
2.      Forschungsgesellschaft für Straßen- und Verkehrswesen e.V. -FGSV. Entstehung und Verhütung
        von Frostschäden an Straßen. s.l. : Kirschbaum, 1994.
3.      Centre de Recherches Routière, Belgium. Dégâts hivernaux des chaussées asphaltiques:
        Comment y remédier? Comment les éviter? CRR Bulletin. 18, 1994.
4.      HELLER Ingenieurgesellschaft mbH. Observation of the Development of Pavement Damages Over
        the Winter - Field Experiment 2012/13. Darmstadt, Germany : s.n., 2013. .
5.      Porous Asphalt Raveling in Cold Weather Conditions. Huurman et al., M. 2010, International
        Journal of Pavement Research and Technology.
6.      Development of pavement performance models to account for frost effects and their application to
        mechanistic-empirical design guide calibration. Puccinelli, J. and Jackson, N. 2007, Journal of the
        Transportation Research Board, Vol. 1990.
You can also read


