Modification of sodium bicarbonate and its effect on foaming behavior of polypropylene
←
→
Page content transcription
If your browser does not render page correctly, please read the page content below
e-Polymers 2021; 21: 366–376
Research Article
Dan Luo, Xianglin Pei*, Hai Fu, Xin Yang, Siyu Long, Linyu Zhang, and Wei Gong*
Modification of sodium bicarbonate and its effect
on foaming behavior of polypropylene
https://doi.org/10.1515/epoly-2021-0032
received February 07, 2021; accepted March 26, 2021
1 Introduction
Abstract: As a potential physical blowing agent, sodium In recent years, facing the increasing demand for foaming
bicarbonate (SB) is environmentally friendly and low in agents in the plastic industry, such as polyisocyanurate-
cost, but its low decomposition temperature cannot meet polyurethane (PIR-PUR) foams for insulations construc-
the requirements of polyolefin foam materials. Herein, for tions in wall panel (1) and application of polyurethane
enhancing the thermal properties of SB, a modified way foams (RPUF) in flame retardant (2), and environmental
was offered to fabricate various SB-based capsules via problems caused by the reduction of natural resources
suspension polymerization. As the modified SB-based cap- or the increase of organic waste gas emissions, higher
sules, epoxy resin (EP) accompanied with several organic requirements are put forward for the selection and use
acids was successfully coated on the surface of SB, serving of foaming agent. The foaming agent is a significant com-
as heat-insulation layer of SB. Various physicochemical ponent in the synthesis of foaming materials, such as the
characterizations provided reliable evidences for the good commonly used foaming agent of azodicarbonamide (AC)
coating effect, and the thermal performance of the modified and sodium bicarbonate (3). AC foaming agent could gene-
SB was improved. Further, the composite SB capsules were
rate a large amount of gas, making it widely used in
applied for the foaming of polypropylene (PP), and the
diversiform applications (4,5). But AC produces a lot of
foaming behavior of the SB-based capsules in PP was sig-
unpleasant nitrogen-containing compounds during foaming
nificantly improved, with more uniform distribution, smaller
process, as well some toxic residue, which would pollute the
cell diameter, and higher cell density. In all, this work fully
environment. As a contrast, SB has the advantages of large
proved that the coated shells enhanced the thermal proper-
gas generation and is cheap, easy to obtain, and environ-
ties of SB, and the modified SB capsules significantly
ment-friendly (6). At the same time, the gas produced by SB
improved the foaming quality of foamed PP.
decomposition is accessible to dissolve and diffuse in the
Keywords: sodium bicarbonate, epoxy resin, thermal polymer matrix, which has attracted wide attention to the
properties, polypropylene, foaming behavior fields of foaming materials due to its advantageous proper-
ties. But bottlenecks have emerged, the low decomposition
temperature and wide decomposition temperature range of
sodium bicarbonate could lead to the plasticizing effect of
* Corresponding author: Xianglin Pei, School of Materials and
foam in polymer (7), which further limit its applications in
Architectural Engineering, Guizhou Normal University, Guiyang
550025, China; Guizhou Functional Polymer Materials Science and the foaming area. Therefore, the research to improve the
Technology Innovation Talent Team, Guiyang 550025, China, thermal performance of SB is the key problem to solve its
e-mail: xianglinpei@163.com engineering application.
* Corresponding author: Wei Gong, School of Materials and In terms of improving thermal properties of SB, some
Architectural Engineering, Guizhou Normal University, Guiyang
researchers have proved that the thermal properties of SB
550025, China; Guizhou Functional Polymer Materials Science and
Technology Innovation Talent Team, Guiyang 550025, China, could be effectively improved by increasing the shell on
e-mail: gongw@gznu.edu.cn the surface of SB. Yao et al. (7) also reported a modified
Dan Luo, Hai Fu: School of Materials and Architectural Engineering, SB coated with stearic acid (SA) by melting method and
Guizhou Normal University, Guiyang 550025, China; Guizhou found that the thermal properties of SB have been
Functional Polymer Materials Science and Technology Innovation
improved from 112.6°C to 146.9°C. Petchwattana and Cova-
Talent Team, Guiyang 550025, China
Xin Yang, Siyu Long, Linyu Zhang: School of Materials and
visaruch (8) reported a SB modified with citric acid (CA)
Architectural Engineering, Guizhou Normal University, Guiyang by method of high speed mixing; the results showed that
550025, China the decomposition temperature of the modified SB was
Open Access. © 2021 Dan Luo et al., published by De Gruyter. This work is licensed under the Creative Commons Attribution 4.0 International
License.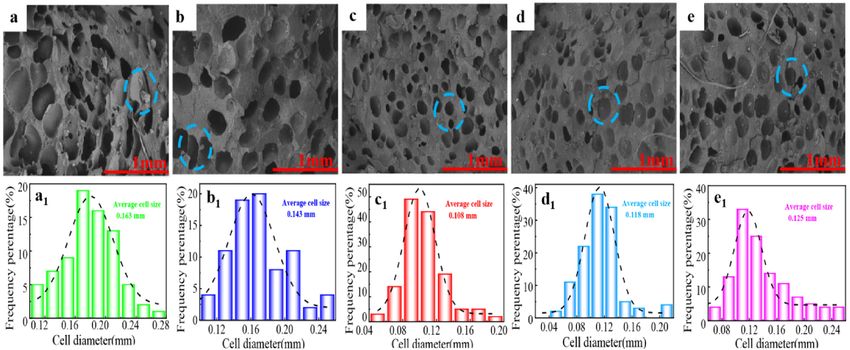
Modification of sodium bicarbonate and its effect 367
increased to 130°C. This method slightly increased the were produced by Petro-China Co., Ltd. Nanometer organic
decomposition temperature of SB, but the distribution montmorillonite (OMMT) was procured from Zhejiang
of CA on the surface of SB was not uniform. Cao et al. Fenghong New Material Co., Ltd.
(9) have investigated a modified SB coated with eruca-
mides solution and found that the initial decomposition
temperature of SB was raised from 115°C to 165.8°C, and
the decomposition temperature range narrowed from 61°C 2.2 Synthesis of the various SB-based
to 46.7°C after the modification. Although these methods capsules
can increase the decomposition temperature of SB, it
is still lower than the melting temperature of PP. PP is Firstly, SB was grinded with a ball mill and selected to
one of the most important general-purpose plastics with collect the size fraction below 400 meshes. 1 g of EP was
excellent mechanical properties, high-heat resistance, dissolved in 120 mL of ethyl alcohol and ultrasound
and excellent characteristics and is nontoxic, cheap, around 5 min to obtain homogeneous mixture. The mix-
and has been widely used in automobiles, home appli- ture of EP was placed in a 250 mL three-necked flask
ances, construction, and other fields (10–12). Based on equipped with a magnetic stirrer; the flask was placed
these considerations, it is of great significance to explore in an oil bath. Sodium bicarbonate (5 g) was added into
new modification methods and to improve the decompo- the above solution and stirred for 20 min at room tem-
sition temperature of SB and its application as a foaming perature. Subsequently, curing agent of TETA (10% mass
agent of polyolefin materials. fraction relative to EP), dispersing agent of SDBS, and
Epoxy resin is a kind of macromolecular thermo- catalytic agent of DMP-30 were dispersed in the above
setting polymer with good viscosity, thermal stability, and liquid and maintained to allow for 40 min at 40°C in an
mechanical strength accompanied, so it is widely used in oil bath. The mixture was then heated to 70°C and
various industrial fields such as adhesives and paints sequentially stirred for 6 h. (It is worth mentioning that
(13,14). In this paper, to improve the thermal properties the weight loss rate of pure sodium bicarbonate is 3.18%
of SB, epoxy resin with several organic acids was coated at 70°C for 6 h; therefore, the longer heat treatment time
on the surface of SB. The effect of surface modification of in the preparation process has little effect on the later
SB by EP and different organic acids on its thermal proper- preparation, as shown in Figure A1). Finally, the obtained
ties was systematically investigated, and the synthesized composite (EP@SB) was washed with deionized water
SB-based capsules were applied to the foaming of PP, and and ethanol and dried in an oven at 60°C for 48 h for
the foaming behavior of modified SB was further explored. later use.
This study not only conforms to the concept of environ- The CA was mixed in a 250 mL three-necked flask
mentally friendly materials, but also provides direction with 120 mL of ethanol, followed by the addition of the
guidance for the development of PP foaming products. nitric acid to adjust the pH to 2. The EP@SB composite
was added to the above mixed liquid. The solution was
kept stirring for 15 min to obtain homogeneous mixture at
room temperature and then heated to 70°C for 7 h. Finally,
2 Experimental the reaction was cooled at room temperature, and the
obtained composite (CA/EP@SB) was washed three times
2.1 Materials with ethanol and distilled water to remove impurities and
dried in an oven at 60°C for 48 h. Similarly, the experi-
Diglycidyl ether of bisphenol-A (epoxy value = 0.51 mol/100 g) ments were prepared with PA and SA compounds to obtain
epoxy resin and hardener of triethylenetetramine (TETA) the samples of PA/EP@SB and SA/EP@SB.
were procured from the Hindustan Ciba Giegy Ltd and
DMP-30 (2,4,6-tris(dimethy-laminomethyl)phenol) used as
curing aids were supplied by Shanghai Resin Company,
China. Absolute ethanol and sodium bicarbonate (AR) 2.3 Preparation of the foamed masterbatch
were obtained by Tianjin Damao Chemical Reagent and substrate
Company. Sodium dodecyl sulfonate (SDBS), SA, palmitic
acid (PA), and CA were purchased from Aladdin. Polypro- Different SB-based capsules were blended with LDPE at
pylene (PP, T-30) and low-density polyethylene (LDPE) a weight ratio of 1:9 in a torque rheometer (XSS-300,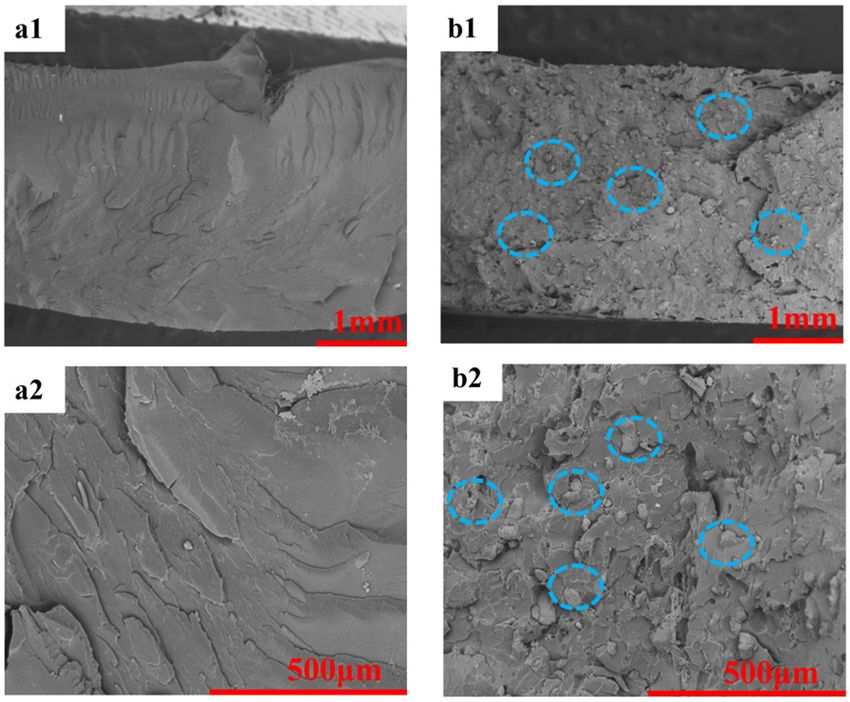
368 Dan Luo et al.
Shanghai Kechuang Rubber & Plastic Machinery Equipment field observed under the microscope, and M is the mag-
Co., Ltd), and these composites were mixed about 6 min nification factor.
under a temperature of 100°C (SB did not decompose
in this process, confirmed as in Figure A2). The above
composites were cooled at room temperature and
crushed with a pulverizer to acquire different types of 2.6 Characterizations
foam masterbatches.
The blends of PP with 3 wt% MMT were made by Fourier-Transform Infrared spectroscopy was conducted
twin-screw extruder (TSE40A, Nanjing Ruiya polymer on a FT-IR, NEXUS670, Thermo Nicolet USA, and the
Equipment Co., Ltd). The melting temperatures of PP/MMT wavelength range was 500–4,000 cm−1. The thermal prop-
from zone 1 to zone 10 were 170°C, 173°C, 176°C, 180°C, erties of the SB-based capsules were evaluated by ther-
185°C, 186°C, 187°C, 189°C, 190°C, and 193°C, respectively. mogravimetry (TGA, Q50, iversePerkin Elmer, USA), and
Afterwards, the PP/MMT extrudate was cooled in a water TGA was conducted from the 40°C to 600°C at 10°C/min
bath and cut into small particles, and dried at 80°C for 12 h under N2 atmosphere. The thermal stability investigation
in a vacuum oven. of the modified SB composites was characterized by
Differential Scanning Calorimeter (DSC, Q10 Perkin-
Elmer, USA); the test temperature was from room tem-
perature to 80°C for 10 min to eliminate the mass error of
2.4 Preparation of the PP foaming materials the sample. Then it was cooled to room temperature and
heated to 300°C at a rate of 10°C/min in N2 atmosphere.
PP/MMT mixed with 15 wt% previously prepared master- Nitrogen adsorption instrument measurement was con-
batch and SB-based capsules foaming agents were injected ducted on a TriStar® II 3020, Micromeritics. The mor-
using an injection molding machine with feeding zone tem- phology of the modified SB composites was measured
perature of 190°C, 189°C, 188°C, and 187°C, respectively, by SEM (KYKY-EM6200, Beijing Science and Technology
and the injection speed was 95% with injection pressure Instrument Co., Ltd.). Transmission Electron Microscope
of 40 MPa. Then, the dumbbell-shaped PP/SB, PP/EP@SB, (TEM, Tecnai F20, FEI, USA) was used to study the shell
PP/PA/EP@SB, PP/SA/EP@SB, and PP/CA/EP@SB foaming thickness of the capsules. Thermal conductivity of the
products were obtained; they were designated by PP-1, PP-2, samples was tested by utilizing hotwire thermal conduc-
PP-3, PP-4, and PP-5, respectively. tivity meter (TC3000, Xiaxi Co., Ltd., China) at room
temperature.
2.5 Foam characterization
3 Results and discussion
The densities of the PP/MMT blends and the foamed
samples were measured by using a water displacement
method. The cell size was calculated by SEM, and at least 3.1 Structure of the synthesized sodium
100 cells were tested to acquire the average cell diameter. bicarbonate capsules
Image Proplus software was used to analyze the SEM
images and the average diameter and cell density were To better understand the structure of the modified SB,
calculated as follows (14,15): a series of characterizations were conducted. As shown
3
in Figure 1, in the FT-IR spectra, the prominent peaks
nM2 2 1 (1) at 835 cm−1 and 696 cm−1 in SB were assigned to the
N0 =
A 1 − Vf stretching vibration of CO2−3 (Figure 1b), and the peak
ρ − ρf at 1,509 cm−1 in EP was corresponding to the stretching
Vf = (2) vibration of benzene ring (16,17). In the pure SA, PA, and
ρ
CA, the peaks at 2,923 cm−1 and 2,849 cm−1 were origi-
where N0 was the cells’ density per unit volume, ρ and ρf nated from the symmetrical stretching vibration of the
were the density of sample before and after foaming, C–H of CH2 and CH3 (17,18) (Figure 1c). Moreover, the
respectively. n was the number of cells observed under peak at 1,708 cm−1 was ascribed to the stretching of
microscope and Vf was the porosity percentage. A was the the C]O groups of the several organic acids, and the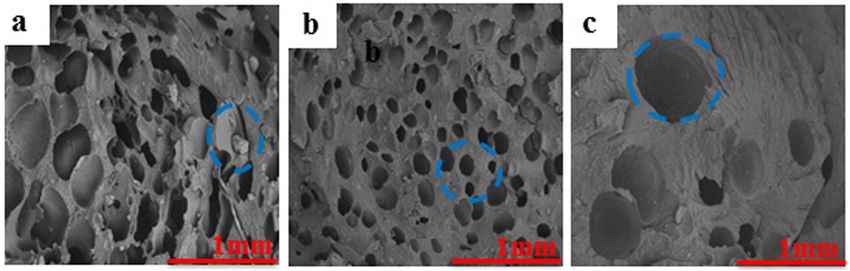
Modification of sodium bicarbonate and its effect 369
a SB b c
835 696 EP
SB
Intensity/%
EP
Intensity/%
SB 1509
PA /EP@ 1457
PA/
EP@
@ SB SB
PA A/EP
S SA/E
P@S
SB B
EP@
In ten sity /%
SA CA/ CA/
EP@
SB
CA
1000 900 800 700 600 500 1530 1500 1470 1440
Wavenumber(cm-1) Wavenumber(cm-1)
PA/EP@SB
d PA e PA
SA/EP@SB
Intensity/%
SA SA
Intensity/%
CA 2923 2849
CA 1703 1386
CA/EP@SB
PA/EP@SB PA/EP@SB
SA/EP@SB SA/EP@SB
CA/EP@SB CA/EP@SB
4000 3500 3000 2500 2000 1500 1000 500 2960 2920 2880 2840 2800 1800 1700 1600 1500 1400 1300
Wavenumber(cm-1) Wavenumber(cm-1) Wavenumber(cm-1)
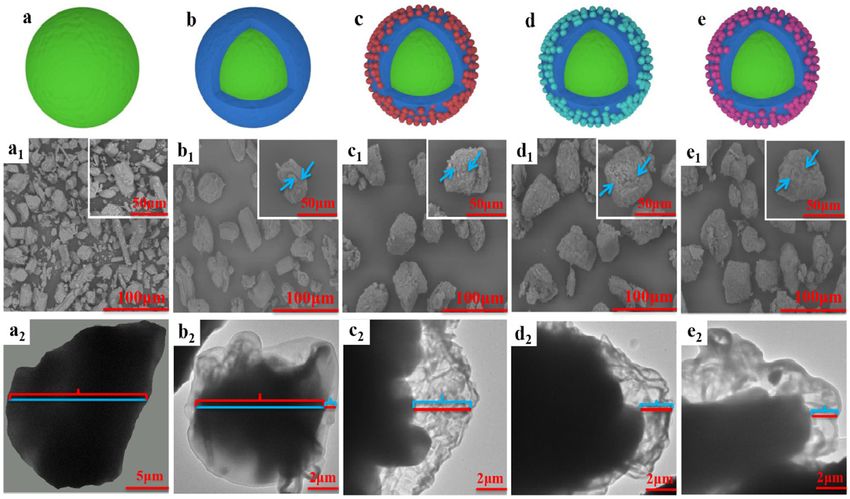
Figure 1: (a) FT-IR spectra of the pure SB, PA, SA, CA, EP, PA/EP@SB, SA/EP@SB, and CA/EP@SB, (b–e) were the locally enlarged graph of
graph (a).
broad region of the CA spectrum at the range of 3,290– improve the property of heat insulation of the outer
3,500 cm−1 came from the contribution of –OH bonds. shells. Moreover, in order to identify the dispersion of
After modification, as mentioned above, only absorption SB-based compounds before and after modification, N2
peak at 1,703 cm−1 was disappeared and others peaks adsorption isotherms were used. According to the iso-
still retained, whereas an obvious peak at 1,386 cm−1 therm adsorption curve and Brunauer–Emmet–Teller
corresponding to –COO groups was appeared (19) (BET) equation fitting, the specific surface area of SB,
(Figure 1d), which may appear from the chemical reac- EP@SB, PA/EP@SB, CA/EP@SB, and SA/EP@SB was cal-
tion between organic acid and epoxy resin, indicating culated as 5.82, 6.45, 9.89, 9.32, and 7.78 m2/g, respec-
that the organic acid was grafted on the surface of the tively, as shown in Figure A3, which indicated the good
epoxy coating. FT-IR spectra indicated that the epoxy dispersion of SB-based compounds. To further prove the
resin and organic acids were successfully coated on the morphology of the modified SB, TEM was conducted.
surface of SB. Herein, sample of EP@SB was used as example, as shown
The morphology of the SB-based capsules was in Figure 2b1, the EP@SB showed an irregular shell pro-
observed by SEM, as shown in Figure 2. It could be file, in which core of SB is more contrast, and shell of EP
seen that the pure SB exhibited smooth surface (Figure coating layer is less contrast, demonstrating that EP was
2a and a1). After modified with EP, the surface of EP@SB successfully coated on the surface of SB. Figure 2c1–e1
presented a lot of wrinkles without visible agglomeration displayed an obvious boundary between the core and
and exposed SB particles, indicating that the SB was the shell, and their shell was rougher than observed in
effectively enclosed in EP (Figure 2b and b1). Moreover, Figure 2b1, which also proved that the organic acids were
the EP@SB was further modified by a series of organic grafted on the EP. These results further suggested that the
acids that could interact with EP. As shown in Figure epoxy resin and organic acids were successfully coated
2c–e, the surface of the secondary modified products of on the surface of sodium bicarbonate.
PA/EP@SB, SA/EP@SB, and CA/EP@SB became rougher
than for EP@SB. This may be due to the hydrogen bond
interaction between organic acids and EP, which made
the molecular chain of EP become dense, and the inter- 3.2 Thermal properties of the synthesized
twined molecular chains made the surface rough (20). SB-based capsules
These data proved that the EP and some organic acids
were successfully attached on the surface of SB, and the The influences of epoxy resin and organic acids coating
rough surface with intertwined molecular chains could on the thermal behavior of SB were characterized by TG.
370 Dan Luo et al. Figure 2: SEM and TEM images of the SB with coating layers. (a) SB, (b) EP@SB, (c) PA/EP@SB, (d) SA/EP@SB, (e) CA/EP@SB. As shown in Figure 3a and Table 1, the initial decomposi- epoxy resin and organic acids, resulting in the increase tion temperature (T0) of the pure SB was 119°C, with 63% of crosslinking structure density in the molecular chain residue at 600°C. In the curve of EP@SB, the thermal and the difficulty in the movement of macromolecular behavior of weight loss was obtained in the temperature chain. These results showed that we have successfully range of 150–200°C and 250–600°C. Among them, the enhanced the thermal stability and improved the thermal first broad temperature range was owed to the decompo- insulation performance of SB. sition of SB, while the second wide temperature range The thermal stability of the pure SB, EP@SB, PA/EP@SB, was due to the partial and complete decomposition of SA/EP@SB, and CA/EP@SB samples was also explored epoxy resin. It could be seen that the initial decomposi- by DSC. It could be observed from Figure 3b and Table 1 tion temperature of EP@SB was 36°C higher than that of that the maximum peak temperature (Tp) of pure SB was pure SB, which was mainly due to the heat transfer of the 152°C, with a decomposition temperature range (ΔT) outer epoxy resin shell, causing the gradual thermal of 69°C. After being modified by epoxy resin, the ΔT decomposition of SB (21,22). When the temperature was decreased from 69°C to 46°C compared to pure SB, and higher than the decomposition temperature of epoxy, the Tp was also increased to 171°C, which was attributed the outer capsule of epoxy resin was swelled until the to the increase of SB coating shell, leading to better gas escaped. To further improve the thermal performance barrier effect (23). After further coating with some dif- of EP@SB, a variety of organic acids were coated on ferent organic acids, it could be observed in Table 1 that the basis of EP@SB. It could be seen that the T0 of when PA was added, the maximum peak temperature of PA/EP@SB, SA/EP@SB, and CA/EP@SB was 178°C, PA/EP@SB increased from 152°C (pure SB) to 186°C, sug- 174°C, and 165°C, with weight loss of 28%, 24%, and gesting better thermal stability, and the decomposition 30%, respectively. The T0 was increased by nearly temperature range was 28°C, which was narrower than 46–59°C compared with pure SB. Therefore, the effect of pure SB sample by 41°C. The results caused by when the secondary modification with organic acid was better than heating temperature is more than the decomposition of that of primary modification with epoxy resin, which may coating shell, and the coating shell instantaneously are be due to some chemical reaction or interaction between decomposed and ruptured, the temperature of the core of
Modification of sodium bicarbonate and its effect 371
100 a 100
a'
90
Mass loss/%
Mass loss/%
95
80
70
SB 90 SB
60 EP@SB EP@SB
PA/EP@SB PA/EP@SB
50 SA/EP@SB SA/EP@SB
85
CA/EP@SB CA/EP@SB
40
100 200 300 400 500 600 80 100 120 140 160 180 200
Temperature/°C Temperature/°C
Thermal conductivity (W/mk)
0 b 0.0645 c
DSC/(mW/mg)
-1
-2 0.0630
-3
0.0615
-4
SB
EP@SB
-5 PA/EP@SB
SA/EP@SB
0.0600
-6 CA/EP@SB
0 50 100 150 200 250 300 EP PA/EP SA/EP CA/EP
Temperature/°C Sample
Figure 3: (a and a′) TG curves of the SB-based capsules. (b) DSC curves of the SB-based capsules. (c) Thermal conductivity of the EP and
PA/EP, SA/EP, and CA/EP.
SB will rise rapidly and the temperature at this time was Technology Co., Ltd.). As shown in Figure 3c, the thermal
the maximum endothermic peak of SB. Furthermore, the conductivity of pure EP was 0.0639 W/m K at room tem-
decomposition temperature range of SA/EP@SB and perature. After introducing some different organic acids,
CA/EP@SB was 31°C and 38°C, and the maximum peak the thermal conductivity of EP slightly decreased, and
temperature was 186°C and 185°C, respectively. By com- the thermal conductivity of PA/EP, SA/EP, and CA/SB
parison, the multilayer coating effect of organic acids was was 0.0603, 0.0604, and 0.0624 W/m K, respectively.
better than that of epoxy single-layer coating for SB, This result may be due to the interaction between EP
especially the modification for PA/EP@SB. These results and PA, leading to the scattering of heat carrier phonons
demonstrated that the decomposition temperature range of (24,25). Another reason may be that the addition of
SB decreased with different coating layers, and multiple organic acids increased the density of epoxy polymer
coating layers would give SB better thermal stability. chain, destroyed the continuity of epoxy polymer, and
The improvement of SB-based capsules’ thermal per- led to the change of its thermal conductivity (26,27). In
formance encouraged us to explore the thermal conduc- all, the addition of organic acid coating could reduce the
tivity of the coating shell, and the thermal conductivity of thermal conductivity of the samples, which made the SB
the pure EP, EP/CA, EP/SA, and EP/PA was measured by have good thermal insulation performance and further
Thermal conductivity meter (TC300, Xi’an Xiaxi Electronic improved the thermal behavior of SB.
Table 1: TGA data and thermodynamic parameters of the SB-based capsules
T0a (°C) Tfb (°C) Lc (%) T0a’ (°C) Tpd (°C) Tfb’ (°C) ΔTe (°C)
NaHCO3 119 186 37 119 152 188 69
EP@SB 155 180 32 151 171 197 46
PA/EP@SB 178 202 28 173 186 201 28
SA/EP@SB 174 199 24 169 186 200 31
CA/EP@SB 165 193 30 165 185 205 38
T0: initial decomposition temperature. b, b’Tf: end thermal decomposition temperature. cL: weight loss of various SB-based capsules and
a, a’
pure SB. dTp: peak endothermic temperature. eΔT: thermal decomposition temperature range. ΔT = Tf − T0.372 Dan Luo et al.
Figure 4: Cell structure (a–e) and the cell size distribution (a1–e1) of the PP foaming composites. (a) PP@SB, (b) PP/EP@SB, (c) PP/PA/
EP@SB, (d) PP/SA/EP@SB, (e) PP/CA/EP@SB.
3.3 Foaming behavior and cell morphology to observe the foaming behavior of the SB-based capsules
in PP, SEM was conducted. The average cell diameter and
The good thermal insulation performance of the SB- cell density were presented in Figures 4 and 5a and b.
based capsules encourages us to apply the modified SB Figure 4a1 showed the phenomenon of cell merging
as blowing agent to polyolefin foaming. The foaming pro- and collapse, and the cells were large and few. The
cess of SB in polyolefin was mainly composed of the for- cell diameter was 163 μm and the cell density was
mation of a stable gas-melt homogeneous system, cell 0.872 × 10⁵ cells/cm3. This may be due to the rapid
nucleation, cell growth, and cell stability (28). Firstly, decomposition of SB, which could not be enriched in
2.0×10⁵
160 a b
Cell densitycells/cm3
Average cell size/μm
140 1.6×10⁵
120 1.2×10⁵
100
0.8×10⁵
80
0.4×10⁵
60
PP-1 PP-2 PP-3 PP-4 PP-5
0 PP-1 PP-2 PP-3 PP-4 PP-5
Sample Sample
25 0.95
Apparent density (g/cm3)
c d
Weight reduction(wt./%)
20 0.90
15 0.85
10 0.80
5
0.75
0
0.70
PP PP-1 PP-2 PP-3 PP-4 PP-5 PP PP-1 PP-2 PP-3 PP-4 PP-5
Sample Sample
Figure 5: Cell parameters of the foamed PP composites: (a) average cell size, (b) cell density, (c) weight reduction, (d) apparent density.Modification of sodium bicarbonate and its effect 373
PP polymer. In contrast, the cell size shown in Figure 4b1 that the apparent density of these PP materials was sig-
was relatively small, and the cell diameter and cell den- nificantly decreased after foaming, and the apparent
sity were 142 μm and 0.961 × 10⁵ cells/cm3, respectively. density of PP products using pure SB as foaming agent
Compared with Figure 4a1, the cell density shown in was the lowest. It was considered that the coating on
Figure 4b1 was more regular, which may be due to the SB improved the thermal properties of SB and further
increase of thermal stability and foaming temperature improved the foaming behavior of SB. Notably, the
of SB@EP (29). Besides, the melting strength of the foamed PP samples prepared by blowing agents of
polymer matrix was enhanced by EP, and MMT and EP PP/PA/EP@SB presented the lowest apparent density of
had a heterogeneous nucleation effect, resulting in the 0.72 g/cm3. This is because the interaction between EP
decrease of cell size and increase of cell density (30,31). and organic acid, which improved the performance of
The presence of less-foamed stage in Figure 4a1 and b1 the coating, thereby further improved the thermal perfor-
was possibly due to the lower initial decomposition tem- mance of SB, in turn affecting the foaming behavior of SB
perature of EP@SB and pure SB compared with the melting in PP. These data indicated that in the PP foaming
temperature of PP, resulting in the bubbles nucleation system, by coating the foaming agent of SB with polymer
in the cell during cell formation (32–34). In other words, or increasing the strength of the SB coating compound,
SB had already decomposed gas before some PP had not the early decomposition of SB in PP can be restricted to
completely melted. In addition, with the introduction of achieve better foaming performance. This study not only
organic acids in EP@SB, the cell density and cell size in conformed to the concept of environmentally friendly
samples of PP/SA/EP@SB and PP/CA/EP@SB shown in materials, but also provided direction guidance for the
Figure 4d and e were 1.20 × 10⁵ cells/cm3, 1.18 × 10⁵ cells/cm3 development of PP foaming products.
and 118 μm, 125 μm in diameter, respectively. Notably,
in the case of PA modifier, it can be clearly shown in
Figure 4c1 that there were many regular, uniform, and
small cells in PP, and the cell density and cell size were 4 Conclusion
1.31 × 10⁵ cells/cm3 and 108 μm in diameter, respectively.
This result was better than the reported melting modifi- In summary, the green environmental SB foaming agent
cation method, as shown in Figure A4. Compared with was modified by epoxy resin and some different organic
Figure 4a1, the average cell diameter in Figure 4c1 reduced acids. The modification of SB and its effect on foaming
from 163 to 108 μm; the cells density increased from behavior of PP were investigated. After the modification,
0.872 × 10⁵ to 1.31 × 10⁵ cells/cm3. Based on the above the decomposition temperature and decomposition tem-
data analysis, it could be concluded that under the same perature ranges of SB were significantly improved. In
amount of foaming agent, the foaming effect of organic particular, compared with the pure SB, the decomposi-
acid-modified sodium bicarbonate in PP was superior tion temperature of PA/EP@SB composite increased from
than that of epoxy modified, and the long alkyl chain 119°C to 179°C, increased by nearly 50°C, and the decom-
grafting improved the dispersibility of the CO2 adduct in position temperature range was 41°C and 23°C lower than
PP and favored a homogeneous release of CO2 to blow PP that of pure SB and EP@SB, respectively. Meanwhile, the
during the exothermic foaming process (35). foaming quality of PP was also significantly improved,
As presented in Figure 5c, the weight of PP foaming and the cells were more uniform with smaller cells size
products was reduced after foaming injection molding, and higher cells density compared to unmodified SB in
and the weight reduction rates of PP/SB, PP/EP@SB, PP. The results mainly ascribed to the addition of shells
PP/PA/EP@SB, PP/SA/EP@SB, and PP/CA/EP@SB were with EP and organic acids, which improved the thermal
9.7, 14.1, 21.73, 18.47, and 16.30 wt%, respectively. In con- properties of SB, as well as enhanced the melt strength of
trast, PP/PA/EP@SB exhibited the highest weight loss PP. This study highlights that increasing the strength
rate than others, indicating that PP/PA/EP@SB had the of the shell can enhance the decomposition temperature
best foaming effect and the highest gas production, of SB and improve its foaming behavior in PP.
which may be due to the excellent compatibility of
PP/PA/EP@SB in the PP foaming system, and its foaming Funding information: This work was supported by the
temperature was closed to the melting temperature of PP. National Natural Science Foundation of China (No.
The apparent density of these PP foaming samples was 52063008), the Research Institute Service Enterprise Action
also measured, as shown in Figure 5d. It could be seen Plan Project of Guizhou Province (No. [2018]4010), the374 Dan Luo et al.
Hundred Talents Project of Guizhou Province (No. [2016] Res. 2011;307:869–73. doi: 10.4028/www.scientific.net/
5673), the Guizhou Provincial Science and Technology AMR.306-307.869.
Foundation (No. [2020]1Y212),and Science and Technology (9) Cao XW, Zhang Y, Wei W, Wu PJ. Thermal analysis of modified
sodium bicarbonate. Chem Ind Eng Prog. 2012;31(10):2176–82.
Top Talent Project of Guizhou Province (No. [2021]029).
doi: 10.16085/j.issn.100-6613.2012.10.018.
(10) Contreras V, Maturana FJ, Jesús P, Núez KC, Pastor JM.
Author contributions: Luo Dan and Pei Xianglin: designed Optimization of injection parameters to obtain selected
and performed the experiments; Yang Xin, Long Siyu, properties on foamed PP with hollow glass microspheres
and Zhang Linyu: data curation, formal analysis; Luo and thermally expandable microspheres using Taguchi
method. J Cell Plast. 2020;1–15. doi: 10.1177/
Dan: writing – original draft; Pei Xianglin and Fu Hai:
0021955X20943097.
writing – review and editing; Wei Gong: funding acquisi- (11) Liang Y, Liu LZ, Zhang WL, Weng L, Hu DS, Li CY. Preparation
tion. All authors have read and agreed to the published and electrical properties of 4-acetoxystyrene grafted poly-
version of the manuscript. propylene for HVDC cable insulation. J Mater Sci-Mater El.
2020;31(5):3890–8. doi: 10.1007/s10854-020-02934-6.
(12) Tian B, Li ZG, Li JF, Yao G, Dong W, Liu YG, et al. The effects
Conflict of interest: Authors state no conflict of interest.
of rubber nanoparticles with different polarities on thermal
properties and foaming performance of polypropylene
Data availability statement: The data presented in this study blends. RSC Adv. 2020;10(52):31355–62. doi: 10.1039/
are available on request from the corresponding author. D0RA04486E.
(13) Zhang Z, Li JS, Wang ZY, Long SY, Jiang SJ, Liu GL, et al.
Preparation and performance characterization of a novel high-
performance epoxy resin modified reactive liquid asphalt.
Constr Build Mater. 2020;263:120113. doi: 10.1016/
References j.conbuildmat.2020.120113.
(14) Campuzano JF, Lopez ID. Study of the effect of dicumyl per-
(1) Sukkaneewat B, Sridaeng D, Chantarasiri N. Fully water-blown oxide on morphological and physical properties of foam
polyisocyanurate- polyurethane foams with improved injection molded poly(lactic acid)/poly(butylene succinate)
mechanical properties prepared from aqueous solution of blends. Express Polym Lett. 2020;14(7):673–84. doi: 10.3144/
gelling/blowing and trimerization catalysts. E-Polymers. expresspolymlett.2020.55.
2016;19(1):277–89. doi: 10.1515/epoly-2019-0028. (15) Gong W, Pei XL, Yin XG, Ban D, Fu H, He L. Synthesis of high-
(2) Liu L, Lv R. Synthesis of a DOPO-triazine additive and its flame- temperature thermally expandable microcapsules and their
retardant effect in rigid polyurethane foam. E-Polymers. effects on foaming quality and surface quality of foamed ABS
2019;19(1):235–43. doi: 10.1515/epoly-2019-0024. materials. E-Polymers. 2020;20:519–27. doi: 10.1515/epoly-
(3) Bayat H, Fasihi M, Zare Y, Rhee KY. An experimental study on 2020-0021.
one-step and two-step foaming of natural rubber/silica (16) Parsaee S, Mirabedini SM, Farnood R, Alizadegan F.
nanocomposites. Nanotechnol Rev. 2020;9(1):427–35. Development of self aling coatings based on urea‐formalde-
doi: 10.1515/ntrev-2020-0032. hyde/polyurethane microcapsules containing epoxy resin.
(4) Charoeythornkhajhornchai P, Samthong C, Boonkerd K, J Appl Polym Sci. 2020;137(41):49663–15. doi: 10.1002/
Somwangthanaroj A. Effect of azodicarbonamide on micro- app.49663.
structure, cure kinetics and physical properties of natural (17) Gyawali D, Nair P, Zhang Y, Tran RT, Chi Z, Samchukov M, et al.
rubber foam. J Cell Plast. 2016;53:1–17. doi: 10.1177/ Citric acid-derived in situ crosslinkable biodegradable poly-
0021955X16652101. mers for cell delivery. Biomaterials. 2010;31(34):9092–9105.
(5) Zeng GS, Lin RZ, Meng C, Zhai JP. The effect of the mixed doi: 10.1016/j.biomaterials.2010.08.022.
foaming agent of azodicarbonamide and zinc oxide on the (18) Latibari ST, Mehrali M, Afifi ABM, Mahlia TMI, Akhiani AR,
properties of foamed starch-based composite strengthened by Metselaar HSC. Facile synthesis and thermal performances of
plant-fibe. J Funct Mater. 2012;43(6):708–11. doi: 10.1364/ stearic acid/titania core/shell nanocapsules by sol–gel
JOSA.68.000480. method. Energy. 2015;85(1):1–10. doi: 10.1016/
(6) Hussein MS, Leng TP, Rahmat AR, Zainuddin F, Keat YC. The j.energy.2015.04.008.
influence of sodium bicarbonate loading as blowing agent on (19) Liu J, Sun ZN, Wang F, Zhu D, Su H. Facile solvent-Free pre-
the properties of epoxy foam. Solid State Phenom. paration of biobased rigid polyurethane foam from raw citric
2018;280:270–6. doi: 10.4028/www.scientific.net/ acid fermentation waste. Ind Eng Chem Res.
SSP.280.270. 2020;59(22):10308–14. doi: 10.1021/acs.iecr.0c00946.
(7) Yao SJ, Zhou ZF, Ye F, Tian Z, Wang SM. Modifying sodium (20) Dai ZH, Han JR, Gao Y, Xu J, He J, Guo BH. Increased dielectric
bicarbonate for foaming polymers. Adv Mater Res. permittivity of poly(vinylidene fluoride-co-chlorotrifluoroethy-
2014;940:59–62. doi: 10.4028/www.scientific.net/ lene) nanocomposites by coating BaTiO3 with functional
AMR.940.59. groups owning high bond dipole moment. Colloid Surface A.
(8) Petchwattana N, Covavisaruch S. Influences of modified che- 2017;592(20):560–70. doi: 10.1016/j.colsurfa.2017.05.065.
mical blowing agents on foaming of wood plastic composites (21) Huo R, Zhang ZY, Athir N, Fan YH. Designing high thermal
prepared from poly(Vinyl Chloride) and rice hull. Adv Mate conductivity of cross-linked epoxy resin via molecularModification of sodium bicarbonate and its effect 375
dynamics simulations. Phys Chem Chem Phys. prepared by supercritical CO2-assisted extrusion. Polym
2020;22:19735–45. doi: 10.1039/D0CP02819C. Degrad Stabil. 2018;153:100–8. doi: 10.1016/
(22) Maguire JM, Simacek P, Advani SG, Brádaigh CMÓ. Novel j.polymdegradstab.2018.04.021.
epoxy powder for manufacturing thick-section composite (29) Zhang T, Jiang B, Huang Y. Combined use of methacrylate/
parts under vacuum-bag-only conditions. Part I: Through- epoxy functionalized silanes for tuning of hyperbranched
thickness process modelling. Compos Part A-Appl S. polysiloxane structure. Mater Chem Phys. 2020;254:123525.
2020;136:105969. doi: 10.1016/j.compositesa.2020.105969. doi: 10.1016/j.matchemphys.2020.123525.
(23) Ma IAW, Ammar SH, Bashir S, Selvaraj M, Assiri MA. (30) Li Y, Tian H, Jia Q, Niu P, Xiang A, Liu D, et al. Development of
Preparation of hybrid chitosan/silica composites via iono- polyvinyl alcohol/intercalated MMT composite foams fabri-
tropic gelation and its electrochemical impedance studies. cated by melt extrusion. J Appl Polym Sci.
Prog Org Coat. 2020;145:105679. doi: 10.1016/j. 2015;132(43):42706–7. doi: 10.1002/app.42706.
porgcoat.2020.105679. (31) Wu S, He L, Zhang C, Gong W, Jiang T, Zhang X. Methodology
(24) Wang J, Xie H, Zhong X, Yang L. Increasing the thermal con- for describing characteristic foam parameters during chemical
ductivity of palmitic acid by the addition of carbon nanotubes. foaming of low-density polyethylene. Mater Res Express.
Carbon. 2010;48(14):3979–86. doi: 10.1016/ 2018;6(2):1–9. doi: 10.1088/2053-1591/aaec2d.
j.carbon.2010.06.044. (32) Shaayegan V, Wang G, Park CB. Study of the bubble nucleation
(25) Zhao J, Zhao Q, Wang C, Guo B, Park CB, Wang G. High thermal and growth mechanisms in high-pressure foam injection
insulation and compressive strength polypropylene foams molding through in-situ visualization. Eur Polym J.
fabricated by high-pressure foam injection molding and mold 2015;76:2–13. doi: 10.1016/j.eurpolymj.2015.11.021.
opening of nano-fibrillar composites. Mater Design. (33) Zhu B, Zha W, Yang J, Zhang C, Lee LJ. Layered-silicate
2017;131:1–11. doi: 10.1016/j.matdes.2017.05.093. based polystyrene nanocomposite microcellular foam
(26) Yang Z, Li J, Luan X, Song S. Effects of acid leaching and using supercritical carbon dioxide as blowing agent.
organic intercalation on the thermophysical properties of Polymer. 2010;51(10):2177–84. doi: 10.1016/
paraffin/expanded vermiculite composite phase change j.polymer.2010.03.026.
materials. Appl Clay Sci. 2020;196(5):105754. doi: 10.1016/ (34) Radhakrishna G, Dugad R, Gandhi A, Mohanty S, Nayak SK.
j.clay.2020.105754. Morphological evaluation of ultra low-density poly (methyl
(27) Zhang DL, Liu SN, Cai HW, Feng QK, Dang ZM. Enhanced methacrylate) microcellular plastic developed through cyclic
thermal conductivity and dielectric properties in electrostatic foaming technique. Int J Mater Eng Innov. 2019;10(4):310–32.
self-assembly 3D pBN@nCNTs fillers loaded in epoxy resin doi: 10.1504/IJMATEI.2019.103611.
composites. J Materiomics. 2020;6(4):751–9. doi: 10.1016/ (35) Long Y, Sun F, Liu C, Huang D, Xie X. Climate-friendly poly-
j.jmat.2020.06.013. urethane blowing agent based on a carbon dioxide adduct
(28) Vadas D, Igricz T, Sarazin J, Bourbigot S, Marosi G, Bocz K. from palmitic acid grafted polyethyleneimine. J Appl Polym Sci.
Flame retardancy of microcellular poly(lactic acid) foams 2016;133(35):43874–8. doi: 10.1002/app.43874.376 Dan Luo et al.
Appendix
100 3.18%
70
90
Temperature/°C
Weight loss/%
60
80
50
70
40
60
30
50
0 50 100 150 200 250 300 350 400
Time/min
Figure A1: Infrared curve of EP@SB before and after washing for 3 h.
Figure A2: SEM image of LDPE/(EP@SB) composite material.
20
10 9.89
9.32
Quantity Adsorbed/(cm3/g STP)
8 7.78
15
BET/m2/g
6.45
6 5.82
4
10 2
NaHCO
0 3
EP@SB SB SB SB SB @S
B
EP@ P@ P@ /EP
PA/EP@SB PA/E SA/E CA
5 SA/EP@SB
CA/EP@SB
0
0.0 0.2 0.4 0.6 0.8 1.0
Relative Pressure(P/Po)
Figure A3: Nitrogen adsorption isotherm of sodium bicarbonate of modification before and after modifying.
Figure A4: Cells structure of PP/MMT foams composites and cells size distribution: (a) PP/SB, (b)PP/PA/EP@SB, (c) PP/PA/EP@SB.You can also read