Accounting for the photochemical variation in stratospheric NO2 in the SAGE III/ISS solar occultation retrieval
←
→
Page content transcription
If your browser does not render page correctly, please read the page content below
Atmos. Meas. Tech., 14, 557–566, 2021
https://doi.org/10.5194/amt-14-557-2021
© Author(s) 2021. This work is distributed under
the Creative Commons Attribution 4.0 License.

Accounting for the photochemical variation in stratospheric NO2 in
the SAGE III/ISS solar occultation retrieval
Kimberlee Dubé1 , Adam Bourassa1 , Daniel Zawada1 , Douglas Degenstein1 , Robert Damadeo2 , David Flittner2 , and
William Randel3
1 Institute
          of Space and Atmospheric Studies, University of Saskatchewan, Saskatchewan, Canada
2 NASA  Langley Research Center, Hampton, VA, USA
3 National Center for Atmospheric Research, Boulder, CO, USA

Correspondence: Kimberlee Dubé (kimberlee.dube@usask.ca)

Received: 17 August 2020 – Discussion started: 21 September 2020
Revised: 10 December 2020 – Accepted: 11 December 2020 – Published: 26 January 2021

Abstract. The Stratospheric Aerosol and Gas Experiment            the retrieval. We conclude that diurnal variations along the
(SAGE) III has been operating on the International Space          SAGE III/ISS line of sight are an important term to consider
Station (ISS) since mid-2017. Nitrogen dioxide (NO2 ) num-        for NO2 analyses at altitudes below 30 km.
ber density profiles are routinely retrieved from SAGE
III/ISS solar occultation measurements in the middle atmo-
sphere. Although NO2 density varies throughout the day due
to photochemistry, the standard SAGE NO2 retrieval algo-          1   Introduction
rithm neglects these variations along the instrument’s line of
sight by assuming that the number density has a constant gra-     The Stratospheric Aerosol and Gas Experiment (SAGE) III
dient within a given vertical layer of the atmosphere. This as-   on the International Space Station (ISS) uses solar occul-
sumption will result in a retrieval bias for a species like NO2   tation to measure the attenuation of sunlight through the
that changes rapidly across the terminator. In this work we       middle atmosphere (Cisewski et al., 2014). These measure-
account for diurnal variations in retrievals of NO2 from the      ments are used to retrieve vertical profiles of nitrogen diox-
SAGE III/ISS measurements, and we determine the impact            ide (NO2 ), as well as other atmospheric constituents, mainly
of this algorithm improvement on the resulting NO2 number         ozone and aerosol extinction coefficients. The SAGE III/ISS
densities. The first step in applying the diurnal correction is   data complement that from the earlier SAGE II (McCormick,
to use publicly available SAGE III/ISS products to convert        1987) and SAGE III/Meteor-3M missions (Mauldin III et al.,
the retrieved number density profiles to optical depth pro-       1998), as well as data from limb-viewing instruments such
files. The retrieval is then re-performed with a new matrix       as the Optical Spectrograph and Infrared Imager System
that applies photochemical scale factors for each point along     (OSIRIS; Llewellyn et al., 2004), to provide a long-term
the line of sight according to the changing solar zenith an-      record of NO2 . It is important to have these data sets for un-
gle. In general NO2 that is retrieved by accounting for these     derstanding trends and variability in the stratosphere as NO2
diurnal variations is more than 10 % lower than the standard      plays a role in the chemical depletion of the ozone layer. Sev-
algorithm below 30 km. This effect is greatest in winter at       eral studies of the long-term trends and variability in NO2
high latitudes and generally greater for sunrise occultations     (Randel et al., 1999; Liley et al., 2000; Park et al., 2017;
than sunset. Comparisons with coincident profiles from the        Galytska et al., 2019; Dubé et al., 2020) have shown a con-
Optical Spectrograph and InfraRed Imager System (OSIRIS)          sistent increase in NO2 and an associated decrease in O3 .
show that NO2 from SAGE III/ISS is generally biased high;            NO2 is mainly destroyed by photolysis so the concentra-
however the agreement improves by up to 20 % in the mid-          tion, or density, of NO2 that is measured depends greatly on
stratosphere when diurnal variations are accounted for in         the position of the sun: there is a rapid decrease in NO2 at
                                                                  sunrise and a rapid increase at sunset. During solar occulta-

Published by Copernicus Publications on behalf of the European Geosciences Union.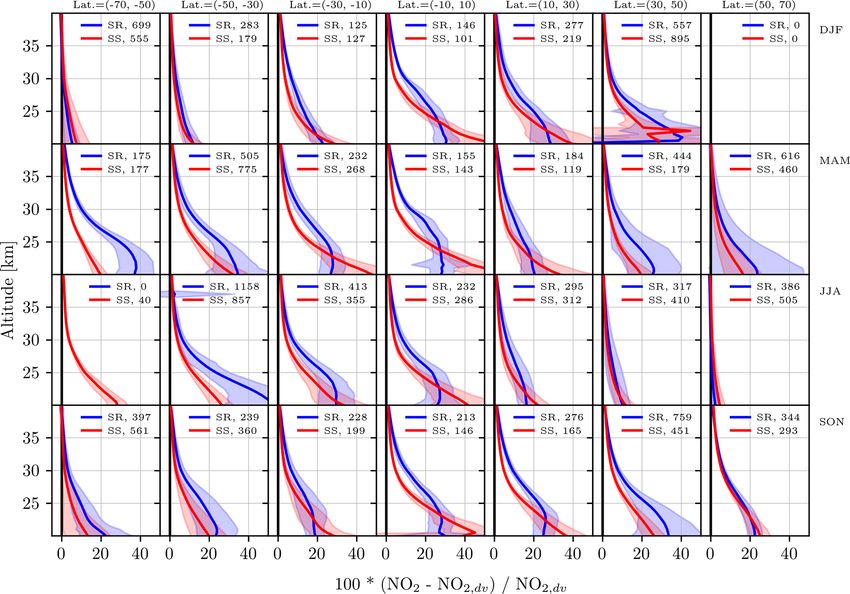
558                                              K. Dubé et al.: Photochemical variation in NO2 in SAGE III/ISS retrieval

tion measurements, such as those taken by SAGE III/ISS, the
solar zenith angle (SZA) is 90◦ at the tangent point but varies
along the instrument’s line of sight (LOS). The retrieved NO2
profile has contributions from the full LOS, so it includes
contributions from both the day and night sides of the Earth,
which can have substantially different amounts of NO2 . The
existing SAGE III/ISS retrieval neglects variations in SZA
along the LOS by assuming the concentration of NO2 has a
constant gradient at each altitude above the Earth’s surface
(SAGE III Algorithm Theoretical Basis Document, 2002).
This is a source of systematic uncertainty in the retrieved
NO2 that has not been quantified for SAGE III/ISS.
   There have been several earlier cases in which diurnal vari-
ations were accounted for in NO2 retrievals, for both space-
(e.g. Gordley et al., 1996) and ground-based instruments (e.g.
Preston et al., 1997; Hendrick et al., 2004). Studies focused
on occultation instruments have examined the effect of the
variation in SZA along the LOS on retrieved NO2 profiles
and showed that ignoring it can result in a high bias, espe-
cially below 25 km (Gordley et al., 1996; Newchurch et al.,
1996; Brohede et al., 2007). The purpose of this work is to
account for diurnal variations along the LOS, assess the im-      Figure 1. Daily cycle in NO2 at the Equator as a function of local
pact, and provide an improved SAGE III/ISS NO2 data set           solar time (top axis) and solar zenith angle (bottom axis) for four
for further study. This is done by adding correction factors to   altitudes. NO2 number density calculated with the PRATMO pho-
the retrieval that account for variations in NO2 due to chang-    tochemical box model.
ing solar zenith angle along the LOS. By comparing the NO2
concentration from this improved retrieval to that from the
existing SAGE III/ISS retrieval, it is possible to determine      sity profiles for a set latitude, longitude, and date. These in-
the importance of the photochemical effect. The results are       put parameters are kept constant. The model then calculates a
also compared to NO2 retrievals from OSIRIS limb scatter-         set of chemical reactions over a single day, iterating until the
ing measurements to determine how the photochemical cor-          start and end values converge (Prather, 1992). This results
rection changes the bias between NO2 products from the two        in a 24 h steady-state system of each species in the model.
different instruments.                                            The model outputs are the NO2 profiles at any predetermined
                                                                  SZAs. These values can be used to scale the measured NO2
                                                                  to different solar times in order to account for variations in
2     NO2 photochemistry                                          SZA along the measurement LOS (Sect. 4). PRATMO scal-
                                                                  ing was used in several previous studies (e.g. Adams et al.,
The NO2 number density depends on local solar time (LST)          2017; Park et al., 2017; Dubé et al., 2020) to compare NO2
and equivalently SZA (Fig. 1). There is a sharp decrease          from instruments that measure at different times of day.
in the NO2 concentration at sunrise as NO2 is photolyzed
to become NO. Throughout the daylight hours NO2 and               3     Instruments
NO are in approximate equilibrium. At sunset NO produc-
tion ceases, resulting in a rapid increase in NO2 . Overnight     3.1    SAGE III/ISS
NO2 decreases more slowly as it is converted to nitrogen-
containing reservoir species. The exact shape of this diurnal     SAGE III has been in orbit on the ISS since March 2017.
cycle depends on altitude: the NO2 concentration at 40 km         Level 2 data are available from June 2017 onwards. The
stays roughly constant during the day and night, while at al-     ISS has an inclination of 51.6◦ , allowing SAGE III/ISS to
titudes with more NO2 there is a steady increase during the       view latitudes from 70◦ N to 70◦ S. The charge-coupled de-
day and decrease at night.                                        vice (CCD) spectrometer is configurable and currently ob-
   The values in Fig. 1 were calculated with the photochem-       serves wavelengths between ∼ 280 and ∼ 1035 nm with
ical box model originally developed by Prather and Jaffe          a resolution of 1–2 nm. A separate photodiode covers ∼
(1990), which has been successively updated and is now of-        1542 nm ± 15 nm. During each occultation SAGE III/ISS
ten referred to as PRATMO (McLinden et al., 2000; Adams           continuously scans back and forth across the sun to measure
et al., 2017). PRATMO takes an input atmospheric state con-       the irradiance. There are 15 sunrise and 15 sunset events per
sisting of specified ozone, temperature, pressure, and air den-   day. The coverage of SAGE III/ISS is very similar to that of

Atmos. Meas. Tech., 14, 557–566, 2021                                                 https://doi.org/10.5194/amt-14-557-2021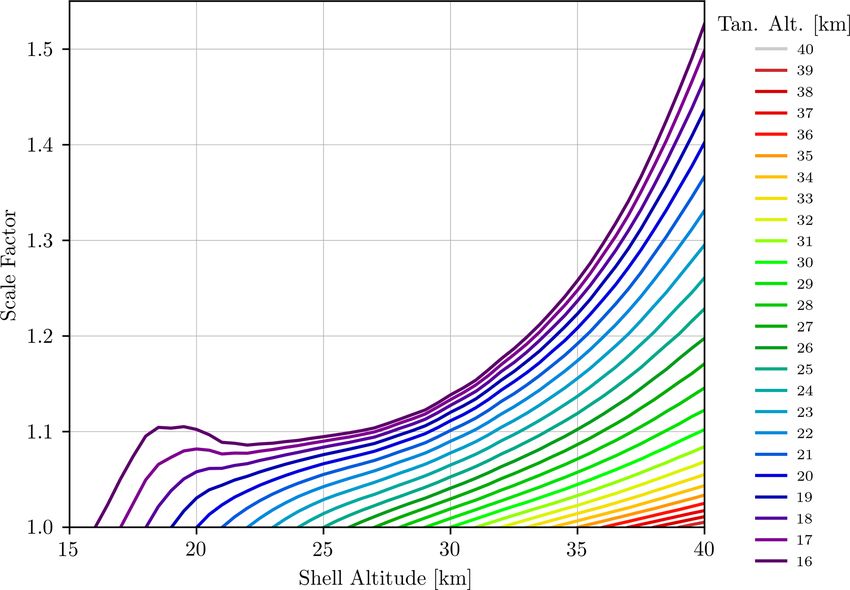
K. Dubé et al.: Photochemical variation in NO2 in SAGE III/ISS retrieval 559
SAGE II. The sunrise and sunset measurements progress in ate a 2D OSIRIS NO2 retrieval to further assess the impact of
opposing directions, with each requiring about 1 month to diurnal variations on the results. They found minimally im-
achieve near-global coverage. proved agreement between OSIRIS NO2 and NO2 from bal-
The irradiances are used in the standard SAGE III/ISS re- loon measurements, particularly below 20 km. Owing to the
trieval (version 5.1, SAGE III Algorithm Theoretical Ba- minimal effect for OSIRIS, the standard NO2 data product is
sis Document, 2002) to determine the number density of sev- produced neglecting the NO2 photochemical gradient.
eral species, as well as the aerosol extinction at several wave-
lengths. The first step in the algorithm is to calculate slant
path transmission profiles for each wavelength channel from 4 Retrieval
the measured irradiance. Each slant path transmission profile
is converted to a slant path optical depth profile that contains During each occultation SAGE III/ISS looks through multi-
contributions from Rayleigh scattering, aerosol extinction, ple layers of the atmosphere, called shells. Each shell is de-
and absorption by at least one species. With this information fined by its altitude. Figure 2 illustrates this geometry. The
NO2 and O3 slant path number density profiles are solved for black arrow represents the LOS, pointing from the instru-
simultaneously using multiple linear regression. NO2 is re- ment to the sun. The SZA at a given location is the angle
trieved from channel S3, covering 433 to 450 nm. The slant between the dotted line and the LOS. At the tangent point
path number density is converted to vertical number density this angle, θtan , is 90◦ . For some other shell with an altitude
profiles using a global fit method that assumes each layer of n, the SZA θn is greater than 90◦ on the instrument side of the
the atmosphere is a spherical shell with a constant gradient. tangent point, as shown in the figure. For this same shell al-
The final NO2 number density is available from 10 to 45 km titude the SZA is less than 90◦ on the sun side of the tangent
on a 0.5 km grid with a vertical resolution of about 1.5 km. point.
The reported uncertainty in the SAGE III/ISS NO2 is around The SAGE III/ISS retrieval assumes that the number den-
5 % at 30 km and increases to up to 20 % at 10 and 40 km. sity of each chemical constituent is either constant or has a
This uncertainty is due to measurement noise only and does constant gradient within a shell (SAGE III Algorithm Theo-
not account for systematic bias due to the horizontal homo- retical Basis Document, 2002). This assumption is generally
geneity assumption. valid for species such as ozone that undergo minimal diur-
nal variation in the stratosphere; however it is not true for
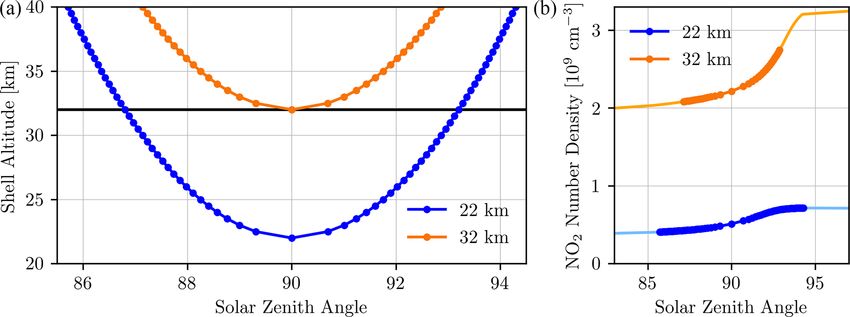
3.2 OSIRIS NO2 . This can be understood by considering Fig. 3. For both
lines of sight in the figure the SZA at the tangent point is
OSIRIS has been in sun-synchronous orbit on the Odin satel- 90◦ . To retrieve the NO2 concentration at the tangent point
lite since October 2001 (Murtagh et al., 2002; Llewellyn of a given LOS, we need to know the NO2 concentration at
et al., 2004). There are 100 to 400 vertical profiles of limb- each shell altitude that the LOS passes through. For example,
scattered solar irradiance measured each day, at wavelengths the retrieved NO2 at 22 km depends on the NO2 at 32 km.
from 280 to 800 nm. NO2 is retrieved by spectral fitting in The NO2 at 32 km is retrieved at the tangent point, where the
the wavelength range from 435 to 477 nm for altitudes from SZA is 90◦ , but the 22 km line of sight passes through the
the cloud top to 39.5 km with a resolution of 2 km. 32 km shell when the SZA is around 86.8◦ on the near side
Earlier versions of the OSIRIS NO2 retrieval were devel- of the tangent point and 93.2◦ on the far side (left panel of
oped by Haley et al. (2004), Bourassa et al. (2011), and Sioris Fig. 3). The right panel of Fig. 3 shows that the NO2 con-
et al. (2017). The most recent data, version 7.0, are used here centration at 32 km and the two SZAs where the 22 km LOS
for validation of SAGE III/ISS NO2 . Version 7.0 improves passes through that shell are both different from the concen-
upon version 6.0 by using solar Fraunhofer lines to fit the tration when the SZA is 90◦ . In addition, the NO2 does not
spectral point spread function of OSIRIS rather than using change linearly across the terminator, so deviations from lin-
pre-flight calibration values. Cloud and aerosol discrimina- earity on either side of the LOS do not cancel out. Therefore
tion is also refined to better detect cloudy scenes and to push using the 32 km NO2 at 90◦ to retrieve the 22 km NO2 is in-
the retrieval farther into the UTLS (upper troposphere–lower accurate, and it cannot be assumed that the number density
stratosphere) following the method of Rieger et al. (2019). has a constant gradient across the terminator within a layer
The OSIRIS LOS is approximately aligned with the ter- of the atmosphere when performing the retrieval. This lack of
minator so the variation in SZA along the LOS is much spherical homogeneity can be accounted for by adding fac-
smaller than for occultation instruments. McLinden et al. tors to the retrieval that scale the NO2 according to SZA, at
(2006) studied the effect of the diurnal error on NO2 from each location along the LOS.
OSIRIS and found that it is only significant when the SZA is Ideally we would incorporate the scale factors by redo-
near 90◦ and the solar azimuth angle varies significantly from ing the conversion of slant path optical depth, obtained di-
90◦ . These extreme conditions occurred in 16 % of profiles rectly from the solar transmission measurements, to num-
from 2004, resulting in errors of up to 35 % in the OSIRIS ber density. As the SAGE III/ISS NO2 optical depth profiles
NO2 below 25 km. Sioris et al. (2017) used PRATMO to cre- are not publicly available, we instead start by undoing the
https://doi.org/10.5194/amt-14-557-2021 Atmos. Meas. Tech., 14, 557–566, 2021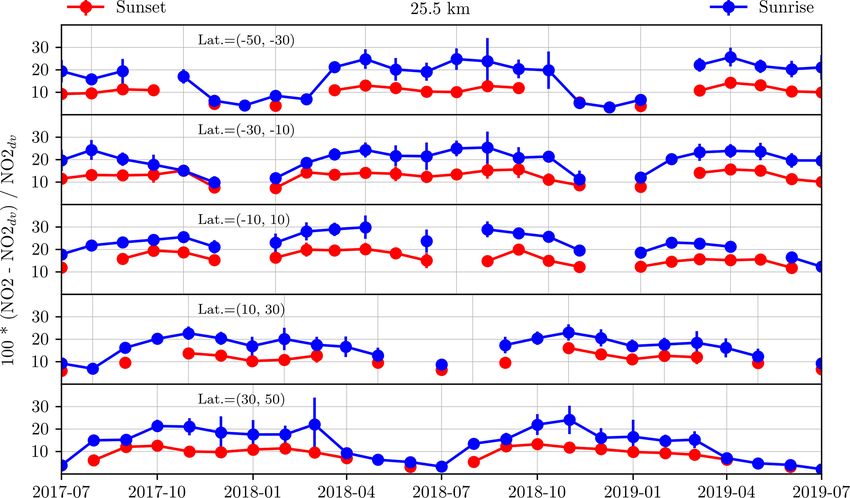
560                                                 K. Dubé et al.: Photochemical variation in NO2 in SAGE III/ISS retrieval

Figure 2. Geometry of a SAGE III occultation. The green semi-circle represents the Earth, and the blue semi-circles represent layers of the
atmosphere. The angle θtan is the SZA at the tangent point, and the angle θn is the SZA angle for a shell at altitude n.

Figure 3. (a) Change in SZA with shell altitude along two lines of sight for a simulated sunset occultation. (b) Change in NO2 at tangent
altitudes of 22 and 32 km for the same simulated sunset occultation. The dark, dotted lines correspond to the lines of sight from (a).

SAGE III/ISS retrieval to revert the number densities to opti-          NO2 cross section is the same in both Eqs. (1) and (2) and so
cal depths. This is done using the matrix equation                      it cancels out when finding ndv . Although this is not strictly
                                                                        the case, using a constant cross section is a reasonable ap-
τ = σ X0 n0 ,                                                  (1)      proximation as the cross section has a weak temperature and
                                                                        pressure dependence. The equations also assume that optical
where τ is the vertical profile of slant path optical depths            depth is constant within each layer of the atmosphere.
from NO2 , σ is the NO2 cross section, and n0 is the number                For a given SAGE III/ISS scan we know the date and time,
density profile. X0 is the path length matrix where each row            the tangent point position, the spacecraft position, and the
represents a LOS for a particular tangent point altitude, and           NO2 number density from the SAGE v5.1 retrieval. This in-
each column represents a different altitude through which the           formation is all that is needed to construct X0 . To build the
LOS passes. Each element of X0 is the path length distance              matrix we iterate through each LOS, moving from the tan-
between subsequent shells along the LOS. The path lengths               gent point to the top of the atmosphere. The LOS is the vector
on opposite sides of the tangent point are the same (i.e. the           from the satellite to the tangent point. The effect of refraction
distance from shell 1 to 2 on the instrument side of the tan-           is neglected as it is small at the altitudes being considered.
gent point is the same as the distance from shell 1 to 2 on the            The LOS for a particular tangent altitude intersects all of
sun side), which allows X0 to be written as an upper trian-             the shells above it. To find the scale factors for a given LOS,
gular matrix where values from opposite sides of the tangent            we first find the apparent local solar time at the midpoint of
point are added together.                                               each path created by the intersection of that LOS with the
   These optical depths are used to find the number densities           shells. PRATMO is then run with input ozone, temperature,
accounting for diurnal variations, ndv , using a new matrix,            and pressure from the SAGE III/ISS Level 2 scan data. The
Xdv ,                                                                   model NO2 is computed at each calculated LST and at a SZA
            −1                                                          of 90◦ , corresponding to the exact time of sunrise or sun-
ndv = σ −1 Xdv τ.                                              (2)
                                                                        set. For each shell altitude along the LOS, the scale factor is
In this matrix each path length includes a factor, explained            the PRATMO NO2 at that altitude (corresponding to the LST
below, that depends on the SZA at that location. Note that the          at that location) divided by the PRATMO NO2 at the tan-

Atmos. Meas. Tech., 14, 557–566, 2021                                                      https://doi.org/10.5194/amt-14-557-2021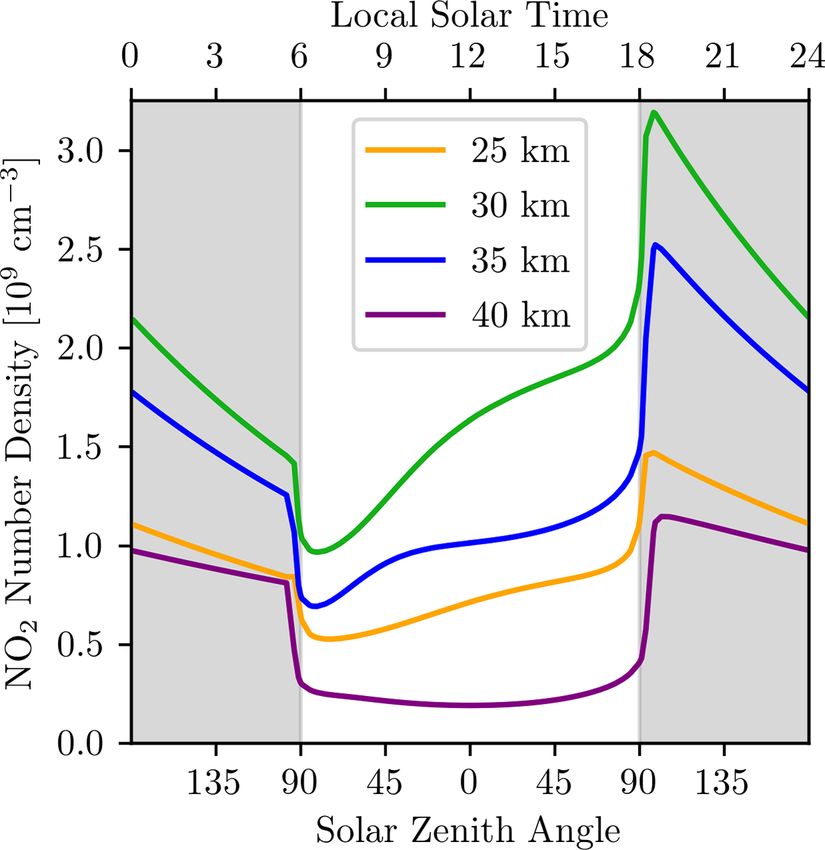
K. Dubé et al.: Photochemical variation in NO2 in SAGE III/ISS retrieval 561
The scaled path length matrix, Xdv , is equal to the initial
path length matrix, X0 , where each element has been mul-
tiplied by the corresponding element from the scale factor
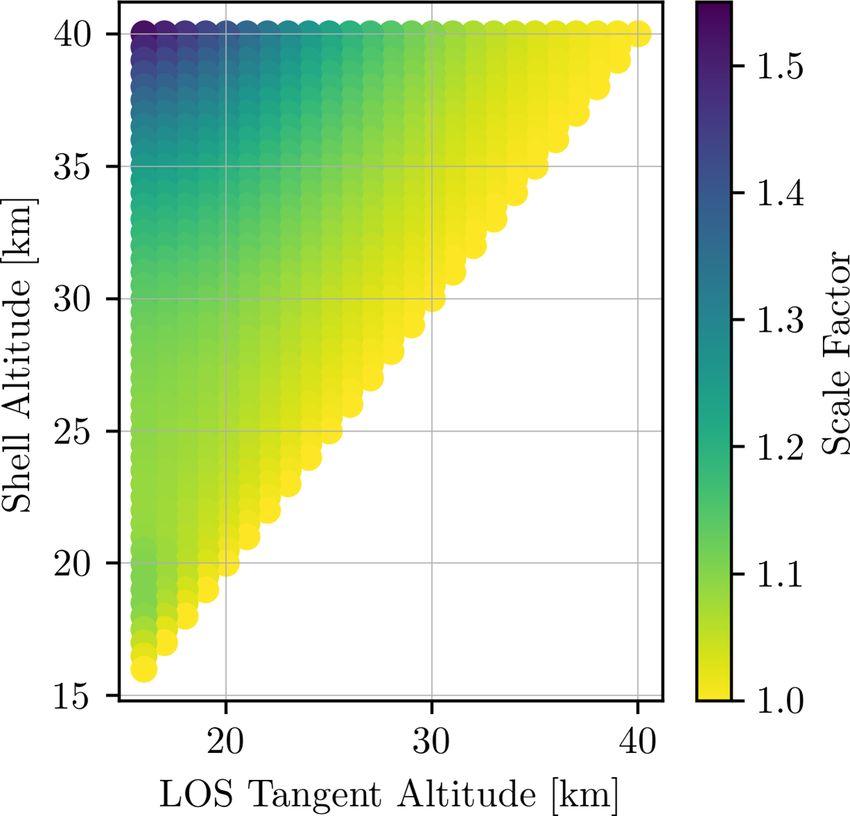
matrix shown in Fig. 4. Xdv is used along with the calcu-
lated slant path optical depths in Eq. (2) to get the NO2
number density, accounting for diurnal variations. The result-
ing values of ndv will be smaller than the original retrieved
values. This is because the gradient on the near side of the
LOS is smaller than the gradient on the far side, resulting in
scale factors greater than 1 and therefore lower NO2 . Fig-
ure 6 shows the results for a sample SAGE III/ISS event.
The left panel contains the optical depth profile, while the
center panel compares the SAGE III/ISS NO2 number den-
sity with the diurnally varying number density, and the right
panel shows the percent difference between the two number
density profiles. For this SAGE III/ISS event the percent dif-
ference between the two profiles becomes greater as altitude
decreases to 17 km. Below this point the difference starts to
become smaller again.
Figure 4. Scale factor matrix for a sunset occultation at the Equator
in March, simulated with PRATMO. The scale factors from either 5 Results
side of the tangent point are added together, resulting in an upper
triangular matrix.
The effect of accounting for diurnal variations on the re-
trieved SAGE III/ISS NO2 is quantified by the difference
between the SAGE v5.1 retrieval and the diurnally varying
gent point altitude for that LOS (the scale factor is 1 for the
retrieval (Fig. 7). In general the difference between the re-
shell containing the tangent point). There is no scaling done
trievals becomes greater than 20 % below 25 km, which is
above 40 km as the low amount of NO2 can lead to unphys-
larger than the reported random uncertainty in the SAGE
ically large-scale factors, despite small absolute differences
III/ISS NO2 . Including the diurnal variations is more impor-
in NO2 along the LOS. The uncertainty in the SAGE III/ISS
tant in the winter at high latitudes; at these times the relative
NO2 also becomes large above 40 km, and we want to pre-
NO2 decrease at sunrise and increase at sunset are larger. The
vent abnormal values from influencing the results at lower
bias between the retrievals is not consistent between the sun-
altitudes.
rise and sunset NO2 due to the differences in NO2 chemistry
Figure 4 shows the photochemical scale factor matrix for
at these times. This can be seen by looking at Fig. 1: the
a simulated event. The values in the figure are not multiplied
change in NO2 across the terminator has a different shape
by the path lengths. The matrix is created such that the scale
at sunrise than at sunset. Including diurnal variations along
factors from opposite sides of the tangent point need to be
the LOS in the retrieval has a greater effect on sunrise than
added together. This results in a scale factor that is equal to
sunset above 25 km in the tropics and everywhere at higher
1 along the diagonal, corresponding to unscaled values at the
latitudes.
tangent point, and greater than 1 everywhere else. The scale
The results presented in Fig. 7 are very similar to those in
factors increase as the path length component of the LOS
Brohede et al. (2007), where they estimated the magnitude
gets further away from the tangent point.
of neglecting diurnal variations in NO2 for a simulated oc-
It is also useful to look at the scale factor as a function
cultation instrument (not specific to SAGE II or III). They
of altitude along each LOS (Fig. 5). Lower lines of sight
found that the bias increases rapidly below 25 km (below the
pass through more layers of the atmosphere, resulting in
peak in NO2 density) and is larger at low latitudes for sunset.
greater scale factors. For lines of sight below about 30 km the
They also found that at high latitudes the bias is largest near
change in scale factor with altitude becomes non-linear. This
equinoxes, and sunrise values are slightly larger than sunset
is because the shape of the NO2 cycle across the terminator
values. It was determined that this effect was enough to ex-
changes with altitude (right panel of Fig. 3). At higher alti-
plain most of the difference between SAGE III/Meteor-3M
tudes the NO2 increases along the whole LOS; below about
and OSIRIS NO2 at low altitudes (although they did not ac-
30 km the NO2 starts to level out on the night side (the curve
tually apply the correction to the SAGE III/Meteor-3M data).
on either side of the terminator becomes different), changing
The magnitude of the photochemical effect is also sim-
the slope of the scale factor curves in Fig. 5.
ilar to that used in the Halogen Occultation Experiment
(HALOE; Russell III et al., 1993) retrieval. HALOE is one
https://doi.org/10.5194/amt-14-557-2021 Atmos. Meas. Tech., 14, 557–566, 2021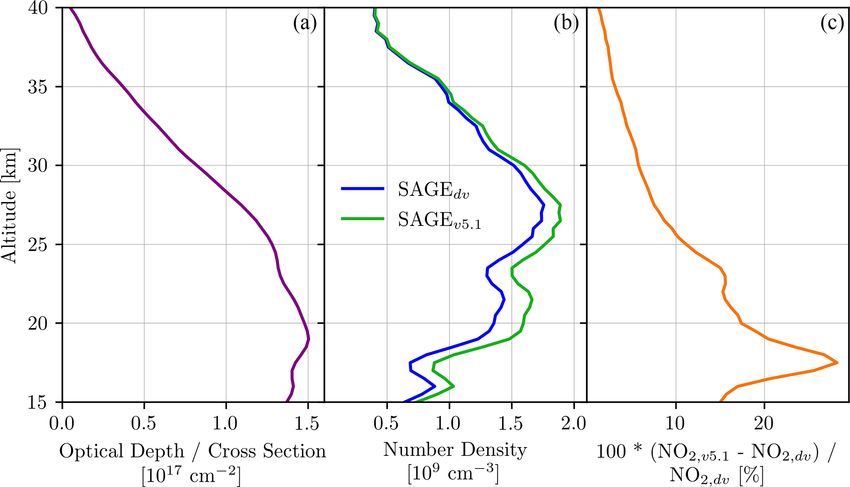
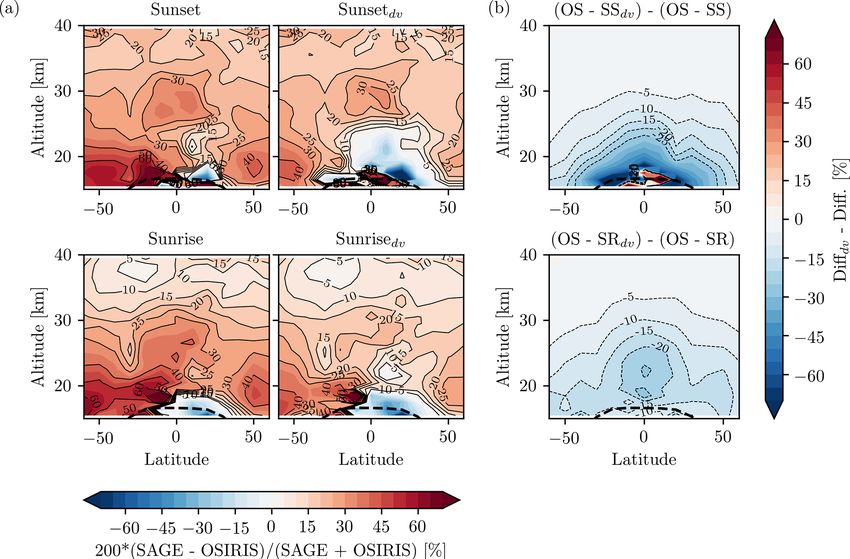
562                                                 K. Dubé et al.: Photochemical variation in NO2 in SAGE III/ISS retrieval

Figure 5. Scale factors along each line of sight for a sunset occultation at the Equator in March, simulated with PRATMO.

Figure 6. (a) NO2 optical depth. (b) NO2 number density for both the diurnally varying and SAGE v5.1 retrievals. (c) Percent difference
between the two number density profiles. Calculated for SAGE III/ISS event 967110.

occultation instrument that does include diurnal effects in the        for several latitude bins at 25.5 km. The sunset NO2 number
retrieval (Gordley et al., 1996). They use a factor based on re-       density decreases by about 5 % to 20 %, with the largest de-
sults from the previous layer and a model that provides the            creases occurring in the tropics. The effect of the diurnal vari-
NO2 mixing ratio as a function of SZA and season. This is              ations on the sunrise NO2 has a more pronounced seasonal
less accurate than the scale factors used in the present study,        cycle than sunset, with a greater decrease in the winter and a
which are modelled for each NO2 profile individually. The              difference ranging from 5 % to 30 %. During winter months
effect of the HALOE scaling is considered significant below            the diurnal effect is about 2 times greater at sunrise than at
25 hPa (≈ 27 km). They also found the diurnal effect in sun-           sunset, which is comparable to the difference reported for
rise to be 2–3 times larger than in sunset, which is greater           HALOE NO2 in Gordley et al. (1996). However during the
than the difference between sunrise and sunset observed here           summer the bias is similar for both sunrise and sunset. These
for SAGE III/ISS.                                                      variations in the time series should be considered when using
   Accounting for diurnal variations in the retrieval changes          the SAGE III/ISS NO2 data.
the SAGE III/ISS NO2 time series. This is shown in Fig. 8

Atmos. Meas. Tech., 14, 557–566, 2021                                                      https://doi.org/10.5194/amt-14-557-2021
K. Dubé et al.: Photochemical variation in NO2 in SAGE III/ISS retrieval                                                            563

Figure 7. Mean difference between the SAGE v5.1 and diurnally varying (dv) retrievals for SAGE III/ISS sunset and sunrise NO2 . The error
bars are the standard deviation. NO2 values more than 5 standard deviations from the mean are not included.

Figure 8. Mean difference between the SAGE v5.1 and diurnally varying (dv) retrievals for SAGE III/ISS sunset and sunrise NO2 at 25.5 km.
The error bars are the standard deviation.

https://doi.org/10.5194/amt-14-557-2021                                                     Atmos. Meas. Tech., 14, 557–566, 2021
564                                                 K. Dubé et al.: Photochemical variation in NO2 in SAGE III/ISS retrieval

Figure 9. (a) Zonal mean percent differences of SAGE III/ISS sunset and sunrise NO2 and OSIRIS NO2 coincident measurements for the
SAGE v5.1 and diurnally varying (dv) retrievals. The contour spacing is 5 %. The bold dashed line is the mean tropopause location. (b)
Difference between the columns in (a).

   Both the diurnally varying and SAGE v5.1 retrievals were          smaller SAGE III/ISS NO2 values. The sunset NO2 in partic-
compared with OSIRIS NO2 as a way to validate the data               ular decreases by up to 50 % below 25 km in the tropics. This
(panel a of Fig. 9). Only the morning (ascending node)               is larger than the initial difference between SAGE III/ISS and
OSIRIS measurements are used as a drift in the OSIRIS orbit          OSIRIS, resulting in the negative bias that is observed from
affects the descending node sampling. The comparisons were           15 to 25 km at low latitudes.
done for events within 24 h, 10◦ longitude, and 2◦ latitude, al-
though the exact choice of coincidence criteria has minimal
effect on the results. The SAGE III/ISS profiles were shifted        6   Conclusions
from sunrise and sunset to the OSIRIS measurement time
                                                                     We have developed a retrieval algorithm that uses publicly
using PRATMO. The SAGE III/ISS NO2 is generally biased
                                                                     available SAGE III/ISS data to account for changes in NO2
high compared to the OSIRIS NO2 , with a difference of up
                                                                     along the occultation line of sight that come from the pho-
to 50 % at low altitudes or high latitudes. The differences be-
                                                                     tochemically driven diurnal cycle. The retrieval relies upon
tween SAGE III/ISS and OSIRIS are within the combined
                                                                     scaling factors derived from a photochemical box model with
uncertainties of the instruments. In general the SAGE III/ISS
                                                                     input ozone, temperature, and pressure profiles taken from
sunrise measurements agree better with OSIRIS than sunset,
                                                                     the reported SAGE III/ISS scan.
which could be because OSIRIS measures close to sunrise.
                                                                        It was determined that the neglect of diurnal variations in
The comparison was also performed excluding OSIRIS pro-
                                                                     the SAGE v5.1 retrieval always biases the results high. Note
files with a SZA angle greater than 86◦ , where the diurnal
                                                                     that this high bias is present in NO2 retrieved from any occul-
effect is significant. This had a negligible effect on the differ-
                                                                     tation instrument that neglects diurnal variability. In the case
ence with SAGE III/ISS.
                                                                     of SAGE III/ISS NO2 , we found that carefully accounting
   Accounting for diurnal variations in the SAGE III/ISS re-
                                                                     for diurnal variations in the retrieval is quite important below
trieval improves agreement with OSIRIS by up to 20 % in the
                                                                     30 km, with an effect nearing 20 % on the resulting values.
mid-stratosphere (panel b of Fig. 9). Overall the diurnally
                                                                     The correction has the greatest effect at high winter latitudes
varying SAGE III/ISS NO2 agrees better with the OSIRIS
                                                                     and is more important for sunrise occultations than sunset.
NO2 than the SAGE v5.1 NO2 . The only region where this
                                                                     These are potentially important differences in the reported
is not true is near the tropical tropopause. This area is where
                                                                     NO2 densities in the lower stratosphere, where several in-
the diurnal effect becomes large (Fig. 7), resulting in much
                                                                     teresting chemical and dynamical science questions remain.

Atmos. Meas. Tech., 14, 557–566, 2021                                                   https://doi.org/10.5194/amt-14-557-2021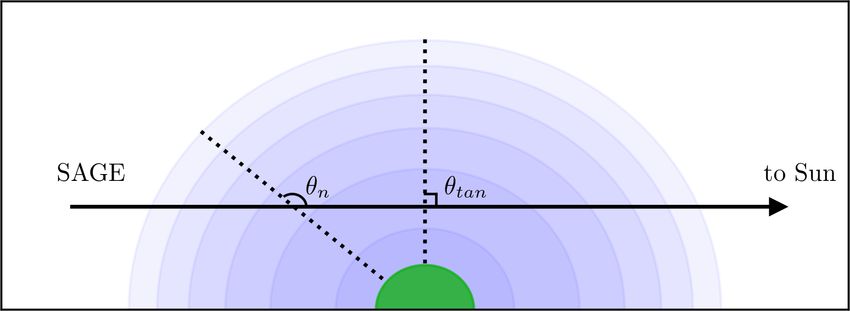
K. Dubé et al.: Photochemical variation in NO2 in SAGE III/ISS retrieval                                                              565

Including diurnal variations in the NO2 retrieval also has an         References
impact on the monthly zonal mean time series which should
be considered when studying long-term variability.                    Adams, C., Bourassa, A. E., McLinden, C. A., Sioris, C. E.,
   Accounting for these diurnal variations in the SAGE                  von Clarmann, T., Funke, B., Rieger, L. A., and Degen-
                                                                        stein, D. A.: Effect of volcanic aerosol on stratospheric NO2
III/ISS retrieval improves the agreement with OSIRIS NO2
                                                                        and N2 O5 from 2002–2014 as measured by Odin-OSIRIS
by up to 20 % at lower altitudes. While there is a remaining            and Envisat-MIPAS, Atmos. Chem. Phys., 17, 8063–8080,
bias between SAGE III/ISS and OSIRIS that is not well un-               https://doi.org/10.5194/acp-17-8063-2017, 2017.
derstood, it has a reasonable magnitude considering the very          Bourassa, A. E., McLinden, C. A., Sioris, C. E., Brohede, S.,
different measurement and retrieval techniques and is within            Bathgate, A. F., Llewellyn, E. J., and Degenstein, D. A.: Fast
their combined uncertainties.                                           NO2 retrievals from Odin-OSIRIS limb scatter measurements,
                                                                        Atmos. Meas. Tech., 4, 965–972, https://doi.org/10.5194/amt-4-
                                                                        965-2011, 2011.
Data availability. The SAGE III/ISS Level 1 and 2 data are            Brohede, S. M., Haley, C. S., McLinden, C. A., Sioris, C. E.,
available through https://search.earthdata.nasa.gov/ (last access:      Murtagh, D. P., Petelina, S. V., Llewellyn, E. J., Bazureau, A.,
1 August 2019) (NASA/LARC/SD/ASDC, 2017a, b). DOI links are             Goutail, F., Randall, C. E., Lumpe, J. D., Taha, G., Thomasson,
https://doi.org/10.5067/ISS/SAGEIII/SOLAR_HDF4_L1B-V5.1                 L. W., and Gordley, L. L.: Validation of Odin/OSIRIS strato-
and           https://doi.org/10.5067/ISS/SAGEIII/SOLAR_HDF4_           spheric NO2 profiles, J. Geophys. Res.-Atmos., 112, D07310,
L2-V5.1 respectively. The SAGE III/ISS NO2 that was re-                 https://doi.org/10.1029/2006JD007586, 2007.
trieved by accounting for diurnal variations is available at          Cisewski, M., Zawodny, J., Gasbarre, J., Eckman, R., Topiwala,
https://research-groups.usask.ca/osiris/data-products.php (Dubé,        N., Rodriguez-Alvarez, O., Cheek, D., and Hall, S.: The Strato-
2020). OSIRIS NO2 is also available at the previous link.               spheric Aerosol and Gas Experiment (SAGE III) on the Inter-
                                                                        national Space Station (ISS) Mission, in: Sensors, Systems, and
                                                                        Next-Generation Satellites XVIII, vol. 9241, p. 924107, Interna-
Author contributions. KD performed the analysis and prepared the        tional Society for Optics and Photonics, Amsterdam, the Nether-
manuscript. DZ assisted with writing the retrieval code. AB and DD      lands, 2014.
proposed the original idea for the project and provided guidance      Dubé, K.: SAGE III/ISS NO2 profiles retrieved by accounting
throughout. RD provided assistance with using the SAGE III/ISS          for diurnal variations, University of Saskatchewan Atmospheric
data. DF and WR, along with the other authors, provided significant     Research Group, available at: https://research-groups.usask.ca/
feedback on the analysis and the manuscript.                            osiris/data-products.php, last access: 6 August 2020.
                                                                      Dubé, K., Randel, W., Bourassa, A., Zawada, D., McLinden, C.,
                                                                        and Degenstein, D.: Trends and Variability in Stratospheric
                                                                        NOx Derived From Merged SAGE II and OSIRIS Satellite
Competing interests. The authors declare that they have no con-
                                                                        Observations, J. Geophys. Res.-Atmos., 125, e2019JD031798,
flicts of interest.
                                                                        https://doi.org/10.1029/2019JD031798, 2020.
                                                                      Galytska, E., Rozanov, A., Chipperfield, M. P., Dhomse, Sandip.
                                                                        S., Weber, M., Arosio, C., Feng, W., and Burrows, J. P.: Dynam-
Acknowledgements. The authors thank the Swedish National Space          ically controlled ozone decline in the tropical mid-stratosphere
Agency and the Canadian Space Agency for the continued opera-           observed by SCIAMACHY, Atmos. Chem. Phys., 19, 767–783,
tion and support of Odin-OSIRIS. We also thank the SAGE III/ISS         https://doi.org/10.5194/acp-19-767-2019, 2019.
science team for providing the SAGE III/ISS data. We thank Em-        Gordley, L. L., Russell III, J. M., Mickley, L. J., Frederick, J. E.,
manuel Dekemper and the one anonymous referee for their helpful         Park, J. H., Stone, K. A., Beaver, G. M., McInerney, J. M.,
comments on the manuscript.                                             Deaver, L. E., Toon, G. C., Murcray, F. J., Blatherwick, R. D.,
                                                                        Gunson, M. R., Abbatt, J. P. D., Mauldin III, R. L., Mount, G.
                                                                        H., Sen, B., and Blavier, J.-F.: Validation of nitric oxide and ni-
Financial support. Kimberlee Dubé, Adam Bourassa, and Dou-              trogen dioxide measurements made by the Halogen Occultation
glas Degenstein are funded by the Natural Sciences and Engineer-        Experiment for UARS platform, J. Geophys. Res.-Atmos., 101,
ing Research Council of Canada. SAGE III/ISS is a NASA Langley-         10241–10266, 1996.
managed mission funded by the NASA Science Mission Directorate        Haley, C. S., Brohede, S. M., Sioris, C. E., Griffioen, E.,
within the Earth Systematic Mission 30 Program. Enabling partners       Murtagh, D. P., McDade, I. C., Eriksson, P., Llewellyn,
are the NASA Human Exploration and Operations Mission Direc-            E. J., Bazureau, A., and Goutail, F.: Retrieval of strato-
torate, International Space Station Program, and European Space         spheric O3 and NO2 profiles from Odin Optical Spectro-
Agency. The National Center for Atmospheric Research is spon-           graph and Infrared Imager System (OSIRIS) limb-scattered sun-
sored by the US National Science Foundation.                            light measurements, J. Geophys. Res.-Atmos., 109, D16303,
                                                                        https://doi.org/10.1029/2004JD004588, 2004.
                                                                      Hendrick, F., Barret, B., Van Roozendael, M., Boesch, H., Butz,
Review statement. This paper was edited by Michel Van Roozen-           A., De Mazière, M., Goutail, F., Hermans, C., Lambert, J.-
dael and reviewed by Emmanuel Dekemper and one anonymous                C., Pfeilsticker, K., and Pommereau, J.-P.: Retrieval of nitro-
referee.                                                                gen dioxide stratospheric profiles from ground-based zenith-
                                                                        sky UV-visible observations: validation of the technique through

https://doi.org/10.5194/amt-14-557-2021                                                     Atmos. Meas. Tech., 14, 557–566, 2021
566 K. Dubé et al.: Photochemical variation in NO2 in SAGE III/ISS retrieval correlative comparisons, Atmos. Chem. Phys., 4, 2091–2106, Newchurch, M. J., Allen, M., Gunson, M. R., Salawitch, R. J., https://doi.org/10.5194/acp-4-2091-2004, 2004. Collins, G. B., Huston, K. H., Abbas, M. M., Abrams, M. C., Liley, J. B., Johnston, P. V., McKenzie, R. L., Thomas, A. J., and Chang, A. Y., Fahey, D. W., Gao, R. S., Irion, F. W., Loewenstein, Boyd, I. S.: Stratospheric NO2 variations from a long time series M., Manney, G. L., Michelsen, H. A., Podolske, J. R., Rinsland, at Lauder, New Zealand, J. Geophys. Res.-Atmos., 105, 11633– C. P., and Zander, R.: Stratospheric NO and NO2 abundances 11640, https://doi.org/10.1029/1999JD901157, 2000. from ATMOS Solar-Occultation Measurements, Geophys. Res. Llewellyn, E. J., Lloyd, N. D., Degenstein, D. A., Gattinger, R. L., Lett., 23, 2373–2376, https://doi.org/10.1029/96GL01196, 1996. Petelina, S. V., Bourassa, A. E., Wiensz, J. T., Ivanov, E. V., Park, M., Randel, W. J., Kinnison, D. E., Bourassa, A. E., McDade, I. C., Solheim, B. H., McConnell, J. C., Haley, C. S., Degenstein, D. A., Roth, C. Z., McLinden, C. A., Sioris, von Savigny, C., Sioris, C. E., McLinden, C. A., Griffioen, E., C. E., Livesey, N. J., and Santee, M. L.: Variability Kaminski, J., Evans, W. F., Puckrin, E., Strong, K., Wehrle, of Stratospheric Reactive Nitrogen and Ozone Related to V., Hum, R. H., Kendall, D. J., Matsushita, J., Murtagh, D. P., the QBO, J. Geophys. Res.-Atmos., 122, 10103–10118, Brohede, S., Stegman, J., Witt, G., Barnes, G., Payne, W. F., https://doi.org/10.1002/2017JD027061, 2017. Piché, L., Smith, K., Warshaw, G., Deslauniers, D. L., Marc- Prather, M.: Catastrophic loss of stratospheric ozone in dense hand, P., Richardson, E. H., King, R. A., Wevers, I., McCreath, volcanic clouds, J. Geophys. Res.-Atmos., 97, 10187–10191, W., Kyrölä, E., Oikarinen, L., Leppelmeier, G. W., Auvinen, H., https://doi.org/10.1029/92JD00845, 1992. Mégie, G., Hauchecorne, A., Lefèvre, F., de La Nöe, J., Ricaud, Prather, M. and Jaffe, A. H.: Global impact of the Antarctic ozone P., Frisk, U., Sjoberg, F., von Schéele, F., and Nordh, L.: The hole: Chemical propagation, J. Geophys. Res.-Atmos., 95, 3473– OSIRIS instrument on the Odin spacecraft, Can. J. Phys., 82, 3492, https://doi.org/10.1029/JD095iD04p03473, 1990. 411–422, https://doi.org/10.1139/p04-005, 2004. Preston, K. E., Jones, R. L., and Roscoe, H. K.: Retrieval of NO2 Mauldin III, L. E., Salikhov, R., Habib, S., Vladimirov, A. G., Car- vertical profiles from ground-based UV-visible measurements: raway, D., Petrenko, G., and Comella, J.: Meteor-3M (1)/Strato- Method and validation, J. Geophys. Res.-Atmos., 102, 19089– spheric Aerosol and Gas Experiment III (SAGE III) jointly spon- 19097, https://doi.org/10.1029/97JD00603, 1997. sored by the National Aeronautics and Space Administration and Randel, W. J., Wu, F., Russell III, J. M., and Waters, J.: Space- the Russian Space Agency, in: Optical Remote Sensing of the time patterns of trends in stratospheric constituents derived from Atmosphere and Clouds, vol. 3501, pp. 355–365, International UARS measurements, J. Geophys. Res.-Atmos., 104, 3711– Society for Optics and Photonics, Beijing, China, 1998. 3727, https://doi.org/10.1029/1998JD100044, 1999. McCormick, M.: Sage II: An overview, Adv. Space Res., 7, 219– Rieger, L. A., Zawada, D. J., Bourassa, A. E., and Degenstein, 226, https://doi.org/10.1016/0273-1177(87)90151-7, 1987. D. A.: A Multiwavelength Retrieval Approach for Improved McLinden, C. A., Olsen, S. C., Hannegan, B., Wild, O., OSIRIS Aerosol Extinction Retrievals, J. Geophys. Res.-Atmos., Prather, M. J., and Sundet, J.: Stratospheric ozone in 3- 124, 7286–7307, https://doi.org/10.1029/2018JD029897, 2019. D models: A simple chemistry and the cross-tropopause Russell III, J. M., Gordley, L. L., Park, J. H., Drayson, S. R., flux, J. Geophys. Res.-Atmos., 105, 14653–14665, Hesketh, W. D., Cicerone, R. J., Tuck, A. F., Frederick, J. E., https://doi.org/10.1029/2000JD900124, 2000. Harries, J. E., and Crutzen, P. J.: The Halogen Occulta- McLinden, C. A., Haley, C. S., and Sioris, C. E.: Diurnal ef- tion Experiment, J. Geophys. Res.-Atmos., 98, 10777–10797, fects in limb scatter observations, J. Geophys. Res.-Atmos., 111, https://doi.org/10.1029/93JD00799, 1993. D14302, https://doi.org/10.1029/2005JD006628, 2006. SAGE III Algorithm Theoretical Basis Document: SAGE Murtagh, D., Frisk, U., Merino, F., Ridal, M., Jonsson, A., Stegman, III Algorithm Theoretical Basis Document (ATBD) So- J., Witt, G., Eriksson, P., Jiménez, C., Megie, G., de la Noë, J., lar and Lunar Algorithm, Tech. Rep., LaRC 475-00-109, Ricaud, P., Baron, P., Pardo, J. R., Hauchcorne, A., Llewellyn, available at: https://eospso.gsfc.nasa.gov/sites/default/files/atbd/ E. J., Degenstein, D. A., Gattinger, R. L., Lloyd, N. D., Evans, atbd-sage-solar-lunar.pdf (last access: 19 January 2021), 2002. W. F., McDade, I. C., Haley, C. S., Sioris, C., von Savigny, C., Sioris, C. E., Rieger, L. A., Lloyd, N. D., Bourassa, A. E., Roth, Solheim, B. H., McConnell, J. C., Strong, K., Richardson, E. H., C. Z., Degenstein, D. A., Camy-Peyret, C., Pfeilsticker, K., Leppelmeier, G. W., Kyrölä, E., Auvinen, H., and Oikarinen, L.: Berthet, G., Catoire, V., Goutail, F., Pommereau, J.-P., and An overview of the Odin atmospheric mission, Can. J. Phys., 80, McLinden, C. A.: Improved OSIRIS NO2 retrieval algorithm: 309–319, https://doi.org/10.1139/p01-157, 2002. description and validation, Atmos. Meas. Tech., 10, 1155–1168, NASA/LARC/SD/ASDC: SAGE III/ISS L1B Solar https://doi.org/10.5194/amt-10-1155-2017, 2017. Event Transmission Data (HDF-EOS) V051, NASA Langley Atmospheric Science Data Center DAAC, https://doi.org/10.5067/ISS/SAGEIII/SOLAR_HDF4_L1B- V5.1, 2017a. NASA/LARC/SD/ASDC: SAGE III/ISS L2 Solar Event Species Profiles (HDF-EOS) V051, NASA Lan- gley Atmospheric Science Data Center DAAC, https://doi.org/10.5067/ISS/SAGEIII/SOLAR_HDF4_L2-V5.1, 2017b. Atmos. Meas. Tech., 14, 557–566, 2021 https://doi.org/10.5194/amt-14-557-2021
You can also read