Contribution of meteor flux in the occurrence of sporadic-E (Es) layers over the Arabian Peninsula
←
→
Page content transcription
If your browser does not render page correctly, please read the page content below
Ann. Geophys., 39, 471–478, 2021
https://doi.org/10.5194/angeo-39-471-2021
© Author(s) 2021. This work is distributed under
the Creative Commons Attribution 4.0 License.

Contribution of meteor flux in the occurrence of sporadic-E (Es)
layers over the Arabian Peninsula
Muhammad Mubasshir Shaikh1 , Govardan Gopakumar1,3 , Aisha Abdulla Al-owais2 , Maryam Essa Sharif2 , and
Ilias Fernini1,2,3
1 Space Weather and Ionosphere Laboratory, Sharjah Academy for Astronomy, Space Sciences and Technology,
University of Sharjah, Sharjah, UAE
2 UAE Meteor Monitoring Network, Sharjah Academy for Astronomy, Space Sciences and Technology,

University of Sharjah, Sharjah, UAE
3 Department of Applied Physics & Astronomy, University of Sharjah, Sharjah, UAE

Correspondence: Muhammad Mubasshir Shaikh (mshaikh@sharjah.ac.ae)

Received: 8 November 2020 – Discussion started: 24 November 2020
Revised: 30 March 2021 – Accepted: 11 April 2021 – Published: 28 May 2021

Abstract. A sporadic-E (Es) layer is generally associated        ground meteor flux. There is a vast amount and variety of
with a thin-layered structure present in the lower ionosphere,   meteoroid material entering the atmosphere every day (Ce-
mostly consisting of metallic ions. This metallic ion layer      plecha et al., 1998), and its deposition is highly variable spa-
is formed when meteors burn in the upper atmosphere, re-         tially as well as temporally. These variations are attributed to
sulting in the deposition of free metal atoms and ions. Many     the inconsistency of the meteoroid material density surround-
studies have attributed the presence of the Es layer to the      ing the Earth, seasonal changes of the atmosphere and the
metallic ion layer, specifically when the layer is observed      Earth’s movement around the Sun, the methods of observ-
during the nighttime. Using data from a network of meteor        ing them such as the geographical location of the observing
monitoring towers and a collocated digital ionosonde radar       site, and geometrical factors related to the observing instru-
near the Arabian Peninsula, in this paper, we report our ob-     ments’ capability and positions of sources. This extraterres-
servations of Es layer occurrences together with the meteor      trial influx changes the metallic composition of the Earth’s
count. The trend of monthly averages of Es layer intensity       atmosphere and lower ionosphere. This happens when mete-
shows a maximum in late spring and early summer months           ors burn in the dense atmosphere, resulting in the heating
and a minimum in winter months, whereas the meteor counts        and deposition of free metal atoms and ions (Ceplecha et
were highest in winter months and lowest in spring and early     al., 1998). It is now a well-established fact that the perma-
summer months. This shows that the presence of the Es layer      nent ionized metal layer in the lower ionosphere, at around
and the meteor counts have no correlation in time, both diur-    90–130 km altitude, is due to the ablation of meteors in that
nally and seasonally. This leads us to conclude that the pres-   region (Plane et al., 2015). Meteor observations can be per-
ence of meteors is not the main cause of the presence of the     formed with the radio (Stober and Chau, 2015; Lima et al.,
Es layer over the Arabian Peninsula.                             2015; Yi et al., 2016) as well as with visual means (Vitek and
                                                                 Nasyrova, 2018; Kozlowski et al., 2019; Fernini et al., 2020).
                                                                 Detection using visual cameras can only be performed dur-
                                                                 ing the night compared to radio-based observations that can
1   Introduction                                                 be performed throughout the day and suitable for estimating
                                                                 total meteor activity. A combination of multiple types of ob-
Meteors are the visible appearance of extraterrestrial dust,     servations may also be used (Brown et al., 2017).
generally known as meteoroids. They appear in the sky when          Kopp (1997) showed that the thin-layered structured
meteoroids ablate in the Earth’s atmosphere. Meteors can be      sporadic-E (Es) layer in the Earth’s ionosphere, lying in the
categorized as being either part of a shower or of the back-

Published by Copernicus Publications on behalf of the European Geosciences Union.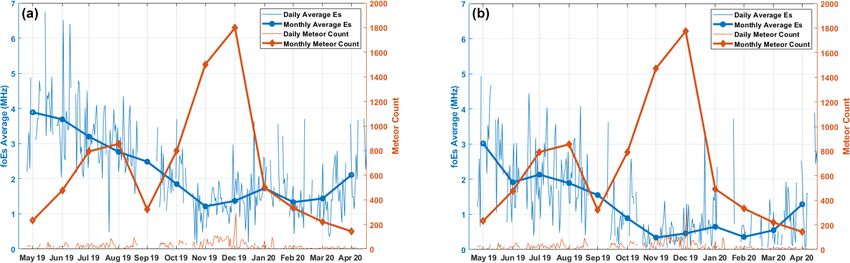
472 M. M. Shaikh et al.: Sporadic-E and meteor flux
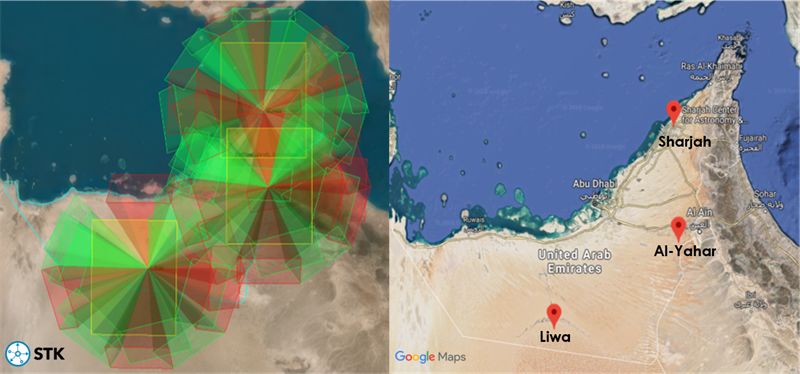
altitude range of 90–130 km, mostly consists of ionized metal https://www.agi.com/products/50stk, last access: 16 Septem-
atoms FeC, MgC, and NaC. At mid-latitudes, the so-called ber 2020) as shown in Fig. 1a, the towers’ locations were se-
“wind-shear” theory is thought to be the mechanism respon- lected as illustrated in Fig. 1b (made using ©Google Maps).
sible for this formation (Whitehead, 1989). Therefore, the In Fig. 1, the green color represents the area of the sky cov-
intensity and occurrence of the Es layer are expected to be ered by the 8 mm lenses, while red represents the coverage
proportional to the amount of metal ion content in the lower of the 6 mm lenses. The yellow squares show what the wide-
ionosphere and its chemical processes as well as meteoro- angle lens can see and cover. Thus, the STK simulation illus-
logical processes in the lower ionosphere (Feng et al., 2013; trates how much each tower covers the UAE sky, which adds
Yu et al., 2015). The nature of the Es layer observed globally up to 70 % coverage of the sky. Each of the three UAEMMN
has been a function of many factors, such as geographical towers employs the use of the UFOCapture software devel-
latitude or observing instruments’ sensitivity of the viewing oped by SonotaCo (SonotaCo, 2005) to detect meteor occur-
system. For example, the Es layer can be observed at almost rences. The software can detect movements from the feed of
all times at some geographical locations around the globe the cameras on the towers. If a movement or action is de-
(Shaikh et al., 2020a, b), thus making the term “sporadic” tected, it writes the video of the action to the hard disk of
misleading. The behavior of the Es layer over the Arabian the computer, from a few seconds before the action is recog-
Peninsula has not been studied by many. Recently, Shaikh et nized to a few seconds after the action is completed. During
al. (2020a, b) demonstrated the relationship between L-band the night, the bright streaks produced by a meteor burning up
scintillation and the occurrence of the Es layer over the Ara- in the atmosphere allow the software to detect movements
bian Peninsula. The study also revealed a consistent presence from the sudden changes easily in pixel values.
of the Es layer during the nighttime hours, between sunset Two other software packages, UFOAnalyzer and UFOOr-
and sunrise. bit, also developed by SonotaCo (SonotaCo, 2007a, b), are
In this paper, we report the observations of the Es layer used to calculate parameters that define the meteorite. UFO-
and the meteor counts simultaneously observed during night- Analyzer can calculate the direction and elevation of the me-
time over the Arabian Peninsula region for the first time. A teorite occurrence. If the meteorite is detected by two or more
well-established presence of the Es layer can be observed sites, UFOOrbit can calculate the orbit and the radiant point
during all daytime and nighttime hours, with higher in- of the meteorite. Figure 2 shows a radiant map obtained as
tensity around midday hours and lesser intensity at early a result of analyses by the software. The radiant map shows
morning and nighttime hours. A consistent meteor count is radiant points on a sinusoidal projection map of the observed
also present throughout the 1-year observation period (May meteors, which is defined as the point in the sky from which
2019–April 2020) reported in this work. It has been observed the path of the observed meteor begins. For a radiant point
that the presence of meteors is not the main cause of the pres- to be plotted on the map by the software, double detection of
ence of nighttime Es over the Arabian Peninsula since the Es the meteor should occur, meaning that two cameras from at
layer intensity (average critical frequencies of the Es layers – least two different towers need to observe the same meteor.
foEs) shows no seasonal correlation with the number of me- Figure 2 shows the radiant points of meteors observed by
teors observed. The dependence of Es layer intensity (foEs) the Sharjah and Al-Yahar towers during the period between
due to meteor count has been calculated using linear corre- May 2019 and April 2020. On the map, constellations such
lation coefficients. Negative values of correlation coefficient as Orionids and Taurids are denoted as J5_Orio, J5_nTa, and
show an anti-correlation relationship between the two data sTa, respectively. Hence, the radiant points that are close to a
sets. constellation imply that they belong to the respective meteor
group. In this figure, there are meteors that belong to the Ori-
onids meteor shower as well as Southern and Northern Tau-
2 Data and methodology rids and several others, in addition to sporadic meteors that
do not belong to any shower. By locating the radiant points
The meteor counts for this study have been obtained in on the map, the network ensures its accuracy in terms of link-
collaboration with the UAE (United Arab Emirates) Me- ing a meteor to its respective shower. The radiant velocity is
teor Monitoring Network (UAEMMN) project (Fernini et color coded as shown in the figure.
al., 2020). The project aims to monitor and detect meteor The critical frequency of the Es layer (foEs) of the iono-
occurrences in the region above the United Arab Emirates sphere is obtained from the ionosonde collocated with the
from sunset to sunrise. To achieve this, three monitoring Sharjah meteor monitoring tower. The ionosonde records one
towers have been constructed and installed in different parts ionogram every 15 min, and it has been in operation since
of the country. For each tower, 16 cameras are distributed May 2019. All ionogram-derived parameters used in this
along with a ring-like structure with lenses of 6 and 8 mm, study have been manually scaled. All the data used in this
while the 17th camera utilizes a wide-angle lens and is lo- study are available from SWI Lab (2020). Since the data
cated at the center of the structure (Fernini et al., 2020). Fol- from the meteor towers are only available from nighttime
lowing a simulation using Systems Tool Kit software (STK: observations and the data from the ionosonde are observed
Ann. Geophys., 39, 471–478, 2021 https://doi.org/10.5194/angeo-39-471-2021M. M. Shaikh et al.: Sporadic-E and meteor flux 473
Figure 1. (a) Sky coverage simulation by all cameras using Systems Tool Kit (STK). (b) Location of the towers pinpointed on the UAE map
using © Google Maps.
Table 1. Location of the instruments used to generate data for this study.
Instruments Geographical lat Geographical long Specification
Sharjah Digital Ionosonde 25.285381◦ N 55.464417◦ E Freq. range = 1–30 MHz
Sharjah Meteor Monitoring Tower 25.235611◦ N 55.539645◦ E CCD cameras
Al-Yahar Meteor Monitoring Tower 24.285922◦ N 55.463625◦ E CCD cameras
Liwa Meteor Monitoring Tower 23.104722◦ N 53.754828◦ E CCD cameras
throughout the day and night, the daily Es intensity (average of monthly averages of the Es layer intensity shows a maxi-
foEs value) has been used to compare with the daily meteor mum in late spring and early summer months and a minimum
count to study the impact of the number of meteors present in winter months (except for a slight peak in January). At the
and their influence on the presence of Es (Haldoupis et al., other end, the monthly meteor count shows an opposite trend
2007). with a larger number of meteors observed during November–
December 2019 and very low numbers in the spring and sum-
mer months. Both Fig. 4a and b show a very similar trend for
3 Discussion foEs averages. The difference is in the intensity of the Es
layer, which is greater when all observations are considered
Figure 3 shows the observation of the Es layer and meteor due to the inclusion of the daytime Es layer observations. The
count. Figure 3a and b show that a constant presence of Es meteor count is the same in both cases since we have only ob-
can be observed throughout the year and all hours of the day, served meteors through visual cameras during the nighttime.
with higher intensity (average foEs) around midday hours The observations presented in Fig. 4 are inconsistent with
and lesser intensity at early morning and nighttime hours. Younger et al. (2009), who reported meteor flux data ob-
An important point to note here is that this observation was served by radars installed at Esrange (68◦ N), Ascension Is-
performed during a time when the solar activity was low. The land (8◦ S), and Rothera (68◦ S). They showed that, for high
average F10.7 solar radio flux value during a 1-year observa- latitudes, there is a clear annual cycle present where the max-
tional period was recorded as 69.43 sfu. Only geomagneti- imum count rate is observed in summer, whereas for low-
cally quiet days with an average daily Kp value of less than latitude Ascension Island, the maximum count rates were
3 were selected for the analysis. It is expected that the Es observed for both solstices (summer and winter). Similar ob-
layer observations would be more substantial as solar cycle servations were also reported by Singer et al. (2004) using a
25 gets stronger in the coming years. Figure 3c shows the meteor radar situated at the ALOMAR observatory (69◦ N)
hourly meteor count for the whole 1-year observational pe- and Haldoupis et al. (2007) from European latitudes.
riod. No observations were recorded during the daytime. There have been other studies that correlate meteor activ-
Figure 4 shows a comparison between the daily and ity with the Es layer seen in ionograms, examples of which
monthly meteor counts with daily and monthly averages include Chandra et al. (2001), Haldoupis et al. (2007), and
of foEs. Figure 4a shows all daily observations (24 h), and Ellyet and Goldsborough (1976). There are also numerous
Fig. 4b provides observations for nighttime only. The trend studies whose results are inconclusive. For example, Bagga-
https://doi.org/10.5194/angeo-39-471-2021 Ann. Geophys., 39, 471–478, 2021474 M. M. Shaikh et al.: Sporadic-E and meteor flux Figure 2. A radiant map of meteor observations by the Sharjah and Al-Yahar stations during the period May 2019–April 2020. Figure 3. Simultaneous monitoring of meteors and the Es layer over the Arabian Peninsula from May 2019 to April 2020. (a) Es occurrence frequency as a function of local time. (b) Hourly average of foEs recorded using ionosonde. (b) Hourly meteor count. ley and Steel (1984) were unable to find any correlation be- various electrodynamic processes in the ionosphere. These tween meteor activity and the Es layers’ occurrence. Kotadia instabilities are triggered by the enhancement of plasma den- and Jani (1967) reported that they did not find any increase sity in a particular volume when an external force acts on in the occurrence of the Es layers during a period of anoma- that same volume. A small disturbance can then lead to the lously large increase in meteor incidence in 1963 but instead separation of charges, which produces a small electric field, found that the Es layers were formed less frequently during which with the presence of the geomagnetic field increases that period, suggesting an inverse relationship between the the disturbance (Simon, 1963). Meteoric activity may pro- formation of the Es layers or meteor incidents. The results vide metallic ions to the ionosphere, but they may not be dis- presented in this paper also follow a similar pattern, with played in ionograms if the conditions are unfavorable. The foEs decreasing significantly during the period between Oc- aforementioned instabilities have been shown to be capable tober 2019 and January 2020, even with the increased meteor of producing the diffuse type of Es layer (Tsuda et al., 1969). count during that period (see Fig. 4). This may be because The formation of this diffuse layer may cause the ionogram plasma density abnormalities may exist which may cause to display scatter echoes that exceed the actual critical fre- ionograms to record scatter echoes beyond the foEs. Cross- quency of the sporadic-E layer formed as a result of metallic field plasma instabilities cause the abnormalities due to the ions deposited by meteors. This may be why a good corre- Ann. Geophys., 39, 471–478, 2021 https://doi.org/10.5194/angeo-39-471-2021
M. M. Shaikh et al.: Sporadic-E and meteor flux                                                                                         475

Figure 4. Daily and monthly averages of foEs and meteor count over Sharjah. (a) Including all observations (24 h). (b) Nighttime observations
only.

                                                                         the development of E layers (Pancheva et al., 2003). The me-
                                                                         teor count may also be influenced by some biases. A num-
                                                                         ber of the recorded meteors may not be metallic in nature
                                                                         and would not deposit any metallic ions in the ionosphere,
                                                                         possibly explaining why a higher meteor count during win-
                                                                         ter months did not amount to a higher average foEs. Nev-
                                                                         ertheless, visual meteor counts may not include all meteors.
                                                                         The metallic ions deposited by a meteor in the ionosphere
                                                                         may not be proportional to the meteoric activity as well (Hal-
                                                                         doupis et al., 2007). The exact relationship between metallic
                                                                         ion densities and meteoric activity is unknown, and the trans-
                                                                         portation of metallic ions by neutral winds is not accounted
                                                                         for. Due to these uncertainties, the incongruous relationship
Figure 5. Relationship between foEs monthly averages and                 between foEs and visual meteors count is not unexpected;
monthly meteor count observed at Sharjah.                                however, they are not enough to explain the incongruity. An-
                                                                         other possible scenario arises when neutral winds are consid-
                                                                         ered, which could transport metallic ions to the local iono-
                                                                         sphere under study irrespective of the number of observed
lation between meteor activity and the Es layer is not seen
                                                                         meteors (Haldoupis et al., 2007). This may be an explanation
(Chandra et al., 2001), which is also confirmed by the cor-
                                                                         of the inverse correlation between foEs and meteor counts
relation plot in Fig. 5. It is shown in Fig. 5 that the annual
                                                                         observed during summer months.
variation of both observations, on average, does not corre-
                                                                            One can expect to see a meteor entering the Earth’s atmo-
late monthly, having linear correlation coefficients less than
                                                                         sphere every 10 min or so, but there are predictable times dur-
−0.35 (negative 0.35) for both full-day and nighttime obser-
                                                                         ing the year when the Earth’s atmosphere is full of them, and
vations.
                                                                         these are referred to as meteor showers (Kronk, 2014). These
   Figure 4 shows differences between the variations in
                                                                         showers occur monthly, with some meteor showers more pro-
foEs and meteor counts observed at both small and large
                                                                         nounced than others, depending on their parents’ progenitors
timescales. The Es layer may be affected by differences in
                                                                         (Collins, 2020). We can see about 30 meteor showers dur-
climatology and wind dynamics. For example, long-period
                                                                         ing the year. Since the meteors in each shower seem to come
zonal and meridional winds at the mesopause region, with
                                                                         from a certain point in the sky, the shower is named after
periods between 2 and 18 d, may be considered to be plan-
                                                                         the constellation from which the meteors come. The Quad-
etary wave activity. Planetary waves have been observed to
                                                                         rantids, the Perseids, and the Geminids are the most promi-
have strong variability between different seasons, with peri-
                                                                         nent of all meteor showers. Table 2 shows the data obtained
ods of 2 d in the summer, 5 d in spring, and even exceeding
                                                                         from the UAEMMN network about the meteor showers. The
10 d during the winter (Jacobi et al., 1998). Studies have pro-
                                                                         data are taken from the same 1-year study period used in
posed vortex flows associated with planetary waves to ex-
                                                                         this work. We can clearly observe that most meteor show-
plain the seasonal dependence of sporadic-E layers (Shal-
                                                                         ers occurred from the period from August to December and
imov et al., 1999). Vortex flows are already known to affect

https://doi.org/10.5194/angeo-39-471-2021                                                           Ann. Geophys., 39, 471–478, 2021
476 M. M. Shaikh et al.: Sporadic-E and meteor flux
Table 2. Meteor showers observed by the UAEMMN network.
Constellation Hourly dates Rate Speed Shower Quantity from the
(km/s) name UAEMMN towers
Capricorn 3 July–15 August 5 41 Capricornids 6
Perseus 10–14 August 40 60 Perseids 2
Taurus 1–7 November 8 30 Taurids 10
Gemini 10–13 December 50 35 Geminids 17
Monocerous 5–20 December 15 35 Monocerotids 2
Hydra 3–15 December 3 58 Hydrids 4
resulted in a significant increase in the numbers of visual me- the ionosphere, but they may not be displayed in ionograms
teors observed in the UAE (see Fig. 4). However, it seems if the conditions are unfavorable. This may have been the
quite understandable here that not all those meteor showers reason why a good correlation between meteor activity and
contributed to the presence of the Es layer in the UAE since the Es layer intensity cannot be seen by our two collocated
the Es layer observations were higher in summer than during instruments. Such results have rarely been reported in the
the winter months. literature and do not comply with frequently reported stud-
The Es layer may not be observed if the meteoric activ- ies which established a strong seasonal correlation between
ity period does not provide long-lived metallic ions in the daily meteor counts with daily averages of the Es layer oc-
background plasma density. However, under favorable condi- currences, as mentioned in the references above. It is also
tions, the meteoric debris consisting mostly of metallic ions important to note that this study, unlike many of the previ-
could be converged to form sharp layers of ionization lead- ous studies, used visual observations for observing meteors.
ing to density gradients responsible for ionospheric irregular- Since the data are manually checked and verified from the
ities and spreading of the echoes in the ionograms. Since the recorded visual data, unlike for radio-based radar observa-
ionospheric background conditions considerably vary with tions where the rate of false observations is very high, the
latitudinal region, simultaneous observations from different study is likely to provide a real picture since there is very
geographical regions would be needed to confirm a certain little chance of having false data. Nevertheless, the authors
meteoric activity and its linkage with the appearance of the believe that a more detailed study is required to fully investi-
Es layer. Therefore, a thorough analysis using the systematic gate and properly identify the Es layer seasonal dependence
analysis of past data taken simultaneously from different lat- on the meteor influx in the region around the Arabian Penin-
itudinal regions yields a better picture of the role of meteoric sula.
activity in the E-region ionization.
Data availability. All data used in this work are available from
4 Conclusions the dataverse of SWI Lab and acquired and managed by the
Sharjah Academy for Astronomy, Space Sciences and Technol-
In this paper, simultaneous observations of foEs and the me- ogy (https://dataverse.harvard.edu/dataset.xhtml?persistentId=doi:
teoric influx (meteor count rates through visual cameras) 10.7910/DVN/U2UNWE, last access: 2 November 2020, SWI Lab,
2020).
show no diurnal or seasonal dependence over the Arabian
Peninsula. We report the seasonal observations of the Es
layer simultaneously taken with the visual count observations
Author contributions. MMS, as principal investigator, performed
from a geographical region which has not been reported be-
conceptualization, investigation, data curation, and written the orig-
fore. However, no attempt was made to link the simultaneous inal draft. GG contributed with investigation, software coding, data
observation of the Es layer and meteor influx in detail. curation and with review and editing of the manuscript. AA par-
Our 1-year observations clearly show that the Es layer in- ticipated in software coding and with review and editing of the
tensity is not dependent on the presence of meteor flux since manuscript. ME Sharif helped perform data simulation and with
the meteor count trend, which peaks in winter and declines review and editing of the manuscript. IF reviewed and edited the
in summer, is found to be uncorrelated with the trend ob- manuscript.
served for Es layer intensity (see Figs. 4 and 5). This may
have happened because plasma density abnormalities may
exist which may cause ionograms to record scatter echoes Competing interests. The authors declare that they have no conflict
beyond the foEs. The abnormalities are caused by plasma in- of interest.
stabilities due to the various electrodynamic processes in the
ionosphere. Meteoric activity may provide metallic ions to
Ann. Geophys., 39, 471–478, 2021 https://doi.org/10.5194/angeo-39-471-2021M. M. Shaikh et al.: Sporadic-E and meteor flux 477
Acknowledgements. The authors are grateful to the two anonymous Kotadia, K. M., and Jani, K. G.: Sporadic-E ionization and
reviewers for their valuable comments which helped improve the anomalous increase in the rate of radar meteor counts
quality of the paper. during 1963, J. Atmos. Sol.-Terr. Phy., 29, 221–223.
https://doi.org/10.1016/0021-9169(67)90137-7, 1967.
Kozlowski, S. K., Pawłaszek, R. K., Olech, A., Raj, A., Zoładek,
Review statement. This paper was edited by Ana G. Elias and re- P., Litwicki, M., Sybilski, P., Drzał, M., Hus, S., Słonina, M.,
viewed by two anonymous referees. Flohrer, T., and Funke, Q.: Omnisky: wide angle multi-camera
station network concept for re-entry detection, Proc. 1st NEO and
Debris Detection Conference, Darmstadt, Germany, 22–24 Jan-
uary 2019, published by the ESA Space Safety Programme Of-
fice, available at: http://neo-sst-conference.sdo.esoc.esa.int, last
References access: January 2019.
Kronk, G. W.: Meteor Showers: an Annotated Catalog,
Baggaley, W. J. and Steel, D. I.: The seasonal structure of ionosonde The Patrick Moore Practical Astronomy Series (2 Edn.),
Es parameters and meteoroid deposition rates, Planet. Space Sci., https://doi.org/10.1007/978-1-4614-7897-3, ISBN 978-
32, 1533–1539, https://doi.org/10.1016/0032-0633(84)90021-7, 1461478966, Springer, 2014.
1984. SWI Lab: Es and Meteor Counts near Arabian Peninsula, available
Brown, P., Stober, G., Schult, C., Krzeminski, Z., Cooke, at: https://dataverse.harvard.edu/dataset.xhtml?persistentId=doi:
W., and Chau, J. L.: Simultaneous optical and meteor 10.7910/DVN/U2UNWE (last access: 2 November 2020), Har-
head echo measurements using the Middle Atmosphere vard Dataverse, V1, 2020.
Alomar Radar System (MAARSY): Data collection and Lima, L. M., Araújo, L. R., Alves, E. O., Batista, P. P., and
preliminary analysis, Planet. Space Sci., 141, 25–34, Clemesha, B. R.: Variations in meteor heights at 22.7◦ S dur-
https://doi.org/10.1016/j.pss.2017.04.013, 2017. ing solar cycle 23, J. Atmos. Sol.-Terr. Phy., 133, 139–144,
Ceplecha, Z., Borovicka, J., Elford, W. G., ReVelle, D. https://doi.org/10.1016/j.jastp.2015.08.015, 2015.
O., Hawkes, R. L., Porubcan, V., and Šimek, M.: Me- Pancheva, D., Haldoupis, C., Meek, C. E., Manson, A. H., and
teor phenomena and bodies, Space Sci. Rev., 84, 327–471, Mitchell, N. J.: Evidence of a role for modulated atmospheric
https://doi.org/10.1023/A:1005069928850, 1998. tides in the dependence of sporadic E on planetary waves, J. Geo-
Chandra, H., Sharma, S., Devasia, C. V., Subbarao, K. S. V., Srid- phys. Res., 108, 1176, https://doi.org/10.1029/2002JA009788,
haran, R., Sastri, J. H., and Rao, J. V. S. V.: Sporadic-E associ- 2003.
ated with the Leonid meteor shower event of November 1998 Plane, J. M. C., Feng, W., and Dawkins, E. C. M. D.: The meso-
over low and equatorial latitudes, Ann. Geophys., 19, 59–69, sphere and metals: Chemistry and changes, Chem. Rev., 115,
https://doi.org/10.5194/angeo-19-59-2001, 2001. 4497–4541, https://doi.org/10.1021/cr500501m, 2015.
Collins, P. C.: Flashes in the Sky: The Origins of Mete- Shaikh, M. M., Fernini, I., Gopakumar, G., and Alameri, N. M.:
ors. ThoughtCo, Aug. 27, 2020, avaialable at: https://www. Occurrence of pre-sunset L-band scintillation due to strong pres-
thoughtco.com/origins-of-meteors-4148114, last access: 13 Oc- ence of sporadic-E over Arabian Peninsula, Adv. Space Res., 65,
tober 2020. 2412–2423, https://doi.org/10.1016/j.asr.2020.02.011, 2020a.
Ellyet, C. D. and Goldsborough, P. F.: Relationship of meteors to Shaikh, M. M., Gopakumar, G., Hussein, A., Kashcheyev, A., and
sporadic-E 1, A sorting of facts, J. Geophys. Res., 81, 6131– Fernini, I.: Daytime GNSS scintillation due to Es over Ara-
6134, https://doi.org/10.1029/JA081i034p06131, 1976. bian Peninsula during low solar activity, Results in Physics, 20,
Feng, W., Marsh, D. R., Chipperfield, M. P., Janches, D., Höffner, 103761, https://doi.org/10.1016/j.rinp.2020.103761, 2020b.
J., Yi, F., and Plane, J. M. C.: A global atmospheric model Shalimov, S., Haldoupis, C., Voiculescu, M., and Schlegel, K.: Mid-
of meteoric iron, J. Geophys. Res.-Atmos., 118, 9456–9474, latitude E region plasma accumulation driven by planetary wave
https://doi.org/10.1002/jgrd.50708, 2013. horizontal wind shears, J. Geophys. Res., 104, 28207–28213,
Fernini, I., Al-Naimiy, H., Talafha, M., Jami, I. A., Al-Owais, 1999.
A., Fernini, R., Ahmad, A., Sharif, M., Al-Naser, M., Eisa, Y., Simon, A.: Instability of a Partially Ionized Plasma in Crossed
Zarafshan, S., Subhi, S., Adwan, A., and Al-Ahbabi, M.: The Electric and Magnetic Fields, Physics of Fluids, 6, 382,
UAE Meteor Monitoring Network, J. Instrument., 15, T06007, https://doi.org/10.1063/1.1706743, 1963.
https://doi.org/10.1088/1748-0221/15/06/t06007, 2020. Singer, W., von Zahn, U., and Weiß, J.: Diurnal and annual varia-
Haldoupis, C., Pancheva, D., Singer, W., Meek, C., and Mac- tions of meteor rates at the arctic circle, Atmos. Chem. Phys., 4,
Dougall, J.: An explanation for the seasonal dependence of mid- 1355–1363, https://doi.org/10.5194/acp-4-1355-2004, 2004.
latitude sporadic E layers, J. Geophys. Res.-Space, 112, A06315, SonotaCo.: UFOCaptureV2 Users Manual, Retrieved from avail-
https://doi.org/10.1029/2007JA012322, 2007. able at: https://sonotaco.com/soft/UFO2/help/english/index.html
Jacobi, C., Achminder, R., and Kürschhner, D.: Planetary (last access: 16 September 2020), 2005.
wave activity obtained from long-period (2–18 days) SonotaCo.: UFOAnalyzer V2 Users Manual, Retrieved from
variations of mesopause region winds over central Eu- available at: https://sonotaco.com/soft/download/UA2Manual_
rope (52◦ N, 15◦ E), J. Atmos. Sol.-Terr. Phy., 60, 81–93, EN.pdf (last access: 16 September 2020), 2007a.
https://doi.org/10.1016/S1364-6826(97)00117-X, 2018. SonotaCo.: UFOOrbit V2 Users Manual, Retrieved from available
Kopp, E.: On the abundance of metal ions in the lower at: https://sonotaco.com/soft/UO2/UO21Manual_EN.pdf (last
ionosphere, J. Geophys. Res.-Space, 102, 9667–9674, access: 16 September 2020), 2007b.
https://doi.org/10.1029/97JA00384, 1997.
https://doi.org/10.5194/angeo-39-471-2021 Ann. Geophys., 39, 471–478, 2021478 M. M. Shaikh et al.: Sporadic-E and meteor flux
Stober, G., and Chau, J. L. A multistatic and multifrequency Yi, W., Xue, X., Chen, J., Dou, X., Chen, T., and Li, N.:
novel approach for specular meteor radars to improve wind Estimation of mesopause temperatures at low latitudes us-
measurements in the MLT region, Radio Sci., 50, 431–442, ing the Kunming meteor radar, Radio Sci., 51, 130–141,
https://doi.org/10.1002/2014RS005591, 2015. https://doi.org/10.1002/2015RS005722, 2016.
Tsuda, T., Sato, T., and Matsushita, S.: Ionospheric irregularities Younger, P. T., Astin, I., Sandford, D. J., and Mitchell, N.
and the cross-field plasma instability, J. Geophys. Res., 74, 2923– J.: The sporadic radiant and distribution of meteors in the
2932, https://doi.org/10.1029/ja074i011p02923, 1969. atmosphere as observed by VHF radar at Arctic, Antarc-
Vitek, S. and Nasyrova, M.: Real-Time Detection of Sporadic Me- tic and equatorial latitudes, Ann. Geophys., 27, 2831–2841,
teors in the Intensified TV Imaging Systems, Sensors, 18, 77, https://doi.org/10.5194/angeo-27-2831-2009, 2009.
https://doi.org/10.3390/s18010077, 2018. Yu, B., Xue, X., Lu, G., Ma, M., Dou, X., Qie, X., Ning, B., Hu, L.,
Whitehead, J. D.: Recent work on midlatitude and equa- Wu, J., and Chi, Y.: Evidence for lightning-associated enhance-
torial sporadic E. J. Atmos. Terr. Phys., 51, 401, ment of the ionospheric sporadic-E layer dependent on light-
https://doi.org/10.1016/0021-9169(89)90122-0, 1989. ning stroke energy, J. Geophys. Res.-Space, 120, 9202–9212,
https://doi.org/10.1002/2015JA021575, 2015.
Ann. Geophys., 39, 471–478, 2021 https://doi.org/10.5194/angeo-39-471-2021You can also read