PH-depended protein shell dis- and reassembly of ferritin nanoparticles revealed by atomic force microscopy - TUprints
←
→
Page content transcription
If your browser does not render page correctly, please read the page content below
www.nature.com/scientificreports

            OPEN           pH-depended protein shell dis- and
                           reassembly of ferritin nanoparticles
                           revealed by atomic force
                           microscopy
                           Lukas Stühn1,2, Julia Auernhammer1,2 & Christian Dietz1

                           Ferritin, a protein that is present in the human body for a controlled iron storage and release, consists
                           of a ferrihydrite core and a protein shell. Apoferritin, the empty shell of ferritin, can be modified to carry
                           tailored properties exploitable for targeted and direct drug delivery. This protein shell has the ability to
                           dis- and reassemble depending on the pH value of the liquid environment and can thus be filled with the
                           desired substance. Here we observed the dis- and reassembly process of the protein shell of ferritin and
                           apoferritin in situ and in real space using atomic force microscopy. Ferritin and apoferritin nanoparticles
                           adsorbed on a mica substrate exhibited a change in their size by varying the pH value of the surrounding
                           medium. Lowering the pH value of the solution led to a decrease in size of the nanoparticles whereas
                           a successive increase of the pH value increased the particle size again. The pH dependent change
                           in size could be related to the dis- and reassembling of the protein shell of ferritin and apoferritin.
                           Supplementary imaging by bimodal magnetic force microscopy of ferritin molecules accomplished in air
                           revealed a polygonal shape of the core and a three-fold symmetry of the protein shell providing valuable
                           information about the substructure of the nanoparticles.

                           Ferritin is an iron-storage core-shell-protein present in almost all living organisms. Ferritin has an outer diam-
                           eter of approximately 12 nm containing iron in the form of ferrihydrite in its approximately 8 nm large core. In
                           the body of animals, ferritin is utilized to store, transport and release iron in a controlled manner for the oxy-
                           gen transport, indispensable to life, and can be exploited for different medical1,2 and electronic applications3.
                           Depending on the environment and the ferritin subtype, ferritin features a high thermal stability up to 77 °C4.
                           As other proteins5, apoferritin, the empty protein shell of ferritin, can be used to transport various substances,
                           such as drugs for medical applications6–8. The empty shell of ferritin can be used as a platform for the synthesis
                           of nanoscale materials9. This protein shell is known to dis- and reassemble depending on the pH value of the sur-
                           rounding medium10: the protein shell is stable in acidic environments down to pH values of 3.4, whereas the core
                           is stable down to pH 2.111. Below pH 3, the protein shell starts to disassemble. However, this process is reversible
                           by the subsequent increase to higher pH values turning apoferritin to an almost ideal candidate as carrier for drug
                           delivery, i.e. loading with a substance and subsequently release it. This loading occurs in a random fashion: the
                           substance to be enclosed inside the protein shell is step-wise surrounded by the reassembling shell. It is possible to
                           adsorb ferritin onto a substrate12 to study dis- and reassembling of the protein shell using sedimentation-velocity
                           measurements10 and small angle x-ray scattering11,13. However, these studies do not provide a direct observation
                           of the dis- and reassembling process and hence direct evidence, instead the conclusions had to be drawn based on
                           subsequent transformation of the data. In particular for scattering methods, the observed data reflects the protein
                           state in the reciprocal space and must be subsequently transferred to real space by means of simulations based on
                           specific assumptions. Here, we report on the direct in situ observation of the pH dependent dis- and reassembly
                           process of ferritin and apoferritin nanoparticles using atomic force microscopy (AFM) based on images that pro-
                           vide the size of individual particles in real space in liquid solutions of various pH values. Additionally, we examine
                           the electrosteric interactions between the tip of an AFM cantilever, the ferritin nanoparticle and the substrate at
                           different pH-values to validate the size interpretation of the molecules. Exploiting the coexistence of mechanical

                           1
                            Physics of Surfaces, Institute of Materials Science, Technische Universität Darmstadt, Alarich-Weiss-Str. 2, 64287,
                           Darmstadt, Germany. 2These authors contributed equally: Lukas Stühn and Julia Auernhammer *email: dietz@pos.
                           tu-darmstadt.de

Scientific Reports |   (2019) 9:17755 | https://doi.org/10.1038/s41598-019-53943-3                                                             1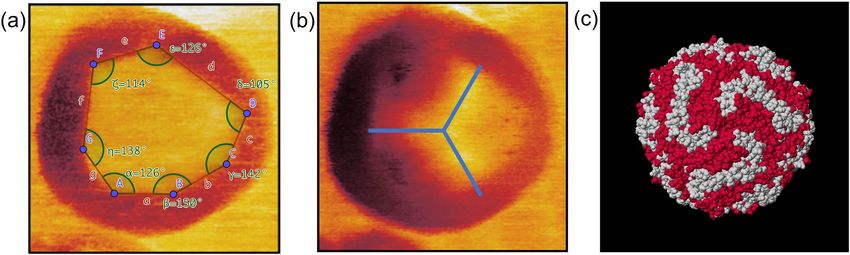
www.nature.com/scientificreports/                                                                www.nature.com/scientificreports

                           Figure 1. Surface charges of SiO2, mica and apoferritin nanoparticles at different pH values. (a) Net charge of
                           the different surfaces. (b) Electrostatic interactions between an AFM tip, apoferritin and a SiO2 substrate or (c)
                           muscovite mica in solutions of different pH values (pH 2, 4, 6 and 9), respectively.

                           tip-shell forces and the magnetic tip-core interactions with bimodal magnetic force microscopy14–16 allowed us to
                           resolve substructures of the molecules, such as the three-fold symmetry of the protein shell and a polygonal shape
                           of the core indicating its crystalline condensed state.

                           Results
                           Electrosteric interactions.           The isoelectric point is the pH value of a liquid solution, at which the surface of
                           an immersed material or molecule does not carry an electrical net charge. For proteins, this is also the pH value
                           for best solubility. In Fig. 1a the sign of the surface net charge of silicon dioxide17, muscovite mica18 and apoferri-
                           tin19 depending on the pH-value of the medium is depicted. The resulting charge interactions between the AFM
                           tip, nanoparticle and SiO2 or mica for solutions in different pH-values are summarized in Fig. 1b,c, respectively.
                               As can be deduced from Fig. 1 attractive forces between the ferritin protein shell and the silicon substrate are
                           only present in solution with pH values between approximately 2.5–4.8. For a mica substrate, attractive forces
                           between ferritin nanoparticles and the substrate are also present for more acidic solutions. It can be concluded
                           that a movement of the ferritin particles on a mica substrate by moderate tip-ferritin interactions is strongly
                           inhibited in the above-mentioned pH ranges. The forces involved in the tip-ferritin interactions are net repulsive
                           at pH values above 4.8 and below 2.5 and net attractive between 2.5 < pH < 4.8. The attractive interaction between
                           the tip and the protein shell causes the z-piezo to move downward while scanning across an (apo)ferritin mol-
                           ecule whereas the actual size of the molecule forces the z-piezo to move up simply because of the topographical
                           feedback that keeps the applied setpoint force constant. Thus, it is reasonable to believe that the height and hence
                           the size of the ferritin nanoparticles at pH values in the range of 2.5 < pH < 4.8 is slightly underestimated by the
                           apparent topography. If we detect a decrease in particle size in this range while lowering the pH value, then this
                           decrease is an upper limit and might be even stronger in reality, compared to height changing values measured at
                           pH < 2.5 or > 4.8 caused by the variation of the electrostatic interactions. This effect has to be taken into account
                           when evaluating the development of the size of nanoparticles when changing the pH value of the solution.

                           Dis- and reassembling of ferritin nanoparticles. Figure 2 shows a series of topography images taken at
                           the same spot of a mica substrate covered with ferritin nanoparticles. During the image acquisition, the pH value
                           was varied in the following order: pH 6 (a), pH 2 (b), pH 4 (c), pH 6 (d), pH 8 (e), pH 2 (f), pH 4 (g), pH 6 (h).
                           After each image acquisition, the adjusted pH value within the fluid cell was confirmed at the outlet of the cell and
                           a new measurement at the next pH value was accomplished.
                               In Figure 2 a homogenous distribution of ferritin nanoparticles is apparent at the surface of the substrate.
                           Individual particles could be identified, however their distribution in size was found to be polydisperse and the
                           particles appeared slightly inhomogeneous in their shapes. In addition, laterally small and low objects in height
                           assumed to be fragments of the protein shell were already found in the initial solution at rare locations. Particles
                           that disappeared in the next step are enclosed by squares. We interpret the disappearance as complete dissem-
                           bling of the protein shell accompanied by a release of the ferrihydrite core. Circles mark particles that are present
                           throughout the entire measurement, yet varying in size (see number given above the particles in Fig. 2). Arrows
                           indicate particles that were not apparent in the previous pH step and started to assemble. The maximum size of
                           the particles changed during the course of the measurement series. The initial change from pH 6 (Fig. 2a) to pH
                           2 (Fig. 2b) caused a decrease in size of all nanoparticles marked with circles. The topmost particle among them
                           changed its height from 9 nm to 6 nm, corresponding to the size of the ferrihydrite core. The particles marked

Scientific Reports |   (2019) 9:17755 | https://doi.org/10.1038/s41598-019-53943-3                                                                2
www.nature.com/scientificreports/                                                              www.nature.com/scientificreports

                           Figure 2. AFM topography images of ferritin nanoparticles adsorbed on a mica substrate measured in
                           deionized water with adjusted pH value in the following order: (a) pH 6 (b) pH 2 (c) pH 4 (d) pH 6 (e) pH
                           8 (f) pH 2 (g) pH 4 (h) pH 6. Particles that vanished in the next step are enclosed by a square. Particles that
                           assembled and did not exist in the previous step are marked by an arrow. Particles present through the whole
                           experiment but vary in size are marked with a circle. Their sizes in nm are designated by numbers. Scale bar is
                           100 nm.

                           with the squares are no longer visible in Fig. 2b. In the further course of the experiment when the pH value was
                           step-by-step increased until pH 8 was adjusted (Fig. 2e), the size of the particles marked with the circles increased
                           again, however they did not reach the initial value exactly, as measured in Fig. 2a. During the change of the pH

Scientific Reports |   (2019) 9:17755 | https://doi.org/10.1038/s41598-019-53943-3                                                            3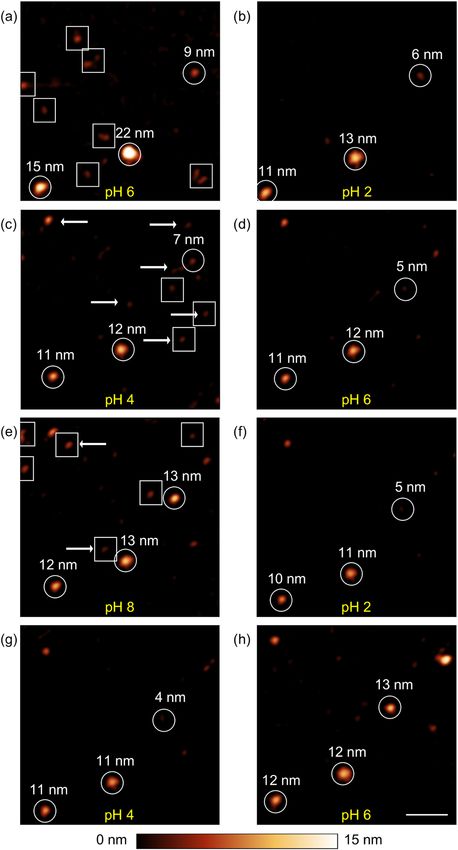
www.nature.com/scientificreports/                                                               www.nature.com/scientificreports

                           Figure 3. AFM topography images of apoferritin nanoparticles adsorbed on a mica substrate in solutions of
                           different pH values: (a) pH 6 (b) pH 2 (c) pH 3 (d) pH 4 (e) pH 6. Scale bar is 100 nm. (f) Development of the
                           average height (crosses) of the apoferritin nanoparticles adsorbed on a mica substrate in solution at different pH
                           values analysed from the topography data. Error bars correspond to the standard deviation. Histograms show
                           the height deviation at each pH value step.

                           value from pH 2 (Fig. 2b) to pH 8 (Fig. 2e), several new particles have formed as indicated by arrows. Similar
                           phenomena were approved during a repeated pH change from pH 2 (Fig. 2e) to pH 6 (Fig. 2h). Summarizing the
                           observations of the experiment: Decreasing the pH value of the solution causes a shrinkage of the nanoparticles
                           in size whereas the subsequent increase of the pH value of the solution results in a growth of the particles and the
                           formation of new particles.

                           Dis- and reassembling of apoferritin nanoparticles. To study the pH dependent size behaviour of
                           apoferritin nanoparticles, topographical analysis by AFM in solutions of different pH values was performed in
                           the same manner as for ferritin described in the previous section. The Apoferritin nanoparticles show a higher
                           density on the substrate and a higher initial height deviation, than compared to the ferritin samples. The pH value
                           of the solution was adjusted in the following order: pH 6, pH 2, pH 3, pH 4 und pH 6. Figure 3 shows the corre-
                           sponding topography images of the measurement series. In contrast to the series accomplished on ferritin, the
                           apoferritin sample exhibited a higher particle density on the surface for the prepared samples. The pattern of the
                           nanoparticles and hence the particle distribution on the substrate partially changed with every step of varying pH
                           value. This becomes particularly evident when the pH value of the solution was changed from pH 2 (Fig. 3b) to
                           pH 3 (Fig. 3c). In addition to the increased number of nanoparticles on the surface compared to the experiment
                           performed on the ferritin sample, the rearrangement of the particles was another reason why a statistical evalu-
                           ation was preferred in that case. Hence, it was difficult to follow the presence of a particular nanoparticle during
                           the course of the experiment.
                               A general change in size of the apoferritin nanoparticles by reducing the pH value is clearly apparent when
                           comparing Fig. 3a,b: All apoferritin nanoparticles present exhibited a smaller size in topography in Fig. 3b com-
                           pared to Fig. 3a, derivable from the generally darker colour value of the particles at the lower pH value. In the sub-
                           sequent increase of the pH value from pH 3 to pH 6 (Fig. 3c–e), the initial size of the nanoparticles was restored.
                           A statistical analysis of the size distribution of apoferritin at the different pH values based on the topography data
                           is shown as histograms in Fig. 3f.
                               As for ferritin nanoparticles, it can be deduced that with decreasing pH value, the average height of the nano-
                           particles decreases, from approximately 11 nm at the first step of the measurement (pH 6) to approximately 8 nm
                           in the second step (pH 2). The standard deviations of the size distribution displayed in Fig. 3f decreased too, from
                           10 nm at pH 6, to 7 nm at pH 2. The subsequent increase to pH 3 caused nearly no increase of the average height
                           but an increase of the standard deviation from 4 nm to 8 nm. Further increase of the pH value led to an increase of
                           the apoferritin nanoparticles in size to a value of 10 nm and standard deviation back to the initial values found at
                           the beginning of the experiment at pH 6. We interpret the pH dependent decrease and increase of the ferritin and
                           apoferritin molecules in size as pH-triggered dis- and resembling process of the protein shell.

                           High resolution bimodal magnetic AFM measurements of ferritin. As demonstrated in the previous
                           section, the pH dependent dis- and reassembling of ferritin and apoferritin particles can be directly visualized

Scientific Reports |   (2019) 9:17755 | https://doi.org/10.1038/s41598-019-53943-3                                                             4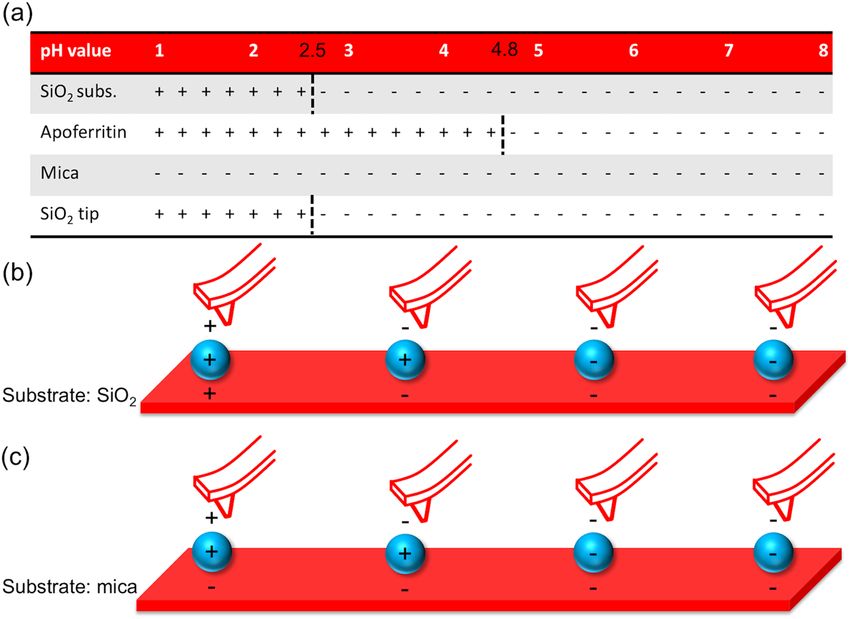
www.nature.com/scientificreports/ www.nature.com/scientificreports
Figure 4. High-resolution bimodal MFM image of a single ferritin nanoparticle on a silicon substrate
performed in air. (a) first and (b) second eigenmode amplitude, as well as (c) first and (d) second eigenmode
phase images. Scale bar is 10 nm. (e) 3d topography with color-coded first eigenmode phase, (f) 3d topography
with color-coded second eigenmode phase.
using atomic force microscopy. First high resolution studies on the protein shell of ferritin were performed by
Ohnishi using contact mode AFM20. However, the core and shell substructure of ferritin molecules could not be
resolved by this technique. In the following we show that by using bimodal magnetic force microscopy15,16, we can
separate magnetic from mechanical cantilever responses of the mixed tip-sample interactions. This allowed us to
image substructure features of the shell and the core of a single ferritin nanoparticle in great detail.
Figure 4 shows the five available observables of the bimodal MFM measurement, i.e. first (a) and sec-
ond (b) eigenmode amplitude images as well as the first (c) and second (d) eigenmode phase images and a
three-dimensional representation of the topography rendered by the colour code of the first and second eigen-
mode phase (Fig. 4e,f). Because of the use of a magnetic cantilever with a platinum/iridium coated tip exhibiting
a larger tip radius as compared to standard cantilevers, the resulting diameter of the nanoparticle of almost 50 nm
is significantly larger than its real diameter. The cores of the ferritin particles are superparamagnetic and can be
polarized by the presence of an external magnetic field and/or the field originated by the oscillating magnetic
tip. In the first eigenmode amplitude (Fig. 4a) and phase (Fig. 4c) images a ring around a centre area of constant
amplitude and phase value, respectively, is apparent. In particular in the phase image of the first eigenmode it is
obvious that this centre area is separated from the outer ring through linear edges intersecting each other by vari-
ous angles forming a polygonal structure. Both second eigenmode observables (amplitude Fig. 4b, phase Fig. 4d)
show a threefold symmetry in the centre area of the nanoparticle.
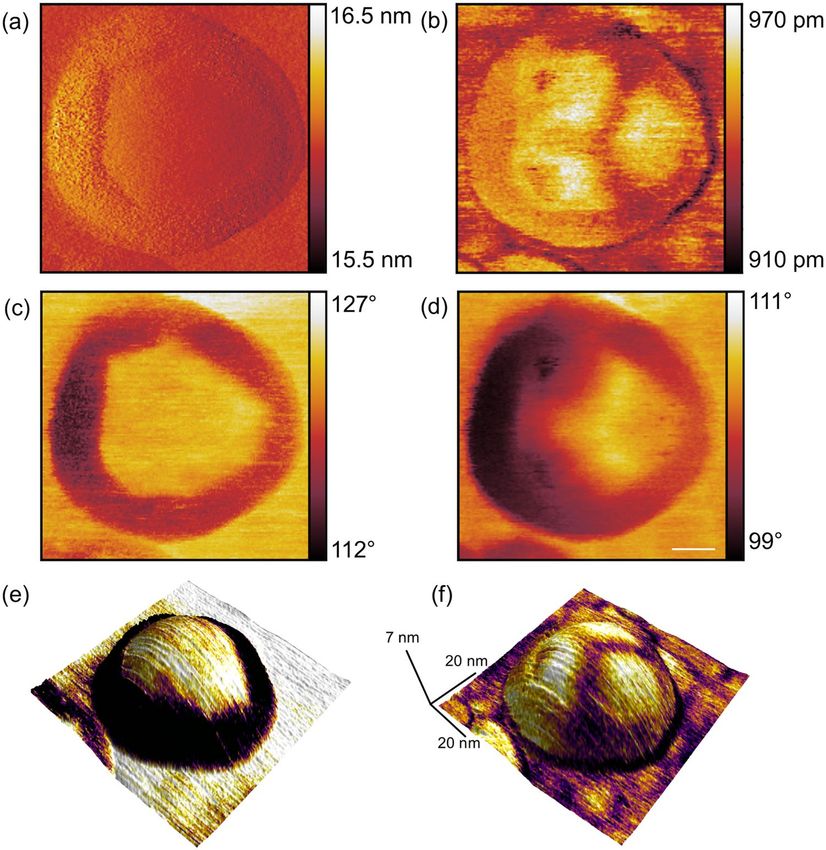
Further analysis of the polygonal structure is shown in Fig. 5a. The angles between the intersecting lines were
measured to be α = 126°,β = 150°, γ = 142°, δ = 105°, ε = 126°, ζ = 114° and η = 138°. Based on the variation of
existing angles we conclude that the ferrihydrite core condenses in a complex morphologic state. The core can
consist of different iron oxide phases (ferrihydrite, hematite, magnetite)21, which presents itself in our study as a
(common) polygonal geometric structure. The analysis of the symmetry visible in the second eigenmode ampli-
tude image was conducted in Fig. 5b. The bimodal excitation of the cantilever and the observation of the ampli-
tude and phase shifts of the first two flexural eigenmodes in a single-pass technique allows for the simultaneous
Scientific Reports | (2019) 9:17755 | https://doi.org/10.1038/s41598-019-53943-3 5www.nature.com/scientificreports/ www.nature.com/scientificreports
Figure 5. Analysis of the substructure features visible by bimodal MFM. (a) High-resolution first eigenmode
phase image of a single ferritin nanoparticle on a silicon substrate performed in air. The separation lines
between the outer ring and the inner central area as well as the corresponding angles at the intersections are
highlighted. (b) Second eigenmode amplitude image exhibiting a threefold symmetry in the inner centre area.
(c) Three-dimensional crystal structure of ferritin showing a threefold symmetry, calculated and created with
Jmol32 (Jmol: an open-source Java viewer for chemical structures in 3D. http://www.jmol.org/, version 14) using
data provided in refs. 22,23.
detection of mechanical and magnetic tip sample interactions at the nanometre scale20. By the choice of the
experimental parameters (oscillation amplitudes A1, A2, amplitude ratio A1/A2, setpoint amplitude Asp/A1) it is
determined whether the first or the second eigenmode channels are mainly dominated by magnetic or mechan-
ical forces. Hence, the polygonal structure visible in Fig. 5a and the threefold symmetry in Fig. 5b is the result
of a magnetomechanical contrast. This measured symmetry is in good agreement with the calculated structure
visible in Fig. 5c. Figure 5c shows the symmetry of the protein shell of ferritin, calculated from X-ray data22,23. A
threefold symmetry of the protein shell exposed to the topside, i.e. opposite to the substrate, is clearly visible in
the image taken by MFM (Fig. 5b). Such symmetries arise at channels that form the protein shell24,25 based on
the alignment of the protein molecules around the shell. In this study, we chose a relatively large first eigenmode
amplitude enabling the first mode to be sensitive to magnetic interactions caused by the magnetic coating of the
tip and the ferrihydrite core and a relatively high second eigenmode amplitude (compared to ref. 20) amplifying
the mechanical contrast between the tip and the ferritin shell. For the measurement parameters used in this study
such as free amplitude of the first eigenmode (A1 = 23 nm) and relative setpoint (ASP = 16 nm) as well as the rela-
tively large free amplitude of the second eigenmode (A2 = 16 nm) the observables of the first eigenmode are more
prone for magnetic forces and the observables of the second mode are dominated by mechanical forces, which
is in contrast to previous studies19,20 where substantially different parameters were applied, in particular a small
second eigenmode amplitude. Thus, the first eigenmode (Figs. 4a,c and 5a) reveals the magnetic image of the
particles generated by the ferritin core, the second eigenmode (Figs. 4b,d and 5b) the mechanical contrast given
by the structure of the protein shell. A detailed study of the origin of the magnetomechanical contrast, however, is
beyond the scope of this paper. Strikingly, as a result of this combination, a three-fold symmetry on the shell and
the polycrystalline state of the core of this biomolecule became apparent in a single measurement.
Conclusions
In conclusion, the pH dependent dis- and reassembly process of ferritin and apoferritin proteins can be directly
visualized and studied in detail by an in situ experiment performed in an electrochemical cell of an atomic force
microscope. The more acidic the environment of the molecules became, the lower was their measured size on
average. The height of the molecules increased again when changing the solution to a neutral or basic milieu. A
consideration of the surface charges of the AFM tip, protein shell and substrates allowed us to exclude artefacts
in the observed trends arising from different electrostatic interactions. However, the attractive interaction in
the range 2.5 < pH < 4.8 between tip and protein shell led to a generally reduced apparent height of ferritin and
apoferritin molecules deduced from the topography images due to feedback restrictions. Thus, it is reasonable to
believe that the real size of the molecules is slightly larger in that range. Strikingly, we observed an emergence/
appearance of protein clusters at locations where no particle was present before. As the pH value was increased,
new (apo)ferritin particles formed most likely developing from surrounding protein fragments, which remained
in the liquid from previously disassembled protein shells. Due to the lack of a constant liquid flow in the electro-
chemistry cell, there is no reason to assume that the dissembled protein shell fragments were flushed away from
the vicinity of the sample surface. Several authors11,26 assume that the higher-order structure of the protein shell
is disassembled upon pH value decrease of the environment of the particles. However, the individual protein
chains should remain intact. In the current study, conclusions about the structure of individual proteins cannot
be drawn. Using atomic force microscopic measurements and further improving the resolution, it might pave the
way to visualise the behaviour of individual proteins during the formation and degradation of the protein shell.
The bimodal excitation of a magnetic cantilever allowed us to simultaneously map the shape of a ferritin mole-
cule, its mechanical as well as magnetic properties. In our experiments, these two properties could be clearly sepa-
rated in the amplitude and phase channels of the different eigenmodes. The results suggest that the contrast found
in the phase image of the first eigenmode mainly results from the magnetic interactions between the ferrihydrite
Scientific Reports | (2019) 9:17755 | https://doi.org/10.1038/s41598-019-53943-3 6www.nature.com/scientificreports/ www.nature.com/scientificreports
core of the ferritin particle and the tip providing a defined polygonal structure as a result of the polycrystalline
condensed state. Additionally, the contrast in the amplitude image deduced from the second eigenmode revealed
a three-fold symmetry in the center of the ferritin nanoparticle arising from the mechanical interaction of the tip
with the shell. This symmetry is in very good agreement with the calculated ferritin structure22 and the appear-
ance demonstrates that the protein capsule was mainly intact.
In future, bimodal magnetic force microscopy in combination with a liquid environment of changeable pH
value would allow for the observation of the dis- and reassembling process in great structural detail due to the
simultaneous interplay of magnetic and mechanical forces between tip and sample. The methodology could open
up new pathways to study drug release for targeted drug delivery in cancer research. However, magnetic force
microscopy performed in liquids20,27 has been a great challenge so far due to the low-Q environment and unstable
magnetic coatings, in particular on tiny magnetic structures such as present on nanoparticles.
Experimental Section
Sample preparation. To prepare ferritin samples, a two-step dilution of the stock solution was conducted.
10 µL of the purchased ferritin solution (10 mg/mL in 0.15 M NaCl) cationized from horse spleen (MFCD00081593,
Merck KGaA, Darmstadt, Germany) were diluted into 1 mL deionized water (Milli-Q, Merck KGaA, Darmstadt,
Germany) and homogenized for 5 min at 800 rpm at 22 °C (ThermoMixer, Eppendorf, Wessling-Berzdorf,
Germany). 10 µL of the prepared solution were again diluted into 1 mL deionized water and homogenized repeat-
ing the procedure. 200 µL of the final solution were drop casted onto a freshly cleaved muscovite mica (50-D-10,
NanoAndMore GmbH, Wetzlar, Germany) substrate or a 1 × 1 cm2 large piece of a Si(100) wafer (LamResearch
Corporation, Fremont, CA). Size measurements with AFM were initiated 5 minutes after the samples preparation to
provide sufficient time for the nanoparticles to settle on the substrate. For the apoferritin sample preparation, 10 µL
of the apoferritin stock solution (MFC00081365, from equine spleen, 50% glycerol + 0.075 M NaCl), purchased
from Merck KGaA as well, were drop casted onto the substrates (mica or Si(100)) and 200 µl deionized water were
dropped above for further dilution. Size measurements by AFM were initiated after 5 minutes settling time. To
observe the dis- and reassembly process of the molecules, particular attention was paid to avoid exsiccation of the
sample after preparation to keep the tertiary structure of the protein shell intact.
Size analysis by AFM. For the size analysis of the nanoparticles, PeakForce Tapping AFM measurements
were carried out in a closed, heated electrochemistry cell (DIM EC cell, 932–012–300, Bruker, Santa Barbara, CA)
mounted in an ICON AFM from the same manufacturer. Topographical images were taken using an oscillation
amplitude of 300 nm at a driving frequency of 500 Hz, far less than resonance frequency of the cantilever in the solu-
tion to avoid resonance effects. The maximum force exerted to the sample was adjusted to 500 pN. The force applied
is rather high and it can affect the analysis based on height measurements. Since the applied force was kept constant
for all images such an effect applies to the whole imaging series and there is no change for the outcome of the experi-
ment. Based on our observations we exclude particle migration or particle movement during the pH change because
no traces that are typical for particle movement28 could be observed with the low force we adjusted. A structural
change of e.g. the protein shell that would alter the observed height by changing the pH value seems unlikely to be
the major origin of the size increase/decrease because of the relatively large size change we observe. The cantilevers
used were SNL-A (Bruker AXS, Santa Barbara, CA), exhibiting a typical force constant of 0.35 N/m as determined
by the thermal noise method29 and a nominal resonance frequency of 65 kHz in air.
Topography images were tilt and drift corrected by first order flattening. The temperature was set to 37 °C
through the electrochemistry cell. The pH value of the measurement solution was adjusted to the desired values
either by adding hydrochloric acid (Carl Roth GmbH + Co. KG, Karlsruhe, Germany) or ammonia (Carl Roth
GmbH + Co. KG, Karlsruhe, Germany) to deionized water before filling the solution into a syringe. No additional
ferritin or apoferritin nanoparticles are in the syringe-solutions. Using pre-heated (37 °C) syringes filled with
the measuring solution of different pH values and a syringe pump Aladdin-1000 (World Precision Instruments,
Sarasota, Florida), the pH value inside the electrochemistry cell was changed after each measuring step through
connection tubes attached to the inlet of the cell. The pH stability of the solution in the cell during the measure-
ment was confirmed at the outlet of the cell. The samples were kept in a liquid environment at all times. Due to the
low number of particles, the size of the ferritin could be measured by drawing a cross-sectional profile through
the particle and extracting the average height over a 3-pixel line with respect to the substrate level. The size of the
apoferritin nanoparticles was analysed by an automated particle analysis tool30. Height profiles of individual par-
ticles can be found in the supplementary material (Figs. S1 and S3) and a trend of the change in height (Fig. S2).
Substructure detection by bimodal MFM. To study the substructure of ferritin nanoparticles bimodal
force microscopy31 was combined with magnetic force microscopy in a single-pass technique. Using a mag-
netic tip, it is feasible to separate long-range magnetic from short-range mechanical tip-sample interactions in
air19 and in liquid environments20. To this end, we measured a ferritin sample in air using a Cypher S (Oxford
Instruments, Asylum Research, Santa Barbara, CA) AFM with a magnetic Multi75-G cantilever (BudgetSensors,
Sofia, Bulgaria) exhibiting a nominal force constant of 3 N/m and a nominal resonance frequency of 75 kHz of
the fundamental flexural eigenmode in air. First and second cantilever eigenmodes were simultaneously excited
by a photothermal excitation system and the respective amplitude and phase shifts of both modes were mapped.
We used a scan speed of 1 Hz, free oscillation amplitudes of A1 = 23 nm and A2 = 16 nm and a setpoint amplitude
ratio of Asp/A1 = 16 nm/23 nm = 70% to obtain images.
Received: 29 August 2019; Accepted: 7 November 2019;
Published: xx xx xxxx
Scientific Reports | (2019) 9:17755 | https://doi.org/10.1038/s41598-019-53943-3 7www.nature.com/scientificreports/ www.nature.com/scientificreports
References
1. Wilhelm, S. et al. Analysis of nanoparticle delivery to tumours. Nat Rev Mater 1, https://doi.org/10.1038/natrevmats.2016.14 (2016).
2. Peer, D. et al. Nanocarriers as an emerging platform for cancer therapy. Nat Nano 2, 751–760 (2007).
3. Jutz, G., van Rijn, P., Santos Miranda, B. & Böker, A. Ferritin: A Versatile Building Block for Bionanotechnology. Chemical Reviews
115, 1653–1701, https://doi.org/10.1021/cr400011b (2015).
4. Stefanini, S. et al. Thermal stability of horse spleen apoferritin and human recombinant H apoferritin. Archives of Biochemistry and
Biophysics 325, 58–64, https://doi.org/10.1006/abbi.1996.0007 (1996).
5. MaHam, A., Tang, Z. W., Wu, H., Wang, J. & Lin, Y. H. Protein-Based Nanomedicine Platforms for Drug Delivery. Small 5,
1706–1721, https://doi.org/10.1002/smll.200801602 (2009).
6. Truffi, M. et al. Ferritin nanocages: A biological platform for drug delivery, imaging and theranostics in cancer. Pharmacol Res 107,
57–65, https://doi.org/10.1016/j.phrs.2016.03.002 (2016).
7. Zhen, Z. P., Tang, W., Todd, T. & Xie, J. Ferritins as nanoplatforms for imaging and drug delivery. Expert Opin Drug Del 11,
1913–1922, https://doi.org/10.1517/17425247.2014.941354 (2014).
8. Bhaskar, S. & Lim, S. Engineering protein nanocages as carriers for biomedical applications. NPG Asia Mater. 9, 18, https://doi.
org/10.1038/am.2016.128 (2017).
9. Uchida, M. et al. Biological containers: Protein cages as multifunctional nanoplatforms. Advanced Materials 19, 1025–1042, https://
doi.org/10.1002/adma.200601168 (2007).
10. Crichton, R. R. & Bryce, C. F. A. Subunit Interactions in Horse Spleen Apoferritin - Dissociation by Extremes of Ph. Biochem J 133,
289–299, https://doi.org/10.1042/bj1330289 (1973).
11. Kim, M. et al. pH-dependent structures of ferritin and apoferritin in solution: disassembly and reassembly. Biomacromolecules 12,
1629–1640, https://doi.org/10.1021/bm200026v (2011).
12. Caruso, F., Furlong, D. N. & Kingshott, P. Characterization of ferritin adsorption onto gold. J Colloid Interf Sci 186, 129–140, https://
doi.org/10.1006/jcis.1996.4625 (1997).
13. Cornell, T. A., Srivastava, Y., Jauch, R., Fan, R. L. & Orner, B. P. The Crystal Structure of a Maxi/Mini-Ferritin Chimera Reveals
Guiding Principles for the Assembly of Protein Cages. Biochemistry-Us 56, 3894–3899, https://doi.org/10.1021/acs.biochem.7b00312
(2017).
14. Dufrene, Y. F. et al. Imaging modes of atomic force microscopy for application in molecular and cell biology. Nat Nano 12, 295–307,
https://doi.org/10.1038/nnano.2017.45 (2017).
15. Li, J. W., Cleveland, J. P. & Proksch, R. Bimodal magnetic force microscopy: Separation of short and long range forces. Appl. Phys.
Lett. 94, 163118, https://doi.org/10.1063/1.3126521 (2009).
16. Dietz, C., Herruzo, E. T., Lozano, J. R. & Garcia, R. Nanomechanical coupling enables detection and imaging of 5 nm
superparamagnetic particles in liquid. Nanotechnology 22, https://doi.org/10.1088/0957-4484/22/12/125708 (2011).
17. Kosmulski, M. The pH-dependent surface charging and points of zero charge V. Update. J Colloid Interf Sci 353, 1–15, https://doi.
org/10.1016/j.jcis.2010.08.023 (2011).
18. Kosmulski, M. The pH dependent surface charging and points of zero charge. VII. Update. Adv Colloid Interfac 251, 115–138,
https://doi.org/10.1016/j.cis.2017.10.005 (2018).
19. Nerurkar, A. V., Vaidya, N. R., Advani, S. H. & Gothoskar, B. P. Characterization of ferritin from spleens of patients with Hodgkin’s
disease (HD). Neoplasma 40, 31–34 (1993).
20. Ohnishi, S., Hara, M., Furuno, T., Okada, T. & Sasabe, H. Direct Visualization of Polypeptide Shell of Ferritin Molecule by Atomic-
Force Microscopy. Biophys J 65, 573–577, https://doi.org/10.1016/S0006-3495(93)81125-1 (1993).
21. Narayanan, S. et al. On the structure and chemistry of iron oxide cores in human heart and human spleen ferritins using graphene
liquid cell electron microscopy. Nanoscale 11, 16868–16878, https://doi.org/10.1039/C9NR01541H (2019).
22. Granier, T., Gallois, B., Dautant, A., DEstaintot, B. L. & Precigoux, G. Comparison of the structures of the cubic and tetragonal forms
of horse-spleen apoferritin. Acta Crystallogr D 53, 580–587, https://doi.org/10.1107/S0907444997003314 (1997).
23. Berman, H. M. et al. The Protein Data Bank. Nucleic Acids Res 28, 235–242, https://doi.org/10.1093/nar/28.1.235 (2000).
24. Harrison, P. M. & Arosio, P. The ferritins: molecular properties, iron storage function and cellular regulation. Biochim Biophys Acta
1275, 161–203, https://doi.org/10.1016/0005-2728(96)00022-9 (1996).
25. Takahashi, T. & Kuyucak, S. Functional properties of threefold and fourfold channels in ferritin deduced from electrostatic
calculations. Biophys J 84, 2256–2263, https://doi.org/10.1016/S0006-3495(03)75031-0 (2003).
26. Carmona, F. et al. Study of ferritin self-assembly and heteropolymer formation by the use of Fluorescence Resonance Energy
Transfer (FRET) technology. Biochim. Biophys. Acta-Gen. Subj. 1861, 522–532, https://doi.org/10.1016/j.bbagen.2016.12.011 (2017).
27. Ares, P., Jaafar, M., Gil, A., Gomez-Herrero, J. & Asenjo, A. Magnetic Force Microscopy in Liquids. Small 11, 4731–4736, https://doi.
org/10.1002/smll.201500874 (2015).
28. Schiwek, S., Heim, L.-O., Stark, R. W. & Dietz, C. Manipulation of polystyrene nanoparticles on a silicon wafer in the peak force
tapping mode in water: pH-dependent friction and adhesion force. J. Appl. Phys. 117, 104303, https://doi.org/10.1063/1.4914354
(2015).
29. Butt, H. J. & Jaschke, M. Calculation of Thermal Noise in Atomic-Force Microscopy. Nanotechnology 6, 1–7, https://doi.
org/10.1088/0957-4484/6/1/001 (1995).
30. Necas, D. & Klapetek, P. Gwyddion: an open-source software for SPM data analysis. Cent Eur J Phys 10, 181–188, https://doi.
org/10.2478/s11534-011-0096-2 (2012).
31. Rodriguez, T. R. & Garcia, R. Compositional mapping of surfaces in atomic force microscopy by excitation of the second normal
mode of the microcantilever. Applied Physics Letters 84, 449–451, https://doi.org/10.1063/1.1642273 (2004).
32. Jmol: an open-source Java viewer for chemical structures in 3D, http://www.jmol.org/.
Acknowledgements
The authors thank the Deutsche Forschungsgemeinschaft (Sachbeihilfe DI 2176/2-1) for financial support. We
acknowledge support by the German Research Foundation and the Open Access Publishing Fund of Technische
Universität Darmstadt.
Author contributions
J.A. performed the AFM experiments in liquids; L.S. performed the high-resolution AFM experiments; L.S.
has written the manuscript; C.D. revised the manuscript; C.D. and L.S. designed the experiments. L.S. and J.A.
contributed equally to this work.
Competing interests
The authors declare no competing interests.
Scientific Reports | (2019) 9:17755 | https://doi.org/10.1038/s41598-019-53943-3 8www.nature.com/scientificreports/ www.nature.com/scientificreports
Additional information
Supplementary information is available for this paper at https://doi.org/10.1038/s41598-019-53943-3.
Correspondence and requests for materials should be addressed to C.D.
Reprints and permissions information is available at www.nature.com/reprints.
Publisher’s note Springer Nature remains neutral with regard to jurisdictional claims in published maps and
institutional affiliations.
Open Access This article is licensed under a Creative Commons Attribution 4.0 International
License, which permits use, sharing, adaptation, distribution and reproduction in any medium or
format, as long as you give appropriate credit to the original author(s) and the source, provide a link to the Cre-
ative Commons license, and indicate if changes were made. The images or other third party material in this
article are included in the article’s Creative Commons license, unless indicated otherwise in a credit line to the
material. If material is not included in the article’s Creative Commons license and your intended use is not per-
mitted by statutory regulation or exceeds the permitted use, you will need to obtain permission directly from the
copyright holder. To view a copy of this license, visit http://creativecommons.org/licenses/by/4.0/.
© The Author(s) 2019
Scientific Reports | (2019) 9:17755 | https://doi.org/10.1038/s41598-019-53943-3 9You can also read