Disease progression modelling from preclinical Alzheimer's disease (AD) to AD dementia - Nature
←
→
Page content transcription
If your browser does not render page correctly, please read the page content below
www.nature.com/scientificreports
OPEN Disease progression modelling
from preclinical Alzheimer’s disease
(AD) to AD dementia
Soo Hyun Cho1,2,17, Sookyoung Woo3,17, Changsoo Kim4, Hee Jin Kim1,5, Hyemin Jang1,5,
Byeong C. Kim2, Si Eun Kim6, Seung Joo Kim7, Jun Pyo Kim1, Young Hee Jung8,
Samuel Lockhart9, Rik Ossenkoppele10, Susan Landau11, Duk L. Na1,5,12, Michael Weiner13,
Seonwoo Kim3* & Sang Won Seo1,5,14,15,16*
To characterize the course of Alzheimer’s disease (AD) over a longer time interval, we aimed to
construct a disease course model for the entire span of the disease using two separate cohorts
ranging from preclinical AD to AD dementia. We modelled the progression course of 436 patients
with AD continuum and investigated the effects of apolipoprotein E ε4 (APOE ε4) and sex on disease
progression. To develop a model of progression from preclinical AD to AD dementia, we estimated
Alzheimer’s Disease Assessment Scale-Cognitive Subscale 13 (ADAS-cog 13) scores. When calculated
as the median of ADAS-cog 13 scores for each cohort, the estimated time from preclinical AD to
MCI due to AD was 7.8 years and preclinical AD to AD dementia was 15.2 years. ADAS-cog 13 scores
deteriorated most rapidly in women APOE ε4 carriers and most slowly in men APOE ε4 non-carriers
(p < 0.001). Our results suggest that disease progression modelling from preclinical AD to AD dementia
may help clinicians to estimate where patients are in the disease course and provide information on
variation in the disease course by sex and APOE ε4 status.
Understanding the course of disease progression across the whole Alzheimer’s disease (AD) continuum including
preclinical AD, mild cognitive impairment (MCI) due to AD, and AD dementia will help in designing clinical
trials to test preventative interventions. Some studies have investigated the progression in preclinical AD1, MCI
due to AD2 and AD dementia3 separately. However, their mean follow-up durations of 1.4–6.2 years were too
short to understand the progression across the entire AD spectrum. Unfortunately, following a single cohort for
several decades is difficult, though not impossible (as demonstrated in the Nun S tudy4, Framingham s tudy5 etc.).
A potential approach would be to use cross-sectional and longitudinal data from many individuals across
the disease spectrum from no AD pathology to AD dementia, to estimate a single disease progression model
across. This method is advantageous, as it allows us to construct a disease course model for the whole-time span
over a longer period using multiple separate cohorts. As far as we know, no such analysis has been used to the
1
Department of Neurology, Samsung Medical Center, Sungkyunkwan University School of Medicine, 81 Irwon‑ro,
Gangnam‑gu, Seoul 06351, South Korea. 2Department of Neurology, Chonnam National University Medical
School, Chonnam National University Hospital, Gwangju, South Korea. 3Statistics and Data Center, Samsung
Medical Center, 81 Irwon‑ro, Gangnam‑gu, Seoul 06351, South Korea. 4Department of Preventive Medicine,
Yonsei University College of Medicine, Seoul, Korea. 5Neuroscience Center, Samsung Medical Center, Seoul, South
Korea. 6Department of Neurology, Inje University College of Medicine, Haeundae Paik Hospital, Busan, South
Korea. 7Department of Neurology, Gyeongsang National University School of Medicine and Gyeongsang National
University Changwon Hospital, Changwon, South Korea. 8Department of Neurology, Myoungji Hospital, Hanyang
University, Goyangsi, South Korea. 9Internal Medicine‑Gerontology and Geriatric Medicine, Wake Forest School
of Medicine, Winston‑Salem, NC, USA. 10Department of Neurology and Alzheimer Center, VU University Medical
Center, Neuroscience Campus Amsterdam, Amsterdam, The Netherlands. 11Helen Wills Neuroscience Institute,
University of California, Berkeley, CA, USA. 12Stem Cell & Regenerative Medicine Institute, Samsung Medical
Center, Seoul, South Korea. 13Center for Imaging of Neurodegenerative Diseases, University of California, San
Francisco, CA, USA. 14Department of Health Sciences and Technology, SAIHST, Sungkyunkwan University, Seoul,
South Korea. 15Samsung Alzheimer Research Center, Samsung Medical Center, Seoul, South Korea. 16Department
of Intelligent Precision Healthcare Convergence, Sungkyunkwan University School of Medicine, Suwon, South
Korea. 17These authors contributed equally: Soo Hyun Cho and Sookyoung Woo. *email: seonwoo.kim@
samsung.com; sw72.seo@samsung.com
Scientific Reports | (2021) 11:4168 | https://doi.org/10.1038/s41598-021-83585-3 1
Vol.:(0123456789)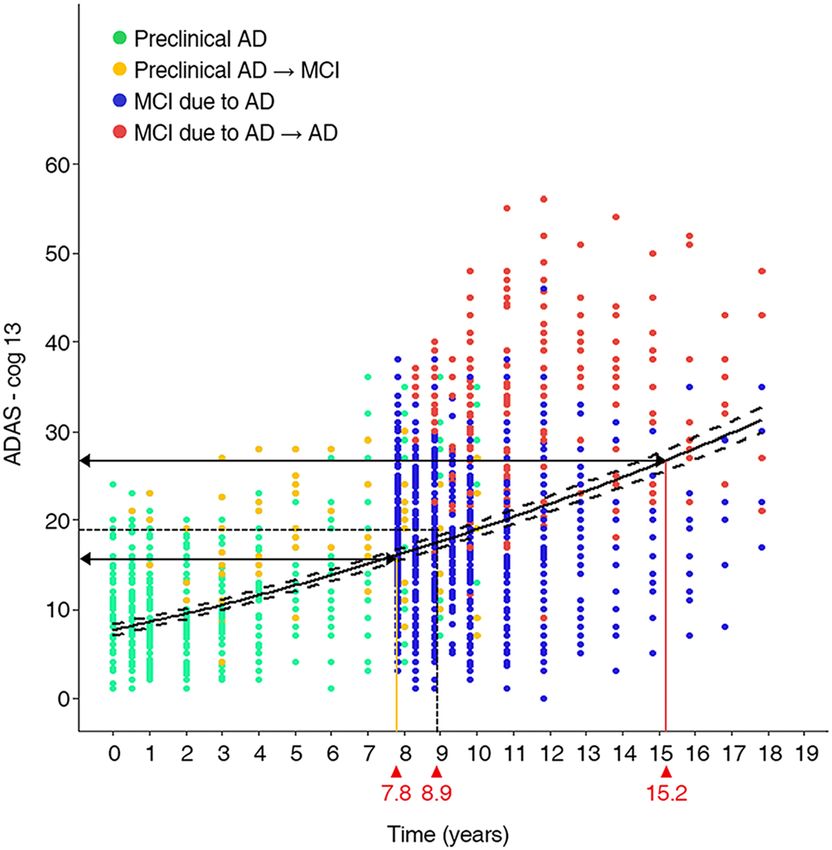
www.nature.com/scientificreports/
Figure 1. Flow diagram for selection of the study participants. We excluded the following participants: (1)
54 participants whose amyloid PET result changed from positive to negative; (2) 40 participants in whom
ADAS-cog13 scores were obtained only once; (3) 445 participants with amyloid-negative PET results, because if
amyloid-negative CN could become amyloid-positive, it would be difficult to create a disease progression model
with amyloid-negative MCI; and (4) 116 participants with dementia at baseline, because their follow-up was
short and the ADAS-cog 13 scores of AD dementia participants were in the range of the ADAS-cog 13 scores of
participants who progressed from MCI due to AD to AD dementia. ADAS-cog: Alzheimer’s Disease Assessment
Scale-cognitive subscale, CN: cognitive normal; MCI: mild cognitive impairment; AD: Alzheimer’s Disease.
study of AD progression. Successfully constructing a model of the entire AD spectrum would allow an analysis
of potential covariates that have been suggested to influence the disease process.
In the present study, we developed a model of AD progression across its entire spectrum using two separate
cohorts. To investigate whether sex and APOE ε4 influence rates of cognitive decline across the AD continuum,
we also constructed the disease models by sex and APOE ε4.
Methods
Participants. All data used in the present study were obtained from the Alzheimer’s Disease Neuroimag-
ing Initiative (ADNI) website (http://www.adni-info.org) as of May 2017. ADNI is a multisite longitudinal bio-
marker study that has enrolled cognitively normal (CN), older individuals; people with early MCI (EMCI) and
late MCI (LMCI) which are determined using the Wechsler Memory Scale Logical Memory II and people with
early AD. EMCI defined as milder episodic memory impairment than the LMCI group. The present study con-
sisted of 1091 participants enrolled in the ADNI-1, ADNI-GO and ADNI-2 cohorts who had available data for
ADAS-cog13 testing and had 18F-AV45 (Florbetapir) PET to assess amyloid-β (Aβ) deposition. According to
the National Institute on Aging-Alzheimer’s Association criteria6–8, Aβ (+) CN or subjective memory concerns
(SMC) were defined as preclinical AD and Aβ (+) EMCI or LMCI were defined as MCI due to AD. In the present
study, we included participants who were categorized as preclinical AD and MCI due to AD by their baseline
diagnosis.
We excluded the following conditions: (1) 54 participants whose amyloid PET result changes; their amyloid
PET result changed from positive to negative. (2) 40 participants in whom the ADAS-cog13 scores were obtained
only once. Therefore, all enrolled participants performed ADAS-cog 13 at least two times. (3) 445 participants
with amyloid pet negative result because amyloid negative CN could become amyloid positive then it is hard
to make disease progression model with amyloid negative MCI. (4) 116 participants with dementia at baseline
were not included because their median time of follow-up was short (12 months) and ADAS-cog 13 scores for
AD dementia participant were in the range of ADAS-cog 13 scores for participants who progressed from MCI
due to AD to AD dementia (Fig. 1)9.
All participants signed written informed consent at the time of enrolment. The authors obtained approval
from the ADNI Data Sharing and Publications Committee for data use and publication. Since all the analyses
were performed using de-identified ADNI data which is available for download, no IRB review was required.
All methods were carried out in accordance with the approved guidelines.
Neuropsychological evaluation. For neuropsychological testing, participants undergo ADAS-Cog 13
at baseline, 6, 12, and ongoing annually performed for CN, MCI participants. We used ADAS-cog 13, which
includes tests of attention and concentration, planning and executive function, verbal memory, nonverbal mem-
ory, praxis, delayed word recall, and number cancellation or maze tasks. ADAS-cog 13 scores range from 0 to
85. The ADAS-cog 13 is more responsive to disease progression than the ADAS-cog 11 in subjects with AD and
similar or slightly more responsive in subjects with pre-dementia s yndromes10,11.
Image acquisition and processing. We downloaded amyloid (florbetapir) PET data from the ADNI
website. Florbetapir imaging consisted of four 5-min frames (dynamic 3D scan) acquired 50–70 min after
injection of 370 MBq (10 mCi) of tracer; frames were realigned, averaged, resliced to a common voxel size
(1.5 mm × 1.5 mm × 1.5 mm) and smoothed to a common resolution of 8 mm3. MPRAGE images acquired
concurrently with baseline florbetapir images and used as a structural template to define cortical and reference
regions in native space for each subject with FreeSurfer. More detailed information can be found at http://www.
loni.ucla.edu. A florbetapir cortical summary measurement (SUVR) was calculated by dividing cortical uptake
Scientific Reports | (2021) 11:4168 | https://doi.org/10.1038/s41598-021-83585-3 2
Vol:.(1234567890)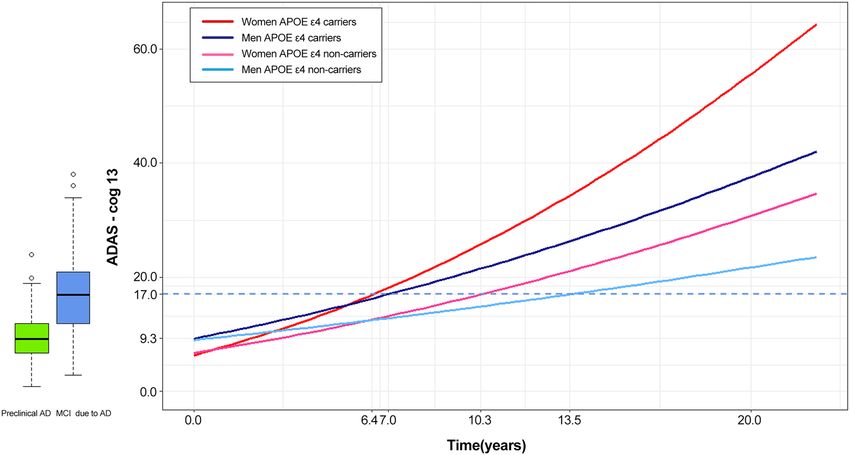
www.nature.com/scientificreports/
by a whole cerebellum as a reference region. We included only amyloid-positive individuals with an Amyloid
SUVR of 1.1112 or higher in our analysis.
APOE genotyping. APOE genotyping was performed on DNA obtained from participant blood samples
with an APOE genotyping kit as described at the ADNI site (see http://www.adni-info.org for detailed infor-
mation on blood sample collection, DNA preparation, and genotyping methods). APOE ε4 non-carriers were
defined as no APOE ε4 allele and APOE ε4 carriers as one or two APOE ε4 alleles.
Statistical analysis. In order to model the disease progression course from preclinical AD to AD dementia
using two cohorts, we carried out the following three processes: (1) modelling of ADAS-cog 13 scores for each
cohort, (2) calculating the time for ADAS-cog 13 scores from the two cohorts to start to overlap, (3) construct-
ing an entire disease continuum model. First, for the estimation of the model for longitudinal data (Fig. 2a), the
mixed-effects model with a random effect for the subject and a fixed effect for time was applied to each set of
disease cohort data. In the development of the model, ADAS-cog 13 scores were square root–transformed due
to a highly skewed distribution, and outliers with an absolute studentized residual larger than 3 were excluded
(Fig. 2b). Second, using the estimated mixed effect model for each cohort, the estimate and 95% confidence
interval (CI) for mean ADAS-cog 13 scores at the time were calculated. If a point estimate of mean ADAS-cog 13
score in MCI due to AD fell within the 95% CI of mean ADAS-cog 13 scores in preclinical AD, that a mean esti-
mate was considered as an overlapped mean ADAS-cog 13 score between the two cohorts. We found the small-
est mean score among the overlapped mean ADAS-cog 13 scores in the MCI due to AD cohort and substituted
this mean score into the estimated model for the preclinical AD cohort to calculate the corresponding time to
this mean ADAS-cog13 score. This indicated the time from mean baseline ADAS13 for preclinical AD to mean
baseline ADAS13 for MCI due to AD (Fig. 2c). Then, we shifted the MCI due to AD cohort data to start from
that time (Fig. 2d). Finally, a single model for the entire course of AD was estimated by analysing data from the
second step using a linear mixed effects model that included the same effect terms as the individual cohort mod-
els. In this model, the duration and its 95% CI for progression from preclinical AD to MCI due to AD and to AD
dementia was calculated in terms of the time corresponding to the median ADAS-cog 13 scores and the 95% CI
for the progressed groups (Fig. 3). To investigate the effect of sex and APOE ε4 status on ADAS-cog 13 decline,
another progression model for the entire AD continuum was developed using a linear mixed effects model that
included the combined effects of sex and APOE ε4 carrier status, as well as a time effect and a random intercept
effect (Fig. 4). Model fit was investigated using the Akaike information criterion (AIC), Bayesian information
criterion (BIC), and AIC with correction for finite sample size (AICC).
In a sensitivity analysis, we examined the learning effect and the effect of the different APOE ε4 allele distribu-
tions between the cohorts on the estimated results. We adjusted for learning effects (LEs), because LEs related
to repeated measurements may obscure cognitive decline and delay the detection of conversion to MCI13 and
AD. The magnitude of LEs was estimated and tested with six alternative linear mixed models according to the
covariates of age at baseline, sex, and education level14. ADAS-cog 13 scores adjusted for LEs were used for the
sensitivity analysis. We also performed frequency matching of APOE ε4 allele carriage for preclinical AD and
MCI due to AD, and estimated the ADAS-cog 13 score and the corresponding time for the two cohorts to start
to overlap using the matched data.
P-values were corrected for multiple testing using the Bonferroni method. Continuous and categorical vari-
ables were summarized as median (inter-quartile range (IQR, 1st quartile–3rd quartile) and frequency (percent-
age), respectively. A two-tailed P-value < 0.05 was considered to indicate statistical significance. The statistical
analysis was performed with SAS 9.1.3 (SAS Institute Inc, Cary, NC, USA) and the R3.4.1 package (Vienna,
Austria).
Results
Demographic and clinical characteristics of participants. The preclinical AD cohort included 127
participants, while the MCI due to AD cohort included 309 participants (Table 1). The median age of partici-
pants with preclinical AD was 74.6 years (IQR 70.8–78.5), while that of participants with MCI due to AD was
73.6 years (68.5–78.1). In the preclinical AD cohort and in the MCI due to AD cohort, 57 participants (44.9%)
and 210 participants (68.0%) were APOE ε4 carriers, respectively. Women comprised 79 participants (62.2%) in
the preclinical AD cohort, and 130 (42.1%) in the MCI due to AD cohort. The median years of education were 16
for both the preclinical AD cohort and the MCI due to AD cohort. The number of visits (median (IQR)) per par-
ticipant was 5 (3–7) in the preclinical AD cohort and 6 (4–7) in the MCI due to AD cohort. The follow-up period
was 48 (24–72) months in the preclinical AD cohort and 48 (36–60) months in the MCI due to AD cohort. The
median (IQR) ADAS-cog 13 scores were 9.3 (6.7–12.0) in the preclinical AD cohort and 17 (12.0–21.0) in the
MCI due to AD cohort. In the preclinical AD cohort, 37 participants (29.1%) progressed to MCI due to AD and
13 (10.2%) progressed to AD dementia. In the MCI due to AD cohort, 134 participants (43.4%) progressed to
AD dementia.
Disease progression modelling from preclinical AD to AD dementia. The median ADAS-cog 13
score was 16.0 points at the time of progression for participants who progressed from preclinical AD to MCI due
to AD and 26.8 points at the time of progression for participants who progressed from MCI due to AD to AD
dementia. The estimated years (95% CI) for progression from the median ADAS-cog 13 score in the preclinical
AD cohort (9.3 points) to the median ADAS-cog 13 at the time of progression in participants who progressed
from preclinical AD to MCI due to AD (16.0 points) was 7.8 (6.1–10.0) years. The estimated years for progres-
sion from preclinical AD to the median ADAS-cog 13 at the time of progression in participants who progressed
Scientific Reports | (2021) 11:4168 | https://doi.org/10.1038/s41598-021-83585-3 3
Vol.:(0123456789)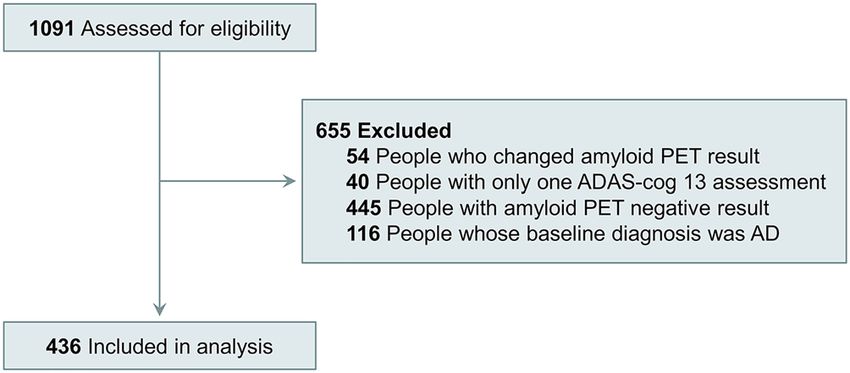
www.nature.com/scientificreports/
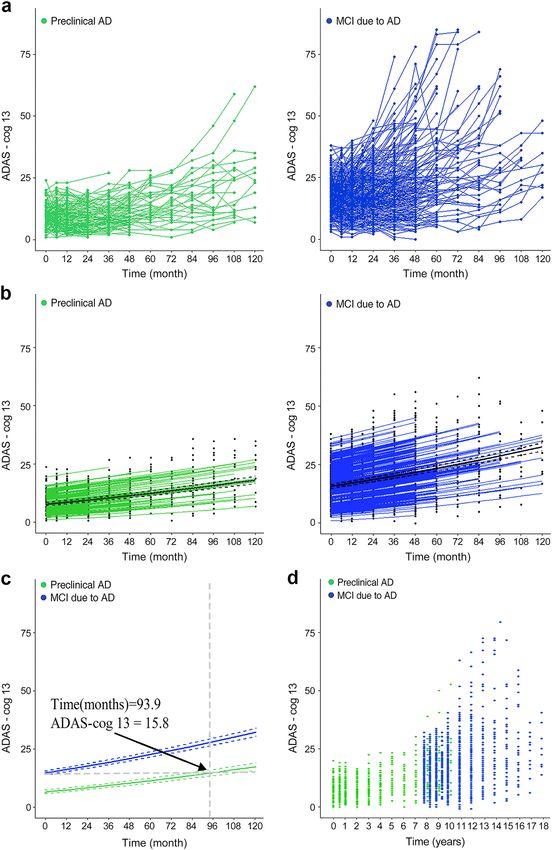
Figure 2. Modelling the course of Alzheimer’s disease using ADAS-cog 13 scores. (a) The pattern of individual
ADAS-cog 13 scores in individuals with preclinical AD and MCI due to AD. (b) The estimated ADAS-cog 13
scores over time for each subject and for each cohort, obtained from a linear mixed effects model with time
as a fixed effect and subjects as a random effect (excluding outliers). Green and blue lines mean the estimated
ADAS-cog 13 score for each subject at the time for preclinical AD and MCI due to AD, respectively. Black solid
and dotted lines mean the estimate and 95% confidence interval (CI) for mean ADAS-cog 13 score at the time.
(c) The estimated mean ADAS-cog 13 score and the corresponding time for two cohorts to start to overlap.
Solid line means the estimated mean ADAS-cog 13 score and dotted lines mean 95% CI of the estimated mean
ADAS-cog 13 score. (d) Scatter plot of the combined preclinical AD and MCI due to AD cohorts shifted by the
time of 93.9 months, corresponding to an ADAS-cog 13 score of 15.8 points. ADAS-cog: Alzheimer’s Disease
Assessment Scale-cognitive subscale, MCI: mild cognitive impairment; AD: Alzheimer’s Disease.
Scientific Reports | (2021) 11:4168 | https://doi.org/10.1038/s41598-021-83585-3 4
Vol:.(1234567890)www.nature.com/scientificreports/
Figure 3. Disease progression model from preclinical AD to AD dementia. The curves present the estimated
model—ADAS-cog 13 = (2.8492 + 0.0130 × month)2 – 0.5 and its 95% CI and the plots show preclinical AD
(green dots), progression to MCI due to AD (yellow dots), MCI due to AD (blue dots), and progression to AD
dementia (red dots). Using the median ADAS-cog 13 scores at the time of progression for individuals who
progressed from preclinical AD to MCI due to AD (16.0 points) and from MCI due to AD to AD dementia
(26.8 points), we estimated the time for preclinical AD to progress to MCI due to AD (7.8 years) and to AD
dementia (15.2 years). When using the median ADAS-cog 13 scores for late MCI (19.0 points) to estimate
time to progression, it took 8.9 years for preclinical AD to progress to late MCI. ADAS-cog: Alzheimer’s
Disease Assessment Scale-cognitive subscale; MCI: mild cognitive impairment; AD: Alzheimer’s Disease; CI:
Confidence interval.
from MCI due to AD to AD dementia (26.8 points) was 15.2 (14.1–15.9) years (Fig. 3). Additionally, when the
calculation was performed using the median ADAS-cog 13 score for LMCI (19 points), the estimated time to
progress from preclinical AD to LMCI was 8.9 years.
APOE ε4 effects on the course of disease progression by sex. We analysed the individual effect of
sex and APOE ε4 on ADAS-cog 13 score change over time for each cohort. APOE ε4 carriers had a faster decline
in ADAS-cog 13 score than APOE ε4 non-carriers in both cohorts (p = 0.0036 for preclinical AD, p < 0.0001 for
MCI due to AD). Women had a steeper decline in ADAS-cog 13 score than men (p < 0.0001 for both cohorts).
Then, to discover the combined effect of sex and APOE ε4 in the AD continuum, we analysed differences in the
rate of cognitive decline stratified by sex and APOE ε4 status (Fig. 4). APOE ε4 carriers had a steeper decline
in ADAS-cog 13 scores than did APOE ε4 non-carriers regardless of sex (p < 0.001). Women also had a steeper
decline in ADAS-cog 13 scores than men, irrespective of APOE ε4 carrier status (p < 0.001). ADAS-cog 13
scores deteriorated most rapidly for women APOE ε4 carriers and most slowly for men APOE ε4 non-carriers
(p < 0.001). Using the median ADAS-cog13 values for participants with MCI due to AD who progressed to AD
dementia, we calculated the time to progress from preclinical AD to AD dementia for four combinations of sex
and APOE ε4 status (Table 2). We estimated that women APOE ε4 carriers with a median ADAS-cog 13 score
(29 points) at the time of progression would take 11.5 (95% CI 10.0–11.9) years to progress to AD dementia.
When estimated in the same way, men APOE ε4 carriers took 12.7 (10.5–14.0) years to progress from preclinical
AD to AD dementia, while women APOE ε4 non-carriers took 20.2 (13.5–23.7) years and men APOE ε4 non-
carriers took 24.0 (17.7–30.9) years. In our disease model, we found that there were time differences between
APOE ε4 carriers and non-carriers in baseline median ADAS-cog 13 in the MCI due to AD cohort: 3.9 years for
women and 6.5 years for men (Fig. 4). More importantly, this difference started at the baseline median ADAS-
cog13 score for the preclinical AD cohort. To discover which model fit the data best, we performed goodness of
fit test for models with and without sex and APOE ε4 (Supplementary Table S1). The model including sex and
APOE ε4 was better than the model without those variables.
Sensitivity analysis. We performed frequency matching for APOE ε4 allele carriage between preclinical
AD and MCI due to AD cohort, and calculated the time for a subject to convert from the preclinical to prodro-
mal stage to examine the effect of the different APOE4 ε4 allele distributions between preclinical AD and MCI
Scientific Reports | (2021) 11:4168 | https://doi.org/10.1038/s41598-021-83585-3 5
Vol.:(0123456789)www.nature.com/scientificreports/
Figure 4. Sex and APOE ε4 effects on disease progression. We analysed differences in cognitive decline by sex
and APOE ε4 status. Different-coloured lines indicate women APOE ε4 carriers (red), women APOE ε4 non-
carriers (pink), men APOE ε4 carriers (dark blue) or men APOE ε4 non-carriers (light blue). The box plot shows
the median value of ADAS-cog 13 was 9.3 for preclinical AD and 17.0 for MCI due to AD. The time differences
between APOE ε4 carriers and non-carriers at baseline median ADAS-cog 13 in the MCI due to AD cohort
(17.0 points) were 3.9 years for women (10.3 years (APOE ε4 non-carriers)—6.4 years (APOE ε4 carriers))
and 6.5 years for men (13.5 years (APOE ε4 non-carriers)—7.0 years (APOE ε4 carriers)). The estimated
equation for each sex and APOE ε4 combination is as follows: ADAS Cog-13 = (2.6131 + 0.0203 × month)2 – 0.5
for women APOE ε4 carriers, = (2.6842 + 0.0121 × month)2 – 0.5 for women APOE ε4 non-
carriers, = (3.1198 + 0.0127 × month)2 – 0.5 for men APOE ε4 carriers, = (3.0806 + 0.0068 × month)2 – 0.5 for
men APOE ε4 non-carriers. ADAS-cog: Alzheimer’s Disease Assessment Scale-cognitive subscale; APOE:
Apolipoprotein E.
Diagnosis Preclinical AD MCI due to AD
Participants no. (%) 127 (29.2) 309 (70.9)
Age (year), median (IQR) 74.6 (70.8–78.5) 73.6 (68.5–78.1)
APOE ε4 carriers, no. (%) 57 (44.9)* 210 (68.0)*
Women, no. (%) 79 (62.2)* 130 (42.1)*
Education (year), median (IQR) 16 (14–18) 16 (14–18)
Follow up
Number of visits per participant, median (IQR) 5 (3–7) 6 (4–7)
Follow up month, median (IQR) 48 (24–72) 48 (36–60)
ADAS-cog 13
Median (IQR) 9.3 (6.7–12.0)* 17 (12.0–21.0)*
Conversion to
MCI due to AD, no (%) 37 (29.1)
AD dementia, no (%) 13 (10.2) 134 (43.4)
Table 1. Demographics and clinical features of participants with AD. Age, education, ADAS-cog 13 and
month of follow-up are expressed as median (IQR). Categorical variables are expressed as no (%). Statistical
analyses are performed with Chi-squared tests for APOEε4 carriers and sex. Mann Whitney test for age,
education and ADAS-cog 13. AD: Alzheimer’s disease; ADAS-cog: Alzheimer’s disease assessment scale-
cognitive subscale; APOE: apolipoprotein E; IQR: interquartile range; MCI: mild cognitive impairment.
*p < 0.05 between preclinical AD vs. MCI due to AD.
due to AD cohorts on the estimated results (Supplementary Fig. S1). The matched data showed ADAS-cog 13
score for the two cohorts at start of overlap was estimated as 15.1 (95% CI 14.1–16.2) and the corresponding
time was 7.4 years (88.2 months, 95% CI 77.0–99.4).This result did not differ much from the result using the
unmatched data (7.8 years, Fig. 3), but the time at which the two cohorts began to overlap was a little shorter in
the matched data.
Scientific Reports | (2021) 11:4168 | https://doi.org/10.1038/s41598-021-83585-3 6
Vol:.(1234567890)www.nature.com/scientificreports/
ADAS-cog 13a Estimated yearsb
Group Participants (N) Median (IQR) (95% CI)
Women APOE ε4 carriers 44 29 (23.5–33.0) 11.5 (10.0–11.9)
Men APOE ε4 carriers 57 25 (20.0–31.0) 12.7 (10.5–14.0)
Women APOE ε4 non-carriers 14 31 (23.0–34.0) 20.2 (13.5–23.7)
Men APOE ε4 non-carriers 19 25 (20.0–31.0) 24.0 (17.7–30.9)
Table 2. Estimated time to reach AD dementia depending on APOE ε4 status by sex. We assigned the
median ADAS-cog 13 score at the point of conversion from MCI due to AD to AD dementia to the equation
for each sex and APOE ε4 combination to obtain the estimated converting year to AD dementia. ADAS-cog:
Alzheimer’s disease assessment scale-cognitive subscale; APOE: apolipoprotein E; IQR: interquartile range;
CI: confidence interval. a ADAS-cog 13 median (IQR) at the point of conversion from MCI due to AD to AD
dementia. b Estimated years from preclinical AD to AD dementia.
Additionally, we performed an analysis for LEs to investigate the robustness of LEs. LEs were significant and
were estimated to affect a given ADAS-cog 13 score by − 0.52 for preclinical AD and by − 0.54 for MCI due to
AD in all models (Supplementary Table S2). After correcting for LEs and repeating the analyses, we estimated
the disease progression course from preclinical AD to AD dementia according to ADAS-cog 13 scores. The esti-
mated times for preclinical AD to progress to MCI due to AD and to AD dementia were 6.7 (95% CI, 5.0–9.0)
and 14.2 (13.1–14.9) years based on median ADAS-cog 13 scores (supplementary Fig. S2). When we analysed
differences in the rate of cognitive decline based on a combination of sex and APOE ε4 status after correcting
for LEs (supplementary Fig. S3), the progression order and significant differences among groups did not change
compared to the analysis of data uncorrected for LE.
Discussion
In the present study, using two separate cohorts, we modelled disease progression from preclinical AD to AD
dementia and determined whether APOE ε4 status and sex affected progression across the entire AD spectrum.
Our main findings were as follows. Our novel disease progression model indicated that it would take 7.8 years
for preclinical AD to progress to MCI due to AD and 15.2 years to progress to AD dementia based on median
ADAS-cog 13 scores. APOE ε4 carriers and women had worse cognitive trajectories across the entire AD spec-
trum. Across all sex and APOE ε4 combinations, women APOE ε4 carriers had the fastest cognitive decline.
Taken together, our findings provide a further understanding of AD progression across the disease spectrum,
and they will help to design individualized therapeutic and preventive strategies to ameliorate cognitive decline.
We modelled the AD disease progression course using two different cohorts and estimated that it took almost
15 years for preclinical AD to progress to AD dementia. In a recent article15, 14.5% of individuals with preclini-
cal AD developed incident MCI due to AD within a 3.7 year (mean) follow-up period, and 3.2% developed AD
dementia within 4.2 years of follow-up15. Additionally, studies have found that 32.7%15 and 70.0%16 of individuals
with MCI due to AD developed AD dementia within 3.2 and 3.6 years of follow-up, r espectively15,16. However,
2–4 years of follow-up may not be sufficient to estimate the entire course of disease progression. These previous
findings, thus, mainly characterize fast decliners in each disease stage. However, our estimated course is con-
sistent with indirect evidence provided in previous s tudies6,17, according to which the temporal lag between Aβ
deposition and the clinical syndrome of AD dementia was a d ecade6. In a meta-analysis, age-related increases
in amyloid positivity on PET in participants with normal cognition paralleled age-specific, AD-type dementia
prevalence estimates with an intervening period of about 20 y ears17,18. Another study estimated that it took
19.2 years for 11C-PiB levels observed in healthy controls with a 1.5 SUVR threshold to reach the mean SUVR
of AD (2.3)19. Our finding that it would take more than 15 years for preclinical AD to progress to AD dementia
suggests that appropriate interventions are needed to prevent preclinical AD from progressing to AD dementia.
In the present study, the estimated time from the preclinical to prodromal stage (7.8 years) was similar to
that from the prodromal to the dementia stage (7.4 years). Initially, we expected that the preclinical phase might
be longer than the prodromal phase. Our findings might have been related to our definition of the prodromal
phase using the early stage of MCI. If we define MCI due to AD as LMCI, the estimated time from preclinical AD
to LMCI (8.9 years) would be longer than that from MCI due to AD to AD dementia (6.3 years). Alternatively,
the study design—in particular, whether a study includes volunteer or clinic-based participants—might affect
time-to-event estimates. For example, studies may overestimate the progression rate in the presymptomatic
phase because the included participants might have more concerns about their cognition. Our disease progres-
sion model could be used to estimate the current and future state of preclinical AD patients in a prevention trial.
Another main finding is that sex and APOE ε4 had distinct effects on the progression course across the AD
continuum. Our finding that APOE ε4 aggravated cognitive decline across the entire AD spectrum regardless
of sex is partially consistent with previous studies. While APOE ε4 is a well-known risk factor for AD dementia
in the preclinical or prodromal s tage20, it has been debated whether APOE ε4 predicts a worse p rognosis21,22. A
previous study by our group revealed that APOE ε4 predicted more rapid hippocampal and cortical atrophy in
dementia with A D21. However, other studies have suggested that AD patients with APOE ε4 had a lower global
amyloid burden than matched APOE ε4 non-carriers22–24. This discrepancy might be due to differences in the
study populations (patients who progressed to AD dementia over time in the current study sample compared to
patients who had already progressed to AD dementia in previous studies).
Scientific Reports | (2021) 11:4168 | https://doi.org/10.1038/s41598-021-83585-3 7
Vol.:(0123456789)www.nature.com/scientificreports/
A more noteworthy finding that women APOE ε4 carriers showed more prominent cognitive decline than
did men APOE ε4 carriers across the AD s pectrum25,26. Our findings are consistent with a previous s tudy25,
which showed that women with higher Aβ levels had a faster cognitive decline than men and that women with
preclinical AD who were APOE ε4 carriers declined faster than their men counterparts. However, the previous
findings were not statistically significant after correction for multiple c omparisons25. Our findings further sug-
gest that women APOE ε4 carriers had a steeper cognitive decline than did men APOE ε4 carriers throughout
the entire AD spectrum. Therefore, developing a progression model stratified by these factors will help to select
cohorts for AD clinical trials.
Several possible explanations may account for the combined effects of sex and A POE27–30. A potential mecha-
nism could be that oestradiol promotes synaptic sprouting in response to injury through an APOE-dependent
mechanism27. Additionally, oestrogen might promote neural function under normal conditions, but exacerbate
dysfunction when network activity is d isrupted28. Alternatively, a previous study showed that the APOE ε4-by-
sex interaction on cerebrospinal fluid (CSF) tau levels were significant, suggesting that the increased APOE-
related risk in women may be associated with tau pathology29. In a recent multicohort study30, women showed
a stronger association between APOE and CSF tau levels than did men, particularly among amyloid-positive
individuals, suggesting that APOE may modulate the risk of downstream neurodegeneration in a sex-specific
manner, particularly in the presence of amyloidosis.
The ADNI is a well-organized, longitudinal cohort that serves as an excellent resource to investigate the dis-
ease course of AD. This study, however, has several limitations. We only included participants who were amyloid-
positive by PET. This leaves open the possibility that some patients had another primary pathological diagnosis.
Although participants clinically diagnosed with frontotemporal dementia or dementia with Lewy bodies and who
had moderate to severe white matter hyperintensity were excluded from the ADNI dataset, we did not consider
the effects of other neurodegenerative pathologies, including cerebrovascular disease, α-synuclein, transactive
response DNA-binding protein, argyrophilic grain pathology, and hippocampal sclerosis, on the progression
model. Importantly, amyloid positivity might only be a contributing or incidental factor in some patients with
dementia. This argument is mitigated to some degree by the fact that we included participants who progressed
from MCI due to AD to AD dementia. Additionally, we found that the ADAS-cog 13 scores in some participants
with CN and MCI improved over time. Although we controlled for LEs, we did not completely exclude the pos-
sibility that LEs might affect the disease progression to some degree.
Nevertheless, ADAS-cog 13 is the standard tool used in many clinical trials to assess AD, which makes our
results more interpretable across studies than if we had used another instrument. Finally, our progression rate
from NC to MCI (29.1%) was higher than has been observed in community-recruited older adults. For example,
a greater risk of progression from NC to MCI was observed in clinically-recruited older adults (30% per year)
than in community-recruited older adults (5% per year)31. The ADNI used identical recruitment mechanisms
to those of typical trials, including advertising and recruitment from memory clinics. Although our data might
not be representative of the general population, the recruitment and subject baseline characteristics were similar
to those of a typical AD clinical trial.
In the current study, we found that our model of the progression to disease may help clinicians to predict
where patients are in the disease course. In addition, it will help to predict how the disease course could vary
by sex and APOE ε4 status when consulting with patients and predicting treatment effects. Understanding
the natural history of AD and the rates of change of clinical phenotypes and biomarkers will facilitate specific
appropriate interventions.
Data availability
All raw data are available on the ADNI website. Anonymized and statistical information of all the participants
are available, upon reasonable request only among qualified investigators.
Received: 23 January 2020; Accepted: 29 January 2021
References
1. Donohue, M. C. et al. Association between elevated brain amyloid and subsequent cognitive decline among cognitively normal
persons. JAMA 317, 2305–2316. https://doi.org/10.1001/jama.2017.6669 (2017).
2. Ward, A., Tardiff, S., Dye, C. & Arrighi, H. M. Rate of conversion from prodromal Alzheimer’s disease to Alzheimer’s dementia:
A systematic review of the literature. Dement. Geriatr. Cogn. Dis. Extra 3, 320–332. https://doi.org/10.1159/000354370 (2013).
3. Cho, H. et al. Longitudinal changes of cortical thickness in early-versus late-onset Alzheimer’s disease. Neurobiol. Aging 34, 1921.
e9. https://doi.org/10.1016/j.neurobiolaging.2013.01.004 (2013).
4. Snowdon, D. A. & Nun, S. Healthy aging and dementia: Findings from the Nun Study. Ann. Intern. Med. 139, 450–454 (2003).
5. Wolf, P. A. Contributions of the Framingham Heart Study to stroke and dementia epidemiologic research at 60 years. Arch. Neurol.
69, 567–571. https://doi.org/10.1001/archneurol.2011.977 (2012).
6. Sperling, R. A. et al. Toward defining the preclinical stages of Alzheimer’s disease: Recommendations from the National Institute
on Aging-Alzheimer’s Association workgroups on diagnostic guidelines for Alzheimer’s disease. Alzheimers Dement. 7, 280–292.
https://doi.org/10.1016/j.jalz.2011.03.003 (2011).
7. Albert, M. S. et al. The diagnosis of mild cognitive impairment due to Alzheimer’s disease: Recommendations from the National
Institute on Aging-Alzheimer’s Association workgroups on diagnostic guidelines for Alzheimer’s disease. Alzheimers Dement. 7,
270–279. https://doi.org/10.1016/j.jalz.2011.03.008 (2011).
8. McKhann, G. M. et al. The diagnosis of dementia due to Alzheimer’s disease: Recommendations from the National Institute on
Aging-Alzheimer’s Association workgroups on diagnostic guidelines for Alzheimer’s disease. Alzheimers Dement. 7, 263–269.
https://doi.org/10.1016/j.jalz.2011.03.005 (2011).
9. Aisen, P. S., Petersen, R. C., Donohue, M., Weiner, M. W. & Alzheimer’s Disease Neuroimaging, I. Alzheimer’s disease neuroimaging
initiative 2 clinical core: Progress and plans. Alzheimers Dement. 11, 734–739. https://doi.org/10.1016/j.jalz.2015.05.005 (2015).
Scientific Reports | (2021) 11:4168 | https://doi.org/10.1038/s41598-021-83585-3 8
Vol:.(1234567890)www.nature.com/scientificreports/
10. Skinner, J. et al. The Alzheimer’s Disease Assessment Scale-Cognitive-Plus (ADAS-Cog-Plus): An expansion of the ADAS-Cog to
improve responsiveness in MCI. Brain Imaging Behav. 6, 489–501. https://doi.org/10.1007/s11682-012-9166-3 (2012).
11. Mohs, R. C. et al. Development of cognitive instruments for use in clinical trials of antidementia drugs: Additions to the Alzhei-
mer’s Disease Assessment Scale that broaden its scope. The Alzheimer’s Disease Cooperative Study. Alzheimer Dis. Assoc. Disord.
11(Suppl 2), S13–S21 (1997).
12. Landau, S. M. et al. Amyloid deposition, hypometabolism, and longitudinal cognitive decline. Ann. Neurol. 72, 578–586. https://
doi.org/10.1002/ana.23650(2012).
13. Elman, J. A. et al. Underdiagnosis of mild cognitive impairment: A consequence of ignoring practice effects. Alzheimers Dement.
10, 372–381. https://doi.org/10.1016/j.dadm.2018.04.003 (2018).
14. Vivot, A. et al. Jump, hop, or skip: Modeling practice effects in studies of determinants of cognitive change in older adults. Am. J.
Epidemiol. 183, 302–314. https://doi.org/10.1093/aje/kwv212 (2016).
15. Roberts, R. O. et al. Prevalence and outcomes of amyloid positivity among persons without dementia in a longitudinal, population-
based setting. JAMA Neurol. 75, 970–979. https://doi.org/10.1001/jamaneurol.2018.0629 (2018).
16. Ye, B. S. et al. Longitudinal outcomes of amyloid positive versus negative amnestic mild cognitive impairments: A three-year
longitudinal study. Sci. Rep. 8, 5557. https://doi.org/10.1038/s41598-018-23676-w (2018).
17. Jansen, W. J. et al. Prevalence of cerebral amyloid pathology in persons without dementia: A meta-analysis. JAMA 313, 1924–1938.
https://doi.org/10.1001/jama.2015.4668 (2015).
18. Jansen, W. J. et al. Association of cerebral amyloid-beta aggregation with cognitive functioning in persons without dementia. JAMA
Psychiatry 75, 84–95. https://doi.org/10.1001/jamapsychiatry.2017.3391 (2018).
19. Villemagne, V. L. et al. Amyloid beta deposition, neurodegeneration, and cognitive decline in sporadic Alzheimer’s disease: A
prospective cohort study. Lancet Neurol. 12, 357–367. https://doi.org/10.1016/S1474-4422(13)70044-9 (2013).
20. Farrer, L. A. et al. Effects of age, sex, and ethnicity on the association between apolipoprotein E genotype and Alzheimer disease.
A meta-analysis. APOE and Alzheimer Disease Meta Analysis Consortium. JAMA 278, 1349–1356 (1997).
21. Kim, Y. J. et al. Apolipoprotein e4 affects topographical changes in hippocampal and cortical atrophy in Alzheimer’s disease
dementia: A five-year longitudinal study. J. Alzheimers Dis. 44, 1075–1085. https://doi.org/10.3233/JAD-141773 (2015).
22. Lehmann, M. et al. Greater medial temporal hypometabolism and lower cortical amyloid burden in ApoE4-positive AD patients.
J. Neurol. Neurosurg. Psychiatry 85, 266–273. https://doi.org/10.1136/jnnp-2013-305858 (2014).
23. Rowe, C. C. et al. Amyloid imaging results from the Australian Imaging, Biomarkers and Lifestyle (AIBL) study of aging. Neurobiol.
Aging 31, 1275–1283. https://doi.org/10.1016/j.neurobiolaging.2010.04.007 (2010).
24. Ossenkoppele, R. et al. Differential effect of APOE genotype on amyloid load and glucose metabolism in AD dementia. Neurology
80, 359–365. https://doi.org/10.1212/WNL.0b013e31827f0889 (2013).
25. Buckley, R. F. et al. Sex, amyloid, and APOE epsilon4 and risk of cognitive decline in preclinical Alzheimer’s disease: Findings
from three well-characterized cohorts. Alzheimers Dement. 14, 1193–1203. https://doi.org/10.1016/j.jalz.2018.04.010 (2018).
26. Lin, K. A. et al. Marked gender differences in progression of mild cognitive impairment over 8 years. Alzheimers Dement. 1,
103–110. https://doi.org/10.1016/j.trci.2015.07.001 (2015).
27. Stone, D. J., Rozovsky, I., Morgan, T. E., Anderson, C. P. & Finch, C. E. Increased synaptic sprouting in response to estrogen via an
apolipoprotein E-dependent mechanism: implications for Alzheimer’s disease. J. Neurosci. 18, 3180–3185. https: //doi.org/10.1523/
jneurosci.18-09-03180.1998 (1998).
28. Broestl, L. et al. Ovarian cycle stages modulate Alzheimer-related cognitive and brain network alterations in female mice. eNeuro
https://doi.org/10.1523/ENEURO.0132-17.2018 (2018).
29. Altmann, A., Tian, L., Henderson, V. W. & Greicius, M. D. Sex modifies the APOE-related risk of developing Alzheimer disease.
Ann. Neurol. 75, 563–573. https://doi.org/10.1002/ana.24135 (2014).
30. Hohman, T. J. et al. Sex-specific association of apolipoprotein E with cerebrospinal fluid levels of tau. JAMA Neurol. 75, 989–998.
https://doi.org/10.1001/jamaneurol.2018.0821 (2018).
31. Chen, Y. et al. Progression from normal cognition to mild cognitive impairment in a diverse clinic-based and community-based
elderly cohort. Alzheimers Dement. 13, 399–405. https://doi.org/10.1016/j.jalz.2016.07.151 (2017).
Acknowledgements
This research was supported by the Brain Research Program through the National Research Foundation of Korea
(NRF) funded by the Ministry of Science, ICT & Future Planning (2016M3C7A1913844), National Research
Council of Science & Technology (NST) grant by the Korea government (MSIP) (No. CRC-15-04-KIST), grant
of the Korean Health Technology R&D Project, Ministry of Health & Welfare, Republic of Korea (HI18C0335,
HI19C1132) and Chonnam National University Hospital Biomedical Research Institute (BCRI20012). Data
used in preparation of this article were obtained from the Alzheimer’s Disease Neuroimaging Initiative (ADNI)
database (adni.loni.usc.edu). As such, the investigators within the ADNI contributed to the design and imple-
mentation of ADNI and/or provided data but did not participate in analysis or writing of this report. A com-
plete listing of ADNI investigators can be found at: http://adni.loni.usc.edu/wp-content/uploads/how_to_apply
/ADNI_Acknowledgement_List.pdf.
Author contributions
S.H.C., S.Y.W., S.K. and S.W.S. contributed to the study conception, design of the study, data analysis, data inter-
pretation and drafting. C.K., H.J.K., H.M.J., B.C.K., S.E.K., S.J.K., J.P.K., Y.H.J. and D.L.N. contributed to data
interpretation. S.L., R.O., S.L. and M.W. drafted the manuscript.
Competing interests
The authors declare no competing interests.
Additional information
Supplementary Information The online version contains supplementary material available at https://doi.
org/10.1038/s41598-021-83585-3.
Correspondence and requests for materials should be addressed to S.K. or S.W.S.
Reprints and permissions information is available at www.nature.com/reprints.
Publisher’s note Springer Nature remains neutral with regard to jurisdictional claims in published maps and
institutional affiliations.
Scientific Reports | (2021) 11:4168 | https://doi.org/10.1038/s41598-021-83585-3 9
Vol.:(0123456789)www.nature.com/scientificreports/
Open Access This article is licensed under a Creative Commons Attribution 4.0 International
License, which permits use, sharing, adaptation, distribution and reproduction in any medium or
format, as long as you give appropriate credit to the original author(s) and the source, provide a link to the
Creative Commons licence, and indicate if changes were made. The images or other third party material in this
article are included in the article’s Creative Commons licence, unless indicated otherwise in a credit line to the
material. If material is not included in the article’s Creative Commons licence and your intended use is not
permitted by statutory regulation or exceeds the permitted use, you will need to obtain permission directly from
the copyright holder. To view a copy of this licence, visit http://creativecommons.org/licenses/by/4.0/.
© The Author(s) 2021
Scientific Reports | (2021) 11:4168 | https://doi.org/10.1038/s41598-021-83585-3 10
Vol:.(1234567890)You can also read