PREDICTION OF FUNCTIONAL PROPERTIES - OF NANO TIO
←
→
Page content transcription
If your browser does not render page correctly, please read the page content below
www.nature.com/scientificreports
OPEN Prediction of functional properties
of nano TiO2 coated cotton
composites by artificial neural
network
Nesrine Amor*, Muhammad Tayyab Noman & Michal Petru
This paper represents the efficiency of machine learning tool, i.e., artificial neural network (ANN),
for the prediction of functional properties of nano titanium dioxide coated cotton composites. A
comparative analysis was performed between the predicted results of ANN, multiple linear regression
(MLR) and experimental results. ANN was applied to map out the complex input-output conditions
to predict the optimal results. A backpropagation ANN model called a multilayer perceptron (MLP),
trained with Bayesian regularization were used in this study. The amount of chemicals and reaction
time were selected as input variables and the amount of titanium dioxide coated on cotton, self-
cleaning efficiency, antimicrobial efficiency and ultraviolet protection factor were analysed as output
results. The accuracy of the proposed algorithm was evaluated and compared with MLR results. The
obtained results reveal that MLP provides efficient results that are statistically significant in the
prediction of functional properties ( p < 0.1e−10) compared to MLR. The correlation coefficient of
MLP model (> 95%) indicates that there is a strong correlation between the measured and predicted
functional properties with a trivial mean absolute error and root mean square errors values. MLP
model is suitable for the functional properties and can be used for the investigation of other properties
of nano coated fabrics.
Titanium dioxide ( TiO2) in nano forms (nanoparticles, nanowires, nanorods, nanosheets, nanoflowers) have
shown tremendous impact in many industries (especially in textiles) as a multifunctional coating material.
Nano TiO2 is frequently used to achieve not only photocatalytic self-cleaning, antimicrobial properties, super-
hydrophilic surfaces and water purification due to its higher surface area, but also in protective textiles against
ultraviolet (UV) radiations, noise mitigation and air p ollution1,2. TiO2 is an intrinsic n type metal oxide semi-
conductor material that closely resembles with zinc oxide in photocatalytic properties. The prominent features
that enables TiO2 as a functional material in multiple applications are photocatalytic activity, chemical stability
and non-toxicity3. Researchers have synthesized and coated nano TiO2 on textile substrates for photocatalytic
and other functional properties4–7. In an experimental study, Noman et al. synthesized TiO2 nanoparticles and
successfully coated on cotton fabric. The coated fabric was analysed against methylene blue dye and bacteria
culture for self cleaning and antimicrobial properties respectively. The coated fabric showed significant results
for self-cleaning and antimicrobial properties. The design of experiment was based on central composite design
(CCD) and the obtained results were statistically evaluated under regression model through Design Expert (DE)
software8. Here, in this current study, an attempt has been made to develop a prediction model by using machine
learning tools that can work in two ways i.e., correlates the actual response of coated fabric with process vari-
ables, analyse the predicted response of DE and indicate which approach is better as a prediction model in reality.
Nowadays, ANN exhibits a strong advantage in capturing any type of existing relationship from given data as
it does not include a physical mechanism and a mathematical model. Thanks to the training process, ANN can
learn, understand and recognize the information treatment rules, adapt and predict the wanted output variables
from database considered as input v ariables9.
In general, textile processes are mostly non-linear in nature and a lot of efforts are applied to obtain optimal
solutions10–12. ANN is an excellent approach that has been widely used by different group of researchers for the
prediction of various properties of textile materials for different purposes where it has proven its effectiveness and
potential. Malik et al. applied a backpropagation ANN to predict the tensile properties of even and uneven yarns
Department of Machinery Construction, Institute for Nanomaterials, Advanced Technologies and Innovation (CXI),
Technical University of Liberec, Studentská 1402/2, 461 17 Liberec 1, Czech Republic. *email: nesrine.amor@tul.cz
Scientific Reports | (2021) 11:12235 | https://doi.org/10.1038/s41598-021-91733-y 1
Vol.:(0123456789)www.nature.com/scientificreports/
extracted from polyester-cotton blend. The selected parameters for this study were twist multiplier, cot hardness
and break draft ratio. Simulation results of tensile properties were obtained through ANN and compared with
MLR, where ANN outperformed M LR13. In another study, Malik et al. proposed ANN for the prediction the warp
and weft yarns crimp in woven barrier fabrics. The use of ANN to predict yarn crimp has shown good results in
the predicted output, especially for the warp yarn (with less prediction error between actual and predicted out-
put)14. In another experimental study, Malik et al. used ANN for the prediction of antimicrobial performance of
chitosan/AgCl-TiO2 coated fabrics. The input variables were curing time and concentration of colloids. Samples
were developed with different blends of selected colloid under different curing time. Backpropagation ANN was
trained under a hybrid combination of Bayesian regularization and Levenberg Marqaurdt algorithms15. The same
group of Malik et al. extended their study and applied ANN to develop a relationship between loom parameters,
used material and construction of fabric in terms of porosity, mean pore flow, mean pore size with air perme-
ability. The experimental result showed ANN provided prediction with high accuracy of comfort properties
with minimal e rror16. Almetwally et al. applied ANN and linear regression for the prediction of core spun yarn
strength, elongation and rupture. The results showed that ANN propose highly accurate prediction of spinning
strength17. Farook et al. used ANN to predict cotton fibre maturity. They selected various fibre characteristics as
an input variables and analyzed fibre maturity as an output variable. The simulation results showed that ANN
predicted cotton fibre maturity with small e rror18. In another study, Farooq et al. proposed ANN to predict the
change of shade of dyed knitted fabrics that would happen after finishing application. The inputs were the shade
percentage, dye color, and finishing concentrations. The outputs were the delta values of the selected samples
with respect to standard samples. Tests results showed that ANN provide high prediction accuracy for shade
change that occurred during fi nishing19. Dashti et al. predicted the yarn tenacity using ANN trained by genetic
algorithm. The performance of this approach was useful to achieve desired tenacity with minimum production
cost. However, it is a time-consuming process20. Furferi et al. introduced ANN for the prediction of coatings
process on textile fabrics. Testing results demonstrated the significance of ANN model particularly for coat-
ing mechanisms21. Knanat et al. applied ANN for the prediction of thermal resistance of wet knitted fabrics.
The results showed efficient prediction of thermal resistance22. Ribeiro et al. proposed an automated machine
learning method to predict physical properties of woven fabrics based on finishing features and textile design23.
However, the prediction of overall mechanical behavior of textile composites is still a very challenging task due
to the complexities of microstructures and boundary conditions24,25. Taieb et al. used ANN for the prediction of
fabric drapability under low s tress26. They reported that physical factors play crucial role while predicting fabric
drapability properties. Kalkanci et al. estimated fabric shrinkage by applying ANN algorithm inside relaxation
methods27. Thermofixing, sanforizing, drying and washing are the important processes that are applied on fabrics
during finishing a pplications28. Dimensional changes were predicted at the end of finishing processes by ANN.
The experimental results showed that ANN gives better prediction results for dimensional change. Khan et al.
investigated mechanical properties of cross-ply laminated fibre-reinforced polymer composites as well as mod-
elled and predicted the mechanical properties using A NN29. The composite samples were developed by altering
glass fibre layers with carbon fibre layers and polyphenylene sulphide with high-density polyethylene. The fibers
were used as reinforcement materials and polyphenylene sulphide was used as a polymer matrix. Mechanical
properties i.e., hardness, flexural modulus, impact and rupture strength were investigated for both directions.
Simulation results showed that ANN predicts the mechanical properties with low MAE which computed between
actual and predicted values.
The above discussed literature reveal that the most common ANN type used in textile industry is MLP30,31.
MLP is a class of backpropagation ANN that has the advantages of self-learning, high nonlinearity resolution and
the ability of mapping between input and output variables without introducing a mathematical model between
nonlinear data and precisely predict the best function. As well as the authors searched, there is no relevant
literature available on the use of ANN in any form to investigate or predict the functional properties of nano
TiO2 coated textiles. Therefore, an approach has been introduced in this paper that is based on MLP model for
the prediction of various properties of nano TiO2 coated cotton. The amount of titanium precursor, amount of
solvent and process time were selected as input variables whereas the amount of nano TiO2 coated on cotton
fabric, and some related functional properties i.e., self-cleaning efficiency, antimicrobial efficiency and ultraviolet
protection factor (UPF) were considered as outputs variables. The achieved results were compared with MLR
and with the experimental values using analysis of variance (ANOVA).
Materials and methods
Materials. Bleached cotton fabric with mass (GSM) 110 g m−2 was used for samples preparation. All other
chemicals i.e., titanium tetrachloride, isopropanol and methylene blue dye were taken from sigma aldrich.
Experimental design. Design of experiment with various amount of titanium tetrachloride and isopro-
panol under fluctuating sonication time is based on central composite design for all developed samples as shown
in Table 1. The optimization of independent variables was performed by Design-Expert 10 software. Total 20
samples were developed during experimental study. The variables used during the study were the amount of
titanium precursor (titanium tetrachloride), the amount of solvent (isopropanol) and sonication time. The com-
bination of variables is expressed in Table 1. The experimental results were obtained by using the following
quadratic Equation.
Y = b0 + bi Xi + bi,j Xi Xj + bi,i Xi 2 , where i ≥ j and i, j = 1, 2, 3. (1)
Scientific Reports | (2021) 11:12235 | https://doi.org/10.1038/s41598-021-91733-y 2
Vol:.(1234567890)www.nature.com/scientificreports/
Sample Amount of titanium tetrachloride (ml) Amount of isopropanol (ml) Sonication time (h)
1 10 6 0.5
2 6 4 3
3 2 2 0.5
4 6 4 4
5 6 2 3
6 10 2 4
7 2 6 4
8 6 6 2
9 10 6 2
10 6 4 1
11 6 4 2
12 2 4 1
13 6 4 3
14 6 4 1
15 2 6 0.5
16 2 2 4
17 6 4 2
18 10 4 3
19 6 4 1
20 10 2 0.5
Table 1. The input variables and experimental design.
In the above equation, b0 represents the coefficient of constant term, bi represents the coefficient of linear term
that explains the persuade of the variables, bi,j represents the coefficient of two factors interaction and bi,i repre-
sents the coefficient of quadratic term r espectively8.
Artificial neural network. Artificial intelligence techniques seem to be promising and are still evolving.
ANN are machine learning algorithms based on mathematical models that are identical and inspired by biologi-
cal nerve systems, responsible for the functionality of human brain. It consists of large sets of neurons connected
by axons. Artificial neurons are individual neural units that are interconnected with each other to form a net-
work.The crucial point of this technology is the connection between individual neural units that can be rein-
forcing or inhibiting. This action is exercised through a combination of input values and an activation function,
which returns the output of a neuron. A very special feature of ANN is the automatically creation, derivation and
exploration of new information using previous learning that is called as training p rocess32.
A multilayer perceptron method is a class of feedforward ANN. Backpropagation (BP) is one of the most
common and typical learning algorithm in MLP that deals with non-linear models by reducing the desired target
error in a gradient descent pattern though tailoring the weight factors and b iases33,34. In this algorithm, training
occurs in three steps: (1) Forward propagation step: an experimental data is introduced to MLP as input and its
effect is propagated, in stages, through different layers of the network. Then, as a result, the outputs are generated.
(2) Computation of the error: the error vector is computed from the difference between predicted and actual
outputs. (3) Backward propagation step: The computed error vector is propagated backwards to the MLP and the
synaptic weights are adjusted in such a way that the error vector reduces with every iterative step. Furthermore,
the MLP model is getting closer and closer to generating the desired output.
Technically, MLP are used to model non-linear problems in order to predict output dependent variables
y = [y1 , . . . , yn ] for given independent input variables x = [x1 , . . . , xk ] from their training values. The obtained
results mainly depend on weights w = [w1 , . . . , wk ]. The following equation represents the relationship between
input and output of the network35,36:
�
y = ϕ wj ∗ xj + b, (2)
j
where, y is the output. xj is the jth input. wj is the jth weight and b represents the bias. ϕ is the activation function.
The biases and weights comprise the information that the neuron recovers during the training phase. A detail
theoretical discussion of ANN architecture and training algorithms are presented by different researchers in their
studies9,37,38. Theoretically, by increasing number of network layers, ANN generates significantly accurate results.
However, increasing number of network layers is a time consuming process and makes the training process dif-
ficult to fit. Therefore, we adopted the standard classical structure of MLP that includes three-layers, one input
layer; one hidden layer, and one output layer for the prediction of functional properties. Figure 1 displays the
schematic structure of the proposed MLP model for this study.
Scientific Reports | (2021) 11:12235 | https://doi.org/10.1038/s41598-021-91733-y 3
Vol.:(0123456789)www.nature.com/scientificreports/
Figure 1. MLP model for the prediction of functional properties of nano TiO2 coated cotton.
There were training and testing parts in the proposed MLP model and 75% of the data from Table 1 was used
for the training of the proposed model whereas 25% of the data was used for testing purpose respectively. Three
physical factors shown in Table 1 were considered as training inputs vectors. Therefore, the number of input
nodes for training was 3; the number of nodes for output layer was 4 and the number of nodes for hidden layer
was calculated according to the following e quation34:
√
N = m + n + a, (3)
where N is the number of hidden layer nodes. m and n represent the number of input and output nodes, respec-
tively. a is a constant with a value range [1, 10]. The best number of hidden layer nodes was determined from
this value range.
Model selection. The performance of the proposed MLP model was evaluated using various statistical indi-
cators i.e., root mean squared error (RMSE), mean absolute error (MAE), Pearson correlation coefficient (r) and
coefficient of determination ( R2), defined respectively by the following equations:
1 n
RMSE = � (yi − ŷi )2 , (4)
n i=1
1 n
(5)
MAE = �i=1 (yi − ŷi ) ,
n
n ¯
− ȳ)(yˆi − ŷ)
i=1 (yi
r =
, (6)
n 2 n ¯ 2
i=1 (yi − ȳ) i=1 (yˆi − ŷ)
2
�n
(yi − ȳ)(yˆi − ¯
ŷ)
i=1
R 2 = �� �� , (7)
n
(y − ȳ)2 n
(yˆ − ¯
ŷ)2
i=1 i i=1 i
where yi and ŷ represent the actual and network outputs, respectively. n is the number of samples. ȳ represents
the mean of the actual variables and ŷ¯ is the mean of the predicted variables.
Sensitivity analysis. Sensitivity analysis (SA) is a statistical method that provides an idea of how sensitive
is the best solution chosen to any changes in input values from one or more p arameters39. ANOVA is an inde-
pendent SA method that assesses if there is any statistically significant association between one or more inputs
and output40–43. ANOVA utilizes the statistic ratio F to define if there is a significant difference exists between
the average responses to main interactions or interactions between factors. The higher F-value indicates higher
rankings. The p-value represents the differences between column means if they are significant or not. In this
paper, one-way ANOVA is used to assesses the difference between the obtained results using the proposed MLP
model, MLR and experimental values.
Scientific Reports | (2021) 11:12235 | https://doi.org/10.1038/s41598-021-91733-y 4
Vol:.(1234567890)www.nature.com/scientificreports/
Figure 2. Root mean square error (RMSE) and coefficient of determination R2 for different hidden layer nodes.
Hidden layer function Output layer function R2 r RMSE
Purelin Purelin 0.9796 0.9897 61.9663
Purelin Tansig 0.9740 0.9869 69.8786
Purelin Logsig 0.8576 0.9261 163.5759
Logsig Tansig 0.9976 0.9988 21.3844
Logsig Logsig 0.8469 0.9203 169.5826
Logsig Purelin 0.9788 0.9893 63.0491
Tansig Tansig 0.9829 0.9914 56.5975
Tansig Logsig 0.8337 0.9131 176.7290
Tansig Purelin 0.9871 0.9935 49.2292
Table 2. Errors of different transfer functions.
Results and discussion
Analysis of the proposed MLP model. Functional properties of nano TiO2 coated cotton fabric were
predicted through backpropagation MLP model. The selected MLP model with three-layers (i.e., an input, a
hidden, and an output layers) was adjusted in a way that the number of hidden layer nodes could not exceed the
range of values [4, 13] according to Eq. (3). Afterwards, the results were tested for different number of hidden
layer nodes in this values range. Figure 2 represents the errors and accuracy in terms of RMSE and R2 for differ-
ent number of hidden layer nodes. The obtained results reveal that the proposed MLP model with 11 nodes has
the lower computation error and higher accuracy with RMSE = 21.3844 and R2 = 0.9976, respectively. There-
fore, MLP model with 11 nodes was adopted and further used in this work.
Regarding the transfer function, there are three main transfer functions mostly used for hidden and output
layers i.e., logarithmic sigmoid (logsig), tangent sigmoid (tansig) and purelin (a linear function) functions. The
best selection of a transfer function for input and output layers guarantee the accuracy of the predicted results.
Therefore, all possible measures were taken to assure that the tests were performed in such a way where the
network structure, the thresholds and the weights were the same. Table 2 shows the RMSE, r and R2 of different
transfer functions. It was observed that the determination of transfer function of hidden and output layers has
a significant influence on the desired prediction accuracy. The selection of logsig transfer function for hidden
layer and tansig transfer function for output layer provide lower errors according to RMSE and high accuracy
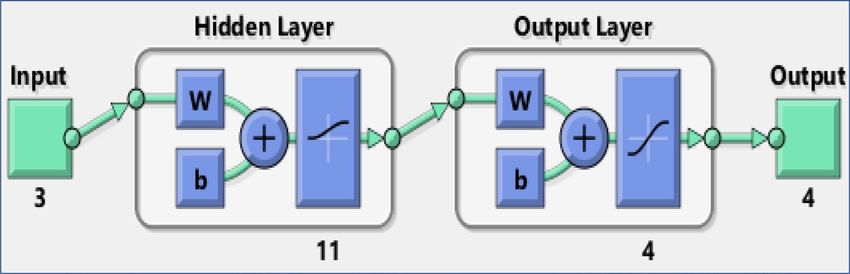
according to R2 and r. Figure 3 represents the MLP model based on the optimal structure (number of layers and
layer nodes) according to our observations and this model is further utilised for the prediction of results. The
setting of training parameters are presented in Table 3.
MLR model. The purpose of MLR is to investigate the relationship between independent variables i.e.,
(amount of titanium tetrachloride, amount of isopropanol, and sonication time) and the obtained results i.e.,
(self-cleaning efficiency, antimicrobial efficiency and UPF) for nano TiO2 coated cotton fabric. Moreover, the
performance of MLR and MLP were compared using the MAE, RMSE, correlation coefficient and the coefficient
of determination released in the four properties.
Comparison of MLP and MLR results. A comparison of the predicted results of MLP model was made
with MLR results of all functional properties for different amount of precursor and solvent under varying reac-
tion time. The predicted results for all four outputs are presented in Fig. 4. The absolute errors given by the dif-
ference between predicted and actual values for both MLP and MLR is shown in Fig. 5.
Scientific Reports | (2021) 11:12235 | https://doi.org/10.1038/s41598-021-91733-y 5
Vol.:(0123456789)www.nature.com/scientificreports/
Figure 3. The experimental structure of MLP model.
Parameters Settings
Training function Trainbr
Transfer function of Hidden layer Logsig
Transfer function of Output layer Tansig
Epochs 1000
Input node 3
Hidden node 11
Output node 4
Learning rate 0.02
Performance goal 0.00001
Table 3. Parameters and settings of training network.
Figure 4. The predicted and actual values using MLP and MLR.
Scientific Reports | (2021) 11:12235 | https://doi.org/10.1038/s41598-021-91733-y 6
Vol:.(1234567890)www.nature.com/scientificreports/
Figure 5. Absolute errors between predicted and actual values using MLP and MLR.
Multifunctional properties Methods RMSE MAE R2 r
MLP 41.19 27.97 0.903 0.9503
Nano TiO2 Coated amount
MLR 70.94 55.64 0.86 0.9274
MLP 5.35 4.59 0.95 0.9747
Self-cleaning efficiency
MLR 6.10 5.25 0.52 0.7211
MLP 7.51 6.98 0.95 0.9747
Antimicrobial efficiency
MLR 8.27 7.69 0.54 0.7348
MLP 6.82 5.81 0.93 0.9644
UPF
MLR 3.45 7.46 0.85 0.9220
Table 4. The performance measures of MLP and MLR for functional properties of nano TiO2 coated cotton.
The cumulative mean of both RMSE and MAE, R2, and r of both MLP and MLR models for all four functional
properties are presented in Table 4. The results reveal that the values of estimation error were significantly lower
for the proposed MLP model as compared to MLR for all four functional properties.
The correlation between the actual and the predicted values using MLP of all tested properties is illustrated in
Fig. 6. It is observed from the results that the correlation ( R−value) provide a very strong relationship between
the actual and predicted values, where R = 99% for Nano TiO2 coated amount, R = 96% for Self-Cleaning effi-
ciency, R = 95% for antimicrobial efficiency, and R = 93% for UPF.
The relation between actual and predicted values by MLR model had been plotted using a linear regression
model in Fig. 7. We noted that MLR model provide a good correlation between the actual and predicted values
especially for the first functional property Nano TiO2 coated amount, where R = 96%. However, the results shows
less accuracy for the other three functionals properties, where R = 78% for Self-Cleaning efficiency, R = 75%
for antimicrobial efficiency, and R = 82% for UPF. As result, MLP outperformed MLR for the prediction of the
all functional properties.
Scientific Reports | (2021) 11:12235 | https://doi.org/10.1038/s41598-021-91733-y 7
Vol.:(0123456789)www.nature.com/scientificreports/
Figure 6. Correlation between the predicted and actual values for overall sets of data using MLP model.
Robustness assessment. A one-way ANOVA test was applied to assess the robustness of the predicted
results using MLP, MLR as well as the experiment data. ANOVA test helps to knows how it is the correlations
between the predicted responses of coated fabric with process variables. Table 5 shows the results of the one-
way ANOVA test of each functional properties obtained by MLP, MLR and experimental. It is observed that the
developed MLP model was more statistically significant as compared to MLR and experimental, as it provides
the lowest p-value for all functional properties.
Conclusions
In this paper, a specific class of ANN called MLP model was developed and compared with MLR for the predic-
tion of functional properties of nano TiO2 coated cotton fabric. The developed MLP model was used to correlate
different output results with varying input variables. The obtained results showed a higher prediction accuracy
for the developed MLP model i.e., ( p < 0.1e−10 and r > 95%) compared to MLR. The computed values of RMSE
and MAE from all predicted results confirmed that the proposed MLP model has lower error as compared to
MLR. The successful utilization of the developed model revealed a non-linear relationship between the selected
parameters for the prediction of functional properties. The findings of this work highlight that MLP approach
can be effectively used for the prediction of other properties of nano coated fabrics.
Scientific Reports | (2021) 11:12235 | https://doi.org/10.1038/s41598-021-91733-y 8
Vol:.(1234567890)www.nature.com/scientificreports/
Figure 7. Correlation between the predicted and actual values using MLR model.
Multifunctional properties Methods p-value F-value
Experimental 8.38e−7 29.99
Nano TiO2 coated amount MLP 3.24e−8 47.88
MLR 4.22e−7 33.18
Experimental 0.001 8.92
Self-cleaning efficiency MLP 7.17e−11 109.38
MLR 0.007 5.78
Experimental 2.65e−5 17.47
Antimicrobial efficiency MLP 2.18e−11 127.76
MLR 0.005 6.284
Experimental 2.33e−5 17.86
UPF MLP 7.61e−10 79.51
MLR 6.12e−7 31.42
Table 5. Analysis report of the experimental values and the predicted values using MLP and MLR for
functional properties of nano TiO2 coated cotton.
Scientific Reports | (2021) 11:12235 | https://doi.org/10.1038/s41598-021-91733-y 9
Vol.:(0123456789)www.nature.com/scientificreports/
Received: 22 March 2021; Accepted: 31 May 2021
References
1. Zhang, K. et al. Textiles/metal-organic frameworks composites as flexible air filters for efficient particulate matter removal. ACS
Appl. Mater. Interfaces 11, 17368–17374. https://doi.org/10.1021/acsami.9b01734 (2019).
2. Zhang, K. et al. Multifunctional textiles/metal-organic frameworks composites for efficient ultraviolet radiation blocking and noise
reduction. ACS Appl. Mater. Interfaces 12, 55316–55323. https://doi.org/10.1021/acsami.0c18147 (2020).
3. Noman, M. T., Ashraf, M. A. & Ali, A. Synthesis and applications of nano-tio2: A review. Environ. Sci. Pollut. Res. 26, 3262–3291
(2018).
4. Noman, M. T., Ashraf, M. A., Jamshaid, H. & Ali, A. A novel green stabilization of tio2 nanoparticles onto cotton. Fibers Polym.
19, 2268–2277 (2018).
5. Noman, M. T. et al. Sonochemical synthesis of highly crystalline photocatalyst for industrial applications. Ultrasonics 83, 203–213.
https://doi.org/10.1016/j.ultras.2017.06.012 (2018) (Ultrasonic advances applied to materials science).
6. Noman, M. T., Petru, M., Amor, N., Yang, T. & Mansoor, T. Thermophysiological comfort of sonochemically synthesized nano
tio2 coated woven fabrics. Sci. Rep. 10, 1–12 (2020).
7. Ashraf, M., Wiener, J., Farooq, A., Šašková, J. & Noman, M. Development of maghemite glass fibre nanocomposite for adsorptive
removal of methylene blue. Fibers Polym. 19, 1735–1746 (2018).
8. Noman, M. T. et al. In-situ development of highly photocatalytic multifunctional nanocomposites by ultrasonic acoustic method.
Ultrason. Sonochem. 40, 41–56. https://doi.org/10.1016/j.ultsonch.2017.06.026 (2018).
9. Daniel, G. G. Artificial Neural Network, 143–143 (Springer, 2013).
10. Behera, P., Noman, M. T. & Petro, M. Enhanced mechanical properties of eucalyptus-basalt-based hybrid-reinforced cement
composites. Polymers.https://doi.org/10.3390/polym12122837 (2020).
11. Azeem, M., Noman, M. T., Wiener, J., Petru, M. & Louda, P. Structural design of efficient fog collectors: A review. Environ. Technol.
Innov. 20, 101169. https://doi.org/10.1016/j.eti.2020.101169 (2020).
12. Noman, M. T. & Petru, M. Effect of sonication and nano tio2 on thermophysiological comfort properties of woven fabrics. ACS
Omega 5, 11481–11490. https://doi.org/10.1021/acsomega.0c00572 (2020).
13. Malik, S. A., Farooq, A., Gereke, T. & Cherif, C. Prediction of blended yarn evenness and tensile properties by using artificial neural
network and multiple linear regression. Autex Res. J. 16, 43–50. https://doi.org/10.1515/aut-2015-0018 (2016).
14. Malik, S. A., Gereke, T., Farooq, A., Aibibu, D. & Cherif, C. Prediction of yarn crimp in pes multifilament woven barrier fabrics
using artificial neural network. J. Text. Inst. 109, 942–951 (2018).
15. Malik, S. A., Arain, R. A., Khatri, Z., Saleemi, S. & Cherif, C. Neural network modeling and principal component analysis of anti-
bacterial activity of chitosan/agcl-tio 2 colloid treated cotton fabric. Fibers Polym. 16, 1142–1149. https://doi.org/10.1016/j.expth
ermflusci.2013.06.006 (2015).
16. Malik, S. A., Kocaman, R. T., Gereke, T., Aibibu, D. & Cherif, C. Prediction of the porosity of barrier woven fabrics with respect to
material, construction and processing parameters and its relation with air permeability. Fibres Text. East. Eur. 26, 71–79 (2018).
17. Almetwally, A. A., Idrees, H. M. & Hebeish, A. Predicting the tensile properties of cotton/spandex core-spun yarns using artificial
neural network and linear regression models. J. Text. Inst. 105, 1221–1229. https://doi.org/10.1080/00405000.2014.882043 (2014).
18. Farooq, A. et al. Predicting cotton fibre maturity by using artificial neural network. Autex Res. J. 18, 429–433 (2018).
19. Farooq, A., Irshad, F., Azeemi, R. & Iqbal, N. Prognosticating the shade change after softener application using artificial neural
networks. Autex Res. J.https://doi.org/10.2478/aut-2020-0019 (2020).
20. Dashti, M., Derhami, V. & Ekhtiyari, E. Yarn tenacity modeling using artificial neural networks and development of a decision
support system based on genetic algorithms. J. AI Data Mining 2, 73–78. https://doi.org/10.22044/jadm.2014.187 (2014).
21. Furferi, R., Governi, L. & Volpe, Y. Modelling and simulation of an innovative fabric coating process using artificial neural networks.
Text. Res. J. 82, 1282–1294. https://doi.org/10.1177/0040517512436828 (2012).
22. Kanat, Z. E. & Özdil, N. Application of artificial neural network (ann) for the prediction of thermal resistance of knitted fabrics
at different moisture content. J. Text. Inst. 109, 1247–1253. https://doi.org/10.1080/00405000.2017.1423003 (2018).
23. Ribeiro, R. et al. Predicting physical properties of woven fabrics via automated machine learning and textile design and finish-
ing features. In Artificial Intelligence Applications and Innovations (eds Maglogiannis, I. et al.) 244–255 (Springer International
Publishing, Cham***, 2020).
24. Noman, M. T., Petru, M., Militký, J., Azeem, M. & Ashraf, M. A. One-pot sonochemical synthesis of zno nanoparticles for photo-
catalytic applications, modelling and optimization. Materials.https://doi.org/10.3390/ma13010014 (2020).
25. Noman, M. T., Amor, N., Petru, M., Mahmood, A. & Kejzlar, P. Photocatalytic behaviour of zinc oxide nanostructures on surface
activation of polymeric fibres. Polymers.https://doi.org/10.3390/polym13081227 (2021).
26. Taieb, A. H., Mshali, S. & Sakli, F. Predicting fabric drapability property by using an artificial neural network. J. Eng. Fibers
Fabr.https://doi.org/10.1177/155892501801300310 (2018).
27. Kalkanci, M., Sinecen, M. & Kurumer, G. Prediction of dimensional change in finished fabric through artificial neural networks.
Tekstil Ve Konfeksiyon 28, 43–51 (2018).
28. Noman, M., Petru, M., Louda, P. & Kejzlar, P. Woven textiles coated with zinc oxide nanoparticles and their thermophysiological
comfort properties. J. Nat. Fibers 18, 1–14. https://doi.org/10.1080/15440478.2020.1870621 (2021).
29. Khan, S. et al. Fabrication and modelling of the macro-mechanical properties of cross-ply laminated fibre-reinforced polymer
composites using artificial neural network. Adv. Compos. Mater. 28, 409–423 (2019).
30. Erbil, Y., Babaarslan, O. & Ilhami, I. A comparative prediction for tensile properties of ternary blended open-end rotor yarns using
regression and neural network models. J. Text. Inst. 109, 560–568. https://doi.org/10.1080/00405000.2017.1361164 (2018).
31. Malik, S. A. et al. Analysis and prediction of air permeability of woven barrier fabrics with respect to material, fabric construction
and process parameters. Fibers Polym. 18, 2005–2017 (2017).
32. Wang, Z., Di Massimo, C., Tham, M. T. & Julian Morris, A. A procedure for determining the topology of multilayer feedforward
neural networks. Neural Netw. 7, 291–300. https://doi.org/10.1016/0893-6080(94)90023-X (1994).
33. Kalantary, S., Jahani, A. & Jahani, R. MLR and ANN approaches for prediction of synthetic/natural nanofibers diameter in the
environmental and medical applications. Sci. Rep. 10, 1–10 (2020).
34. Xiao, Q. et al. Prediction of pilling of polyester-cotton blended woven fabric using artificial neural network models. J. Eng. Fibers
Fabr.https://doi.org/10.1177/1558925019900152 (2020).
35. Jeon, J. H., Yang, S. S. & Kang, Y. J. Estimation of sound absorption coefficient of layered fibrous material using artificial neural
networks. Appl. Acoust. 169, 107476. https://doi.org/10.1016/j.apacoust.2020.107476 (2020).
36. Doran, E. C. & Sahin, C. The prediction of quality characteristics of cotton/elastane core yarn using artificial neural networks and
support vector machines. Text. Res. J. 90, 1558–1580. https://doi.org/10.1177/0040517519896761 (2020).
37. Jain, A. K., Jianchang, M. & Mohiuddin, K. M. Artificial neural networks: A tutorial. Computer 29, 31–44. https://doi.org/10.
1109/2.485891 (1996).
38. Golnaraghi, S., Zangenehmadar, Z., Moselhi, O. & Alkass, S. Application of artificial neural network(s) in predicting formwork
labour productivity. Adv. Civ. Eng. 2019, 1–11 (2019).
Scientific Reports | (2021) 11:12235 | https://doi.org/10.1038/s41598-021-91733-y 10
Vol:.(1234567890)www.nature.com/scientificreports/
39. Meddeb, A., Amor, N., Abbes, M. & Chebbi, S. A novel approach based on crow search algorithm for solving reactive power
dispatch problem. Energies.https://doi.org/10.3390/en11123321 (2018).
40. Pianosi, F. et al. Sensitivity analysis of environmental models: A systematic review with practical workflow. Environ. Model. Softw.
79, 214–232 (2016).
41. Noman, M. T. & Petru, M. Functional properties of sonochemically synthesized zinc oxide nanoparticles and cotton composites.
Nanomaterials.https://doi.org/10.3390/nano10091661 (2020).
42. Noman, M. T., Amor, N. & Petru, M. Synthesis and applications of zno nanostructures (zonss): A review. Crit. Rev. Solid State
Mater. Sci. 2, 1–44. https://doi.org/10.1080/10408436.2021.1886041 (2021).
43. Noman, M. T., Petru, M., Amor, N. & Louda, P. Thermophysiological comfort of zinc oxide nanoparticles coated woven fabrics.
Sci. Rep. 10, 1–2 (2020).
Author contributions
N.A. and M.T.N. conceived; designed and performed experiments; analysed the results and wrote manuscript.
M.P. analyzed the results, supervised and acquired funding. All of the authors participated in critical analysis
and preparation of the manuscript.
Funding
This work was supported by the Ministry of Education, Youth and Sports of the Czech Republic and the Euro-
pean Union (European Structural and Investment Funds—Operational Programme Research, Development and
Education) in the frames of the project “Modular platform for autonomous chassis of specialized electric vehicles
for freight and equipment transportation”, Reg. No. CZ.02.1.01/0.0/0.0/16_025/0007293.
Competing interests
The authors declare no competing interests.
Additional information
Correspondence and requests for materials should be addressed to N.A.
Reprints and permissions information is available at www.nature.com/reprints.
Publisher’s note Springer Nature remains neutral with regard to jurisdictional claims in published maps and
institutional affiliations.
Open Access This article is licensed under a Creative Commons Attribution 4.0 International
License, which permits use, sharing, adaptation, distribution and reproduction in any medium or
format, as long as you give appropriate credit to the original author(s) and the source, provide a link to the
Creative Commons licence, and indicate if changes were made. The images or other third party material in this
article are included in the article’s Creative Commons licence, unless indicated otherwise in a credit line to the
material. If material is not included in the article’s Creative Commons licence and your intended use is not
permitted by statutory regulation or exceeds the permitted use, you will need to obtain permission directly from
the copyright holder. To view a copy of this licence, visit http://creativecommons.org/licenses/by/4.0/.
© The Author(s) 2021
Scientific Reports | (2021) 11:12235 | https://doi.org/10.1038/s41598-021-91733-y 11
Vol.:(0123456789)You can also read