Prediction of premature all-cause mortality in patients receiving peritoneal dialysis using modified artificial neural networks - Aging-US
←
→
Page content transcription
If your browser does not render page correctly, please read the page content below
www.aging-us.com                                                              AGING 2021, Vol. 13, No. 10
                                                                                                      Research Paper
Prediction of premature all-cause mortality in patients receiving
peritoneal dialysis using modified artificial neural networks
Qiongxiu Zhou1,*, Xiaohan You2,*, Haiyan Dong3, Zhe Lin1, Yanling Shi1, Zhen Su1, Rongrong Shao1,
Chaosheng Chen1, Ji Zhang1
1
 Department of Nephrology, The First Affiliated Hospital of Wenzhou Medical University, Wenzhou, Zhejiang, P.R.
China
2
 Department of Nephrology, The First Affiliated Hospital of Soochow University, Jiangsu, P.R. China
3
 Department of Nephrology, Longgang Renmin Hospital, Wenzhou, Zhejiang, P.R. China
*Equal contribution

Correspondence to: Ji Zhang; email: zhji0426@hotmail.com, https://orcid.org/0000-0003-4404-7524
Keywords: all-cause mortality, peritoneal dialysis, artificial neural networks, age, risk factors
Received: January 6, 2021            Accepted: March 27, 2021               Published: May 13, 2021

Copyright: © 2021 Zhou et al. This is an open access article distributed under the terms of the Creative Commons Attribution
License (CC BY 3.0), which permits unrestricted use, distribution, and reproduction in any medium, provided the original
author and source are credited.

ABSTRACT

Premature all-cause mortality is high in patients receiving peritoneal dialysis (PD). The accurate and early
prediction of mortality is critical and difficult. Three prediction models, the logistic regression (LR) model,
artificial neural network (ANN) classic model and a new structured ANN model (ANN mixed model), were
constructed and evaluated using a receiver operating characteristic (ROC) curve analysis. The permutation
feature importance was used to interpret the important features in the ANN models. Eight hundred fifty-nine
patients were enrolled in the study. The LR model performed slightly better than the other two ANN models on
the test dataset; however, in the total dataset, the ANN models fit much better. The ANN mixed model showed
the best prediction performance, with area under the ROC curves (AUROCs) of 0.8 and 0.79 for the 6-month and
12-month datasets. Our study showed that age, diastolic blood pressure (DBP), and low-density lipoprotein
cholesterol (LDL-c) levels were common risk factors for premature mortality in patients receiving PD. Our ANN
mixed model had incomparable advantages in fitting the overall data characteristics, and age is a steady risk
factor for premature mortality in patients undergoing PD. Otherwise, DBP and LDL-c levels should receive more
attention for all-cause mortality during follow-up.

INTRODUCTION                                                      prediction of the risk of premature mortality in patients
                                                                  receiving PD is still difficult to achieve.
The incidence and prevalence of end-stage renal disease
(ESRD) has increased continually worldwide, and                   Barrett et al. attempted to predict early death in patients
patients with ESRD are at higher risk of morbidity and            treated with dialysis using a scoring system based on a
mortality [1, 2]. Peritoneal dialysis (PD) is an                  logistic regression (LR) model, but the authors found it
established and cost-effective therapy for patients with          impossible to accurately predict early death [7].
ESRD [3, 4]. Although the mortality rates of patients             Although LR models are the most widely used methods
receiving PD have decreased, their long-term survival             for predicting binary medical outcomes, they are
remains poor [1, 5, 6]. Patients with a high risk of              generalized linear models that require an assumption of
premature mortality who are undergoing PD should be               a linear relationship between the transformed response
managed with active treatment strategies to improve               in terms of the link function and the explanatory
long-term survival. However, an early and accurate                variables, which is not always suitable for medical

www.aging-us.com                                         14170                                                      AGING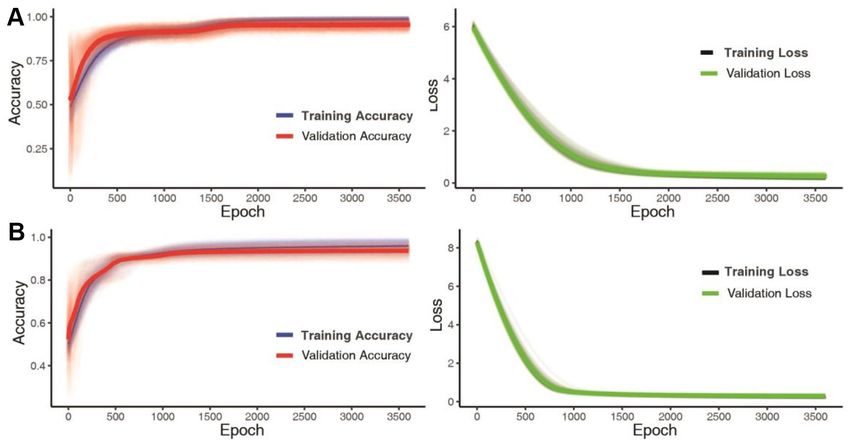
datasets [8–10]. Artificial neural networks (ANNs), a            was all-cause mortality. We collected the data at the
type of machine learning algorithm, have become                  beginning of PD and during the follow-up period. Three
popular and helpful models for medical predictions,              datasets, namely, the 0-month, 6-month, and 12-month
including nephrology [11]. ANNs automatically                    datasets, were collected, and the 0-month dataset (also
recognize complex nonlinear relationships and have               called the total dataset) was used for training the
become relatively competitive with conventional                  prediction models. Missing values were imputed with
regression and statistical models in terms of usefulness         values from the nearest three months. All included
[12]. However, the structure of an ANN requires an               numerical variables were normalized by the Z-score.
elaborate organization and adjustment to obtain the best
performance.                                                     Construction of prediction models

Thus, the purpose of this study was to construct early           The TensorFlow platform (https://www.tensorflow.org/)
prediction models based on the LR model and ANN                  was used for training the ANN models [13]. We
model for all-cause premature mortality and compare              constructed two different types of ANN models. One is
the performance of the constructed models to select the          called the ANN classic model, which was built using a
most accurate models to predict the premature all-cause          single neural network with 12 hidden layers. The
mortality in patients receiving PD.                              numerical variables and categorical variables were input
                                                                 into the neural network simultaneously (Supplementary
MATERIALS AND METHODS                                            Figure 1). The other is called the ANN mixed model.
                                                                 Two different sub-neural networks were built for the
Study population                                                 numerical variables and categorical variables with nine
                                                                 hidden layers and eleven hidden layers, respectively.
Data from 1241 patients with ESRD who initially                  The two sub-networks were then merged into a new
started PD between Jan 2006 and Dec 2019 at the First            neural network with two hidden layers for predicting the
Affiliated Hospital of Wenzhou University were                   outcomes (Supplementary Figure 1). The hyper-
collected and reviewed. The inclusion criteria were as           parameters of the ANN models were adjusted during the
follows: 1. older than 18 years and 2. routine follow-up         study. Finally, we set the following parameters for the
for more than twelve months in our PD center. The                ANN models: epoch = 3500, batch size = 220, iteration
exclusion criteria were as follows: 1. a history of              = 0.0001, and L1 and L2 regularization penalties. The
continuous hemodialysis for more than six months                 multivariable logistic model was built using the Scikit-
before continuous ambulatory peritoneal dialysis                 learn platform [14].
(CAPD) or a combination of continuous hemodialysis
and CAPD, 2. a history of kidney transplantation, and 3.         We selected the 0-month dataset to train the ANN
missing important data. Patients who met the above               models and logistic models and construct an early
criteria were eventually enrolled in this study. The study       prediction model. The full 0-month dataset was
protocol was reviewed and approved by the Ethics                 randomly divided into three datasets: a training dataset
Committee of the First Affiliated Hospital of Wenzhou            (63.2%), validation dataset (48%), and test dataset
University before collecting any data.                           (20%). The training dataset was used to train the ANN
                                                                 models and logistic models. The validation dataset
Data collection and preparation                                  displayed 31.2% overlap with the training dataset and
                                                                 was used to control overfitting during training of the
The following clinical characteristics were collected at         ANN model. The test dataset did not have any
the initiation of CAPD as predictor variables:                   overlapping data with the training dataset, and the
demographic variables, including sex, age and                    validation dataset was used to assess the performance of
complications such as chronic heart disease (CHD),               the ANN models and logistic models (Supplementary
diabetes mellitus (DM), and malignancy; and laboratory           Figure 2).
variables, including systolic blood pressure (SBP,
mmHg), diastolic blood pressure (DBP, mmHg), total               Evaluation of the performance of the ANN and
triglycerides (Tg), total cholesterol (Tc), low-density          logistic models
lipoprotein     cholesterol   (LDL-c),      high-density
lipoprotein cholesterol (HDL-c), serum albumin (g/dL),           We calculated the predictive outcomes of the ANN and
hemoglobin (g/dL), blood urea nitrogen (BUN, mg/dL),             logistic models using the test dataset and the 0-month,
serum creatinine (Scr, µmol/L), serum phosphorus (P,             6-month, and 12-month datasets during the construction
mmol/l), intact parathyroid hormone (iPTH, pg/ml), and           of every model. Then, the areas under the receiver
Kt/V. The causes of premature death were recorded                operating characteristic (ROC) curves (AUROCs) were
during follow-up, and the primary endpoint of the study          calculated to filter models with extremely poor

www.aging-us.com                                         14171                                                  AGING
performance using a threshold of 0.6, and ROC curves steadily significant risk factor for the primary outcome. In
were plotted to visualize the relationship between the addition, the complication of CHD (model 0: β (se)
true positive rate (TPR) and false positive rate (FPR) at =0.578 (0.272), p-value = 0.03; model 1: β (se) = 0.479
different cutoff values. We also calculated the accuracy, (0.276), p-value = 0.08; model 2: β (se) = 0.462 (0.274),
F1 score, precision, and recall values at a fixed p-value = 0.09), serum albumin levels (model 0: β (se) = -
threshold value (0.2) to evaluate the performance of the 0.041 (0.029), p-value = 0.2; model 1: β (se) = -0.1
selected models in predicting positive cases (dead (0.033), p-value = 0.003; model 2: β (se) = -0.117 (0.034),
patients) or negative cases (surviving patients) using the p-value = 0.001), and LDL-c levels (model 0: β (se) =
Scikit-learn application [15]. A phi coefficient analysis 0.514 (0.309), p-value = 0.1; model 1: β (se) = 0.87
was performed to measure the association between the (0.412), p-value = 0.04; model 2: β (se) = 0.791 (0.36), p-
predicted and true outcomes [16]. The permutation value = 0.03) were also significantly associated with the
feature importance, which is defined as the decrease in primary outcome in the different datasets (Table 2).
the score of a model when a single feature value is
randomly shuffled [17], was calculated to evaluate the We constructed 100 ANN classic models, 100 ANN
significance of the included variables. mixed models, and 100 logistic models using the 0-
month dataset. The accuracy and loss function values
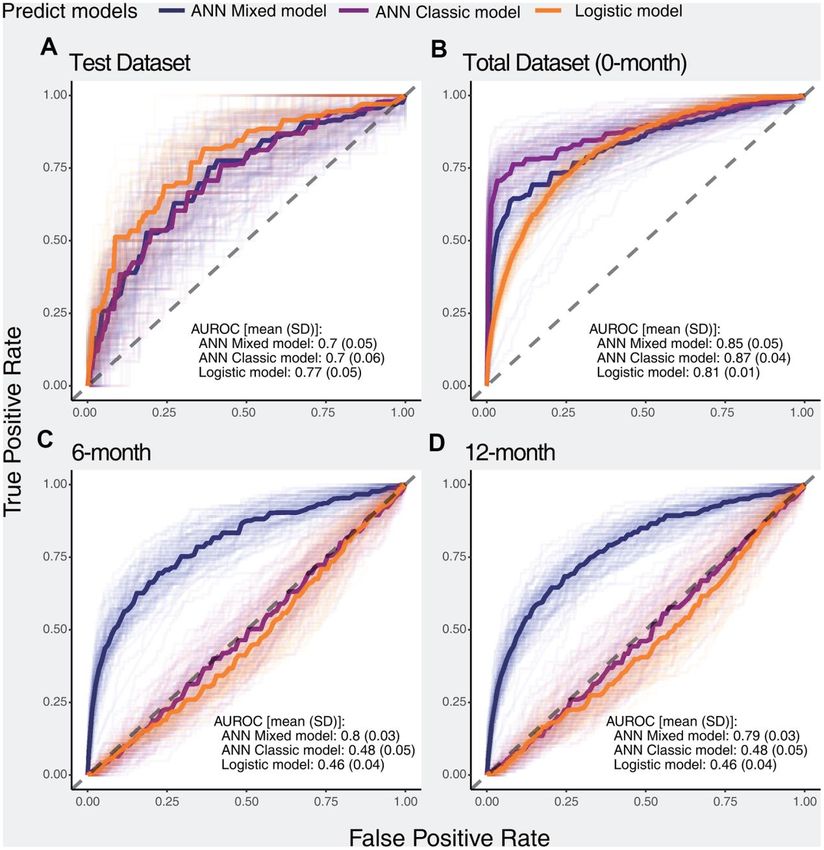
Statistical analysis per epoch are displayed in Supplementary Figure 4, and
slight overfitting was observed in both the ANN classic
The numerical data are presented as the means [standard model and ANN mixed model. ANN models with poor
deviations (SD)] or the medians [interquartile ranges performance (i.e., AUROC values of less than 0.6) were
(IQRs)], and differences between the groups were filtered. According to the ROC curves, the logistic
examined using variance analysis or the Kruskal-Wallis model showed better performance than the ANN
rank test. Categorical data are presented as counts with models on the test dataset, but the ANN models fit more
percentages (%), and differences between the groups perfectly in the total dataset. Importantly, in the 6-
were analyzed using Pearson’s chi-square test. month and 12-month datasets, the ANN mixed model
Multivariable LR models based on the 0-month, 6- showed excellent performance compared with both the
month, and 12-month datasets were built to evaluate the ANN classic model and logistic model, while the ANN
effects of the included variables on the primary classic model and logistic model showed similar
outcomes. All reported p-values are two-tailed, and p- performance outcomes (Figure 1).
values less than 0.05 were considered to indicate a
statistically significant difference. Python (version 3.8) We calculated the accuracy, F1 score, precision, and
[18] and R software (version 4.0.2, R Core Team) [19] recall of positive and negative predictions using a fixed
and embedded packages were used to prepare the threshold of 0.2 for the test datasets, total dataset (0-
datasets, perform the analyses, and create the plots [20– month dataset), 6-month dataset, and 12-month dataset.
24]. P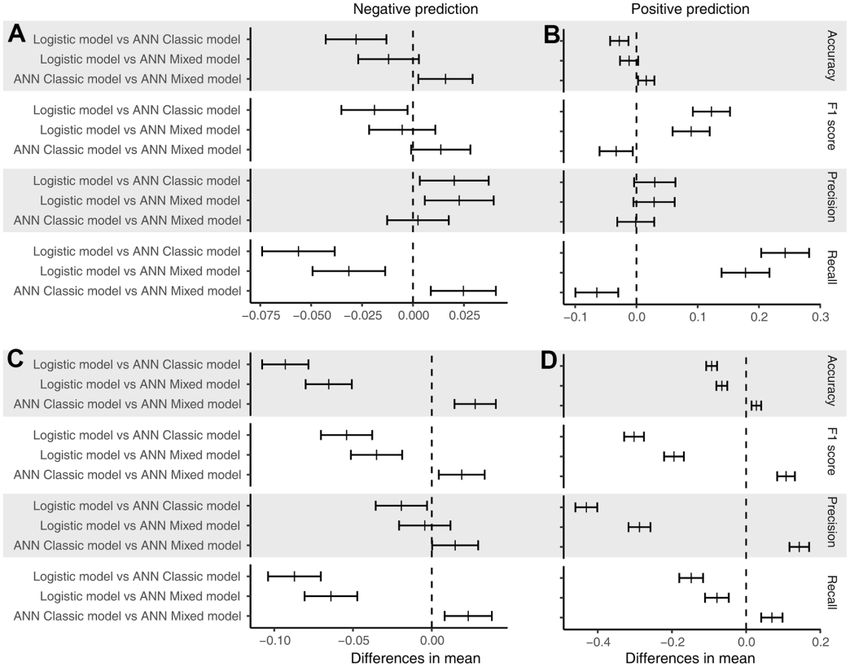
Table 1. Baseline characteristics of the included patients with CAPD.
                                                                All-cause premature mortality
Characteristics                                                                                                        p-value
                                                           No                                 Yes
Case (n)                                                   777                                82
Age (years, median [IQR])                           48.0 [38.0, 58.0]                  63.0 [54.0, 70.0]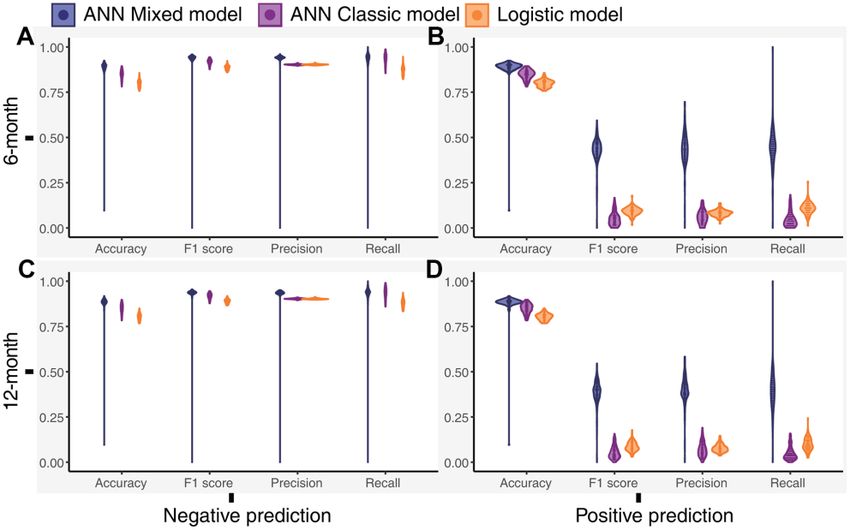
Tc                  -0.134 (0.272)            0.6           -0.532 (0.364)              0.1           -0.554 (0.289)        0.06
Tg                  -0.177 (0.192)            0.4             0.2 (0.216)               0.4           0.282 (0.173)          0.1
SBP                 0.012 (0.007)             0.1           0.014 (0.009)               0.1           0.015 (0.009)          0.1
Sex                 0.293 (0.291)             0.3           0.421 (0.318)               0.2            0.56 (0.321)         0.08
Kt/V                -0.259 (0.313)            0.4              0 (0.376)                 1            0.124 (0.395)          0.8
Model 0: 0-month datasets; Model 1: 6-month datasets; Model 2: 12-month datasets; iPTH: intact parathyroid hormone; SBP:
systolic blood pressure; DBP: diastolic blood pressure; MAP: mean arterial pressure; BMI: body mass index; RAAS: renin–
angiotensin–aldosterone system agents; CCBs: calcium channel blockers.

Figure 1. ROC curves of selected models for predicting the primary outcome in different datasets. The dark solid lines indicate
the median curve of the three types of models (ANN mixed model, ANN classic model, and logistic model). (A) Performance of selected
models in the test dataset, (B) Performance of selected models in the total dataset, (C) Performance of selected models in the 6-month
dataset, (D) Performance of selected models in the 12-month dataset.

www.aging-us.com                                             14174                                                          AGING
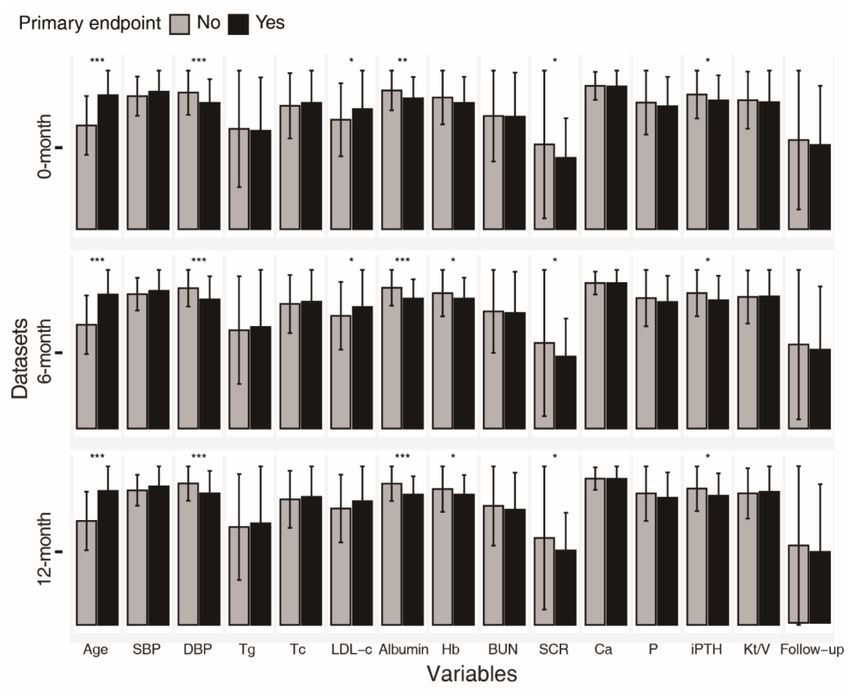
Figure 2. Post hoc test of performance. (A) Performance of the models for the negative prediction in the test dataset; (B) performance
of the models for the positive prediction in the test dataset; (C) performance of the models for the negative prediction in the total dataset;
and (D) performance of the models for the positive prediction in the total dataset. The short bar indicates the difference in the mean value
with a 95% confidence interval.

Figure 3. Distribution of the performance outcomes of the models for the 6-month and 12-month datasets. (A) Performance of
the models for the negative prediction in the 6-month dataset, (B) Performance of the models for the positive prediction in the 6-month
dataset, (C) Performance of the models for the negative prediction in the 12-month dataset, (D) Performance of the models for the positive
prediction in the 12-month dataset.

www.aging-us.com                                                 14175                                                              AGING
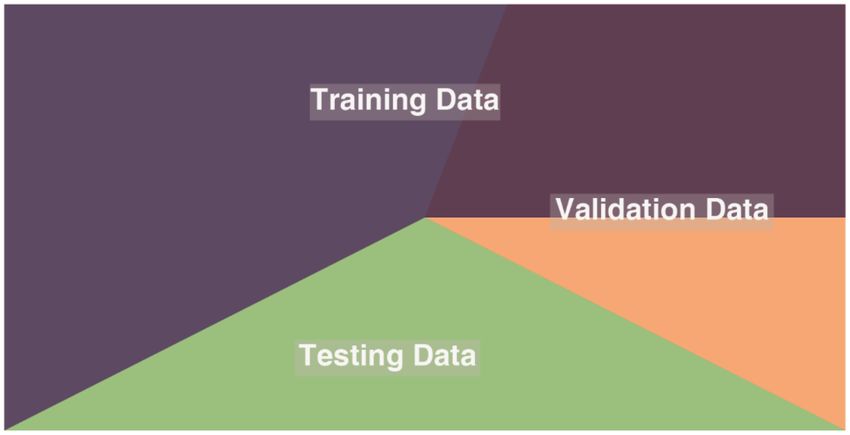
Table 3. Performance of the models in the follow-up datasets.
                        Negative prediction                                   Positive prediction
Performance     ANN mixed ANN classic Logistic             p-value    ANN mixed      ANN classic     Logistic   p-value
                  model         model       model                       model           model         model
6-month
                                                0.80                                                   0.80
Accuracy         0.89 (0.07)    0.85 (0.03)
affects the clinical characteristics of patients receiving and continuous variables simultaneously [25, 31–33].
PD, which potentially affected the prediction accuracy Our study showed that the ANN classic and LR
of our model. models, which were similar to the classic studies,
were inaccurate in the 6-month and 12-month
The classic studies constructing prediction models or datasets. Burrett et al. considered that differences in
identifying risk factors mostly included categorical the populations studied may have contributed to the
Figure 4. Permutation feature importance for the ANN models in the total dataset (0-month), 6-month dataset and
12-month dataset. Higher positive values indicated greater importance of the model, and negative values may indicate that the feature is
worse than noise.
www.aging-us.com 14177 AGINGloss of predictive power for the prognostic score [7]. sample size, which may contribute to overfitting and
We assumed that the significance of the scalar was affect generalization performance. Although L1 and L2
different between categorical variables and continuous regularization were used during ANN training and
variables. The simultaneous inclusion of categorical follow-up datasets were used for external validation, the
and continuous variables in an identical vector space initial PD data must still be collected from other centers
for fitting a model may increase overfitting and for external verification. Second, a few patients
adversely affect the generalization performance. receiving PD withdrew during follow-up, and these
Based on our results, the construction of separate patients may have died at home or in other departments
vector spaces for categorical and continuous variables but were not categorized into the premature mortality
in a model significantly improved the generalization group, resulting in an endpoint determination bias
performance. affecting the accuracy of our model. Third, the
proportion of patients with premature all-cause
An ANN is a black-box model, and it does not easily mortality is small in our cohort, leading to a significant
display the relationship between features and outcomes imbalance in classification, which affects the detection
[34]. We used a permutation feature importance power of our model.
analysis, which is used for interpreting the importance
of variables in a model [35–37], to identify the In summary, our study compared the value of traditional
important characteristics contributing to premature logistic models and ANNs in predicting all-cause
death. Importantly, age, DBP, and LDL-c levels were mortality in patients treated with PD and showed that
the top three important variables in the ANN mixed ANNs had incomparable advantages in fitting the
model. The LR models based on the 6-month and 12- overall data characteristics. Thus, a highly precise ANN
month datasets also showed that DBP and LDL-c levels model for the early prediction of premature all-cause
were independent risk factors for premature all-cause mortality in patients receiving PD was established. Our
death. Sakacı et al. also found that age is an independent study also showed the importance of DBP and LDL-c
risk factor for mortality in patients undergoing dialysis levels in predicting the premature all-cause mortality of
[38]. Although age is an unmodifiable variable, some patients receiving PD; thus, these factors should receive
age-related variables, such as nutritional status, can still more attention during follow-up.
be improved by better management [39]. Previous
studies have mainly focused on the significance of SBP Abbreviations
in patients with ESRD [40]. Our research identified
DBP as a crucial risk factor for predicting death in PD: peritoneal dialysis; LR: logistic regression; ANN:
patients undergoing PD and one of the most valuable artificial neural network; ROC: receiver operating
variables in the ANN model. Lip et al. observed a characteristic; AUROC: area under the receiver
reverse J-shaped relationship between DBP and death operating characteristic curve; DBP: diastolic blood
from cardiovascular events. Cardiovascular death was pressure; LDL-c: low-density lipoprotein cholesterol;
also the primary factor contributing to premature ESRD: end-stage renal disease; CAPD: continuous
mortality in our patients receiving PD [31, 41]. ambulatory peritoneal dialysis; CHD: chronic heart
Therefore, DBP should receive more attention in disease; DM: diabetes mellitus; SBP: systolic blood
patients receiving PD during clinical practice. Lowering pressure; Tg: total triglycerides; Tc: total cholesterol;
LDL-c levels can significantly improve the prognosis of HDL-c: high-density lipoprotein cholesterol; BUN:
patients with chronic kidney disease (CKD) stage 1-4, blood urea nitrogen; Scr: serum creatinine; iPTH: intact
but researchers have not clearly determined whether it parathyroid hormone; TPR: true positive rate; FPR:
can improve the prognosis of patients with CKD5 or false positive rate; SD: standard deviation; IQR:
CKD5d [42–44]. Strict lipid control may also cause interquartile range.
malnutrition in patients receiving dialysis, which is an
important factor contributing to the death of patients AUTHOR CONTRIBUTIONS
receiving dialysis [45, 46]. LDL-c levels were closely
related to the premature mortality of patients treated Research idea and study design: QXZ, XHY and JZ;
with PD in our study. As the life span of patients treated data acquisition: QXZ, XHY, HYD and ZL; data
with dialysis increases, the effect of dyslipidemia on analysis/interpretation: QXZ, XHY, YLS and JZ;
patients receiving PD cannot be ignored. Therefore, statistical analysis: JZ; and supervision or mentorship:
further studies of the role of lipids in patients ZS, CSC, and RRS. Each author contributed important
undergoing PD are still necessary. intellectual content during manuscript drafting and
accepts accountability for the overall work by ensuring
Our research had some limitations. First, the study is that questions pertaining to the accuracy or integrity of
based on a single center and a relatively insufficient any portion of the work are appropriately investigated
www.aging-us.com 14178 AGINGand resolved. All authors have read and approved the mortality in end-stage renal disease. J Am Soc Nephrol.
manuscript. 1998; 9:267–76.
https://doi.org/10.1681/ASN.V92267
ACKNOWLEDGMENTS PMID:9527403
7. Barrett BJ, Parfrey PS, Morgan J, Barré P, Fine A,
The authors would like to thank their colleagues in the Goldstein MB, Handa SP, Jindal KK, Kjellstrand CM,
Department of Nephrology at the First Affiliated
Levin A, Mandin H, Muirhead N, Richardson RM.
Hospital of Wenzhou Medical University for their
Prediction of early death in end-stage renal disease
invaluable support and selfless assistance during this
patients starting dialysis. Am J Kidney Dis. 1997;
study.
29:214–22.
https://doi.org/10.1016/s0272-6386(97)90032-9
CONFLICTS OF INTEREST PMID:9016892
The authors declare that they have no conflicts of 8. Tolles J, Meurer WJ. Logistic Regression: Relating
interest. Patient Characteristics to Outcomes. JAMA. 2016;
316:533–34.
FUNDING https://doi.org/10.1001/jama.2016.7653
PMID:27483067
This study was supported by grants from the Wenzhou 9. Hoffman J. Chapter 33 - Logistic Regression. Basic
Committee of Science and Technology of China Biostatistics for Medical and Biomedical Practitioners,
(2020Y0611). Second Edition. Academic Press. 2019; 581–89.
https://doi.org/10.1016/B978-0-12-817084-7.00033-4
REFERENCES
10. Boateng EY, Abaye DA. A Review of the Logistic
1. Kendrick J, Teitelbaum I. Strategies for improving long- Regression Model with Emphasis on Medical Research.
term survival in peritoneal dialysis patients. Clin J Am Journal of Data Analysis and Information Processing.
Soc Nephrol. 2010; 5:1123–31. 2019; 7:190–207.
https://doi.org/10.2215/CJN.04300709 https://doi.org/10.4236/jdaip.2019.74012
PMID:20430945 11. Niel O, Bastard P. Artificial Intelligence in Nephrology:
2. Collins AJ, Foley RN, Gilbertson DT, Chen SC. The state Core Concepts, Clinical Applications, and Perspectives.
of chronic kidney disease, ESRD, and morbidity and Am J Kidney Dis. 2019; 74:803–10.
mortality in the first year of dialysis. Clin J Am Soc https://doi.org/10.1053/j.ajkd.2019.05.020
Nephrol. 2009 (Suppl 1); 4:S5–11. PMID:31451330
https://doi.org/10.2215/CJN.05980809 12. Dave VS, Dutta K. Neural network based models for
PMID:19996006 software effort estimation: a review. Artif Intell Rev.
3. O’Hare AM. The management of older adults with a 2014; 42:295–307.
low eGFR: moving toward an individualized approach. https://doi.org/10.1007/s10462-012-9339-x
Am J Kidney Dis. 2009; 53:925–27. 13. Jia Y, Abadi M, Agarwal A, Barham P, Brevdo E, Chen Z,
https://doi.org/10.1053/j.ajkd.2009.02.013 Citro C, Corrado GS, Davis A, Dean J, Devin M,
PMID:19463760 Ghemawat S, Goodfellow I, et al. TensorFlow: Large-
4. Karopadi AN, Mason G, Rettore E, Ronco C. The role of Scale Machine Learning on Heterogeneous Systems.
economies of scale in the cost of dialysis across the 2015. https://www.tensorflow.org/
world: a macroeconomic perspective. Nephrol Dial 14. Pedregosa F, Varoquaux G, Gramfort A, Michel V,
Transplant. 2014; 29:885–92. Thirion B, Grisel O, Blondel M, Prettenhofer P, Weiss R,
https://doi.org/10.1093/ndt/gft528 Dubourg V, Vanderplas J, Passos A, Cournapeau D, et
PMID:24516226 al. Scikit-learn: Machine Learning in Python. J Mach
5. Bloembergen WE, Port FK, Mauger EA, Wolfe RA. A Learn Res. 2011; 12:2825–30.
comparison of cause of death between patients 15. Jeon JP, Kim C, Oh BD, Kim SJ, Kim YS. Prediction of
treated with hemodialysis and peritoneal dialysis. J Am persistent hemodynamic depression after carotid
Soc Nephrol. 1995; 6:184–91. angioplasty and stenting using artificial neural network
https://doi.org/10.1681/ASN.V62184 PMID:7579083 model. Clin Neurol Neurosurg. 2018; 164:127–31.
6. Foley RN, Parfrey PS, Harnett JD, Kent GM, O’Dea R, https://doi.org/10.1016/j.clineuro.2017.12.005
Murray DC, Barre PE. Mode of dialysis therapy and PMID:29223792
www.aging-us.com 14179 AGING16. Lüdecke D. sjstats: Statistical Functions for Regression in Proceedings of Machine Learning Research.
Models (Version 0.18.0). 2020. 38:192–204. http://proceedings.mlr.press/v38/
choromanska15.html
17. Breiman L. Random forests. Machine learning. 2001;
45:5–32. 30. Papadrakakis M, Lagaros ND, Tsompanakis Y. Structural
https://doi.org/10.1023/A:1010933404324 optimization using evolution strategies and neural
networks. Comput Methods Appl Mech Eng. 1998;
18. Van Rossum G, Drake FL Jr. Python tutorial: Centrum
voor Wiskunde en Informatica Amsterdam, The 156:309–33.
Netherlands. 1995. https://doi.org/10.1016/S0045-7825(97)00215-6
31. Khan A, Rigatto C, Verrelli M, Komenda P, Mojica J,
19. Team RC. R: A language and environment for statistical
computing. R Foundation for Statistical Computing, Roberts D, Sood MM. High rates of mortality and
technique failure in peritoneal dialysis patients after
Vienna, Austria. 2020. http://www.r-project.org/
index.html critical illness. Perit Dial Int. 2012; 32:29–36.
https://doi.org/10.3747/pdi.2010.00300
20. Wickham H. ggplot2: Elegant Graphics for Data PMID:21719686
Analysis: Springer-Verlag New York. 2009.
https://doi.org/10.1007/978-0-387-98141-3 32. Jeong JC, Kim S, Kim KP, Yi Y, Ahn SY, Jin DC, Chin HJ,
Chae DW, Na KY. Changes in mortality hazard of the
21. Yoshida K. tableone: Create ‘Table 1’ to Describe Korean long-term dialysis population: The
Baseline Characteristics. 2019. dependencies of time and modality switch. Perit Dial
22. McKinney W. Data structures for statistical computing Int. 2021; 41:69–78.
in python. Proceedings of the 9th Python in Science https://doi.org/10.1177/0896860820915024
Conference. 2010; 56–61. PMID:32319853
https://doi.org/10.25080/Majora-92bf1922-00a 33. Ravel VA, Streja E, Mehrotra R, Sim JJ, Harley K, Ayus
23. Oliphant T. NumPy: A guide to NumPy. USA: Trelgol JC, Amin AN, Brunelli SM, Kovesdy CP, Kalantar-Zadeh
Publishing. 2006. K, Rhee CM. Serum sodium and mortality in a national
peritoneal dialysis cohort. Nephrol Dial Transplant.
24. Robin X, Turck N, Hainard A, Tiberti N, Lisacek F, 2017; 32:1224–33.
Sanchez JC, Müller M. pROC: an open-source package https://doi.org/10.1093/ndt/gfw254
for R and S+ to analyze and compare ROC curves. BMC PMID:27358272
Bioinformatics. 2011; 12:77.
https://doi.org/10.1186/1471-2105-12-77 34. Zhang Z, Beck MW, Winkler DA, Huang B, Sibanda W,
PMID:21414208 Goyal H, and written on behalf of AME Big-Data Clinical
Trial Collaborative Group. Opening the black box of
25. Fried LF, Bernardini J, Johnston JR, Piraino B. Peritonitis neural networks: methods for interpreting neural
influences mortality in peritoneal dialysis patients. J network models in clinical applications. Ann Transl
Am Soc Nephrol. 1996; 7:2176–82. Med. 2018; 6:216.
PMID:8915978 https://doi.org/10.21037/atm.2018.05.32
26. Han SS, Park JY, Kang S, Kim KH, Ryu DR, Kim H, Joo PMID:30023379
KW, Lim CS, Kim YS, Kim DK. Dialysis Modality and 35. Deng H, Runger G, Tuv E. Bias of importance measures
Mortality in the Elderly: A Meta-Analysis. Clin J Am Soc for multi-valued attributes and solutions. ICANN. 2011;
Nephrol. 2015; 10:983–93. 6792:293–300.
https://doi.org/10.2215/CJN.05160514 https://doi.org/10.1007/978-3-642-21738-8_38
PMID:25941194
36. Altmann A, Toloşi L, Sander O, Lengauer T.
27. Hastie T, Tibshirani R, Friedman J. The elements of
Permutation importance: a corrected feature
statistical learning: data mining, inference, and
importance measure. Bioinformatics. 2010;
prediction. Springer Series in Statistics. 2009.
26:1340–47.
https://doi.org/10.1007/978-0-387-84858-7
https://doi.org/10.1093/bioinformatics/btq134
28. Feng J, Xu H, Mannor S, Yan S. Robust logistic PMID:20385727
regression and classification. Adv Neural Inf Process
37. Yang JB, Shen KQ, Ong CJ, Li XP. Feature selection for
Syst. 2014; 1:253–61.
MLP neural network: the use of random permutation
29. Choromanska A, Henaff M, Mathieu M, Arous GB, of probabilistic outputs. IEEE Trans Neural Netw. 2009;
LeCun Y. The loss surfaces of multilayer networks. 20:1911–22.
Proceedings of the Eighteenth International https://doi.org/10.1109/TNN.2009.2032543
Conference on Artificial Intelligence and Statistics, PMID:19822474
www.aging-us.com 14180 AGING38. Sakacı T, Ahbap E, Koc Y, Basturk T, Ucar ZA, Sınangıl A, 43. Reith C, Staplin N, Herrington WG, Stevens W,
Sevınc M, Kara E, Akgol C, Kayalar AO, Caglayan FB, Emberson J, Haynes R, Mafham M, Armitage J, Cass A,
Sahutoglu T, Ünsal A. Clinical outcomes and mortality Craig JC, Jiang L, Pedersen T, Baigent C, Landray MJ,
in elderly peritoneal dialysis patients. Clinics (Sao and SHARP Collaborative Group. Effect on non-vascular
Paulo). 2015; 70:363–68. outcomes of lowering LDL cholesterol in patients with
https://doi.org/10.6061/clinics/2015(05)10 chronic kidney disease: results from the Study of Heart
PMID:26039954 and Renal Protection. BMC Nephrol. 2017; 18:147.
https://doi.org/10.1186/s12882-017-0545-2
39. Johansson L. Nutrition in Older Adults on Peritoneal
PMID:28460629
Dialysis. Perit Dial Int. 2015; 35:655–58.
https://doi.org/10.3747/pdi.2014.00343 44. Baigent C, Landray MJ, Reith C, Emberson J, Wheeler
PMID:26702008 DC, Tomson C, Wanner C, Krane V, Cass A, Craig J, Neal
B, Jiang L, Hooi LS, et al, and SHARP Investigators. The
40. Qureshi S, Lorch R, Navaneethan SD. Blood Pressure effects of lowering LDL cholesterol with simvastatin
Parameters and their Associations with Death in plus ezetimibe in patients with chronic kidney disease
Patients with Chronic Kidney Disease. Curr Hypertens (Study of Heart and Renal Protection): a randomised
Rep. 2017; 19:92. placebo-controlled trial. Lancet. 2011; 377:2181–92.
https://doi.org/10.1007/s11906-017-0790-6 https://doi.org/10.1016/S0140-6736(11)60739-3
PMID:29046987 PMID:21663949
41. Gu W, Yi C, Yu X, Yang X. Metabolic Syndrome and 45. Gencer F, Yıldıran H, Erten Y. Association of
Mortality in Continuous Ambulatory Peritoneal Dialysis Malnutrition Inflammation Score with
Patients: A 5-Year Prospective Cohort Study. Kidney Anthropometric Parameters, Depression, and
Blood Press Res. 2019; 44:1026–35. Quality of Life in Hemodialysis Patients. J Am Coll
https://doi.org/10.1159/000502145 Nutr. 2019; 38:457–62.
PMID:31522168 https://doi.org/10.1080/07315724.2018.1550371
42. Ferro CJ, Mark PB, Kanbay M, Sarafidis P, Heine GH, PMID:30589395
Rossignol P, Massy ZA, Mallamaci F, Valdivielso JM, 46. Hara H, Nakamura Y, Hatano M, Iwashita T, Shimizu T,
Malyszko J, Verhaar MC, Ekart R, Vanholder R, et al. Ogawa T, Kanozawa K, Hasegawa H. Protein Energy
Lipid management in patients with chronic kidney Wasting and Sarcopenia in Dialysis Patients. Contrib
disease. Nat Rev Nephrol. 2018; 14:727–49. Nephrol. 2018; 196:243–49.
https://doi.org/10.1038/s41581-018-0072-9 https://doi.org/10.1159/000485729
PMID:30361677 PMID:30041234
www.aging-us.com 14181 AGINGSUPPLEMENTARY MATERIALS
Supplementary Figures
Supplementary Figure 1. Schematic diagram of the two types of neural networks.
www.aging-us.com 14182 AGINGSupplementary Figure 2. Diagram of the dataset segmentation process during model training. The 0-month dataset (also called the total dataset) was used for training the ANN and logistic models and separated into three datasets for model training. Training dataset: blue plus purple; validation dataset: purple plus orange; test dataset: green. Supplementary Figure 3. The different mean values of numerical variables between surviving and non-surviving patients. The short bar indicates the SD. *, **, and *** indicate p-values less than 0.05, 0.01, and 0.001, respectively. www.aging-us.com 14183 AGING
Supplementary Figure 4. Changes in the accuracy and loss function values during the training process. (A) ANN classic models;
(B) ANN mixed models.

www.aging-us.com                                         14184                                                      AGING
You can also read