Ektacytometry Analysis of Post-splenectomy Red Blood Cell Properties Identifies Cell Membrane Stability Test as a Novel Biomarker of Membrane ...
←
→
Page content transcription
If your browser does not render page correctly, please read the page content below
ORIGINAL RESEARCH
                                                                                                                                                 published: 25 March 2021
                                                                                                                                          doi: 10.3389/fphys.2021.641384

                                                Ektacytometry Analysis of
                                                Post-splenectomy Red Blood Cell
                                                Properties Identifies Cell Membrane
                                                Stability Test as a Novel Biomarker of
                                                Membrane Health in Hereditary
                                                Spherocytosis
                                                M. C. Berrevoets 1 , J. Bos 1 , R. Huisjes 1 , T. H. Merkx 1 , B. A. van Oirschot 1 ,
                                                W. W. van Solinge 1 , J. W. Verweij 2 , M. Y. A. Lindeboom 2 , E. J. van Beers 3 , M. Bartels 3† ,
                                                R. van Wijk 1† and M. A. E. Rab 1,3*
                                                1
                                                 Central Diagnostic Laboratory-Research, University Medical Center Utrecht, Utrecht University, Utrecht, Netherlands,
                             Edited by:         2
                                                 Department of Pediatric Surgery, University Medical Center Utrecht, Utrecht University, Utrecht, Netherlands, 3 Van
                    Giampaolo Minetti,          Creveldkliniek, University Medical Center Utrecht, Utrecht University, Utrecht, Netherlands
                University of Pavia, Italy
                        Reviewed by:
                                                Hereditary spherocytosis (HS) is the most common form of hereditary chronic hemolytic
                       Alberto Zanella,
      IRCCS Ca ’Granda Foundation               anemia. It is caused by mutations in red blood cell (RBC) membrane and cytoskeletal
   Maggiore Policlinico Hospital, Italy         proteins, which compromise membrane integrity, leading to vesiculation. Eventually, this
                   Theodosia A. Kalfa,
Cincinnati Children’s Hospital Medical
                                                leads to entrapment of poorly deformable spherocytes in the spleen. Splenectomy
                 Center, United States          is a procedure often performed in HS. The clinical benefit results from removing the
                    *Correspondence:            primary site of destruction, thereby improving RBC survival. But whether changes in
                          M. A. E. Rab
                                                RBC properties contribute to the clinical benefit of splenectomy is unknown. In this
               m.a.e.rab@umcutrecht.nl
     † These                                    study we used ektacytometry to investigate the longitudinal effects of splenectomy on
            authors have contributed
        equally and share penultimate           RBC properties in five well-characterized HS patients at four different time points and
                           authorship           in a case-control cohort of 26 HS patients. Osmotic gradient ektacytometry showed
                   Specialty section:
                                                that splenectomy resulted in improved intracellular viscosity (hydration state) whereas
         This article was submitted to          total surface area and surface-to-volume ratio remained essentially unchanged. The
          Red Blood Cell Physiology,            cell membrane stability test (CMST), which assesses the in vitro response to shear
               a section of the journal
               Frontiers in Physiology          stress, showed that after splenectomy, HS RBCs had partly regained the ability to shed
       Received: 14 December 2020               membrane, a property of healthy RBCs, which was confirmed in the case-control cohort.
        Accepted: 24 February 2021              In particular the CMST holds promise as a novel biomarker in HS that reflects RBC
         Published: 25 March 2021
                                                membrane health and may be used to asses treatment response in HS.
                              Citation:
    Berrevoets MC, Bos J, Huisjes R,            Keywords: hereditary spherocytosis, splenectomy, deformability, ektacytometry, biomarker, red blood cell,
           Merkx TH, van Oirschot BA,           hemolytic anemia
         van Solinge WW, Verweij JW,
      Lindeboom MYA, van Beers EJ,
 Bartels M, van Wijk R and Rab MAE              INTRODUCTION
        (2021) Ektacytometry Analysis
 of Post-splenectomy Red Blood Cell             Hereditary spherocytosis (HS) is a heterogeneous group of inherited anemias that originates from
  Properties Identifies Cell Membrane
                                                defective anchoring of transmembrane proteins to the cytoskeletal network of the red blood cell
   Stability Test as a Novel Biomarker
    of Membrane Health in Hereditary
                                                (RBC). The defective anchoring is predominantly caused by a mutation in the genes coding
                        Spherocytosis.          for ankyrin (ANK1), α-spectrin (SPTA1), β-spectrin (SPTB), band-3 (SLC4A1), or protein 4.2
            Front. Physiol. 12:641384.          (EPB42) (Perrotta et al., 2008). These mutations compromise the vertical linkages between the
    doi: 10.3389/fphys.2021.641384              lipid bilayer and the cytoskeletal network, leading to destabilization of the membrane, increased

Frontiers in Physiology | www.frontiersin.org                                          1                                          March 2021 | Volume 12 | Article 641384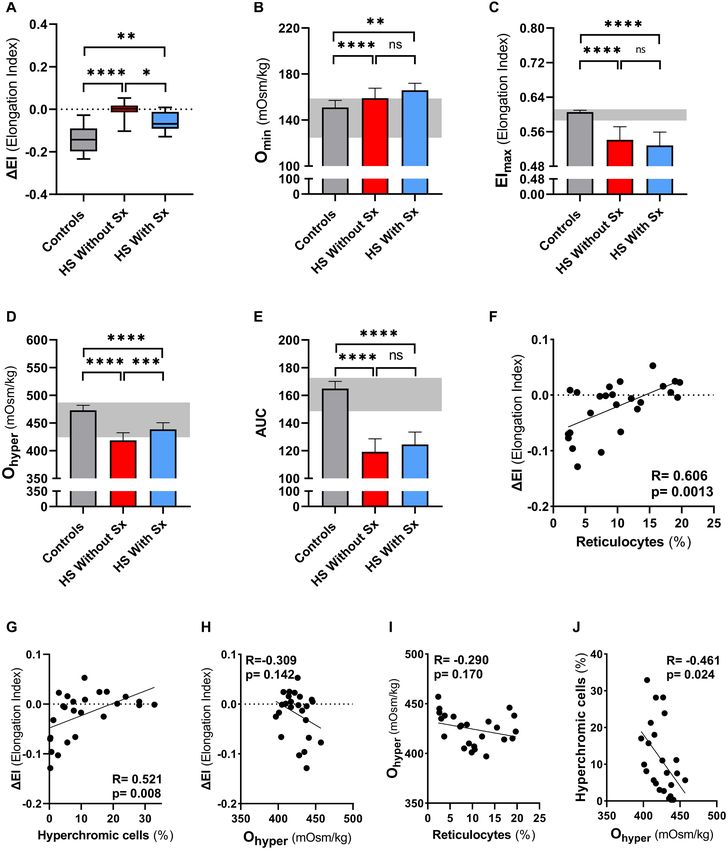
Berrevoets et al.                                                                                 Cell-Membrane-Stability-Test in Hereditary Spherocytosis

vesiculation and subsequent membrane loss. The progressive                   between 13 and 43 years) diagnosed with HS, and scheduled to
membrane loss leads to formation of dense spherical-shaped                   undergo splenectomy. Detailed characteristics are provided in
RBCs (spherocytes) with reduced deformability (Chasis et al.,                Supplementary Table 1. Left-over material of blood collected
1988; Eber and Lux, 2004; Huisjes et al., 2018).                             before splenectomy and at different time points after splenectomy
    The spleen plays an intricate role in the pathophysiology of             (i.e., 1 week, 1 month and ≥3 months) was used for laboratory
HS. Normally, this organ functions as a quality control for RBCs.            measurements. Informed consent was obtained from all patients
During the 120-day lifespan of healthy RBCs, membrane surface                and/or legal guardians. The second group consisted of a patient
area, surface area-to-volume ratio, and deformability decrease               cohort of 26 HS patients: 18 non-splenectomized patients,
because of release of essentially hemoglobin-free microvesicles.             eight patients who underwent splenectomy ≥ 1 year prior to
RBCs with increased density and reduced deformability are                    enrollment, and 26 healthy controls (HC). Blood samples of this
eventually trapped in the narrow endothelial slits of the spleen,            cohort were obtained after inclusion in the CoMMiTMenT-study
leading to clearance of aged RBCs (Eber and Lux, 2004; Mebius                which was approved by the Medical Ethical Research Board of the
and Kraal, 2005). The compromised vertical linkages in HS                    University Medical Center Utrecht, Netherlands (15/426 M) or
accelerate the loss of membrane and deformability, leading                   from anonymized left-over material. Blood from HC individuals
to premature destruction of RBCs in the spleen. Therefore,                   was obtained by means of the institutional blood donor service.
splenectomy is an effective treatment, and removal of the primary
site of RBC destruction generally improves clinical symptoms                 Surgical Procedure
(Musser et al., 1984; Eber and Lux, 2004; Perrotta et al.,                   Laparoscopic total splenectomy was performed in all five
2008). Nevertheless, the risks and benefits should be carefully              patients. The patients were positioned in right lateral decubitus.
assessed as splenectomy results in a permanently increased risk of           Four trocars were used. The lesser sac was entered and the short
infections caused by encapsulated bacteria and long term risk for            gastric vessels were divided. After full mobilization of the spleen,
cardiovascular events (Perrotta et al., 2008; Schilling et al., 2008).       the hilar vessels were controlled by using a linear cutting stapler.
    The effects of splenectomy on RBC rheology and RBC related               The spleen was extracted using a retrieval bag.
parameters in HS have been studied to a limited extent. It is
known that splenectomy improves the RBC count, hemoglobin                    Laboratory Parameters
(Hb) levels, and hematocrit, and that it reduces mean corpuscular            Routine hematological laboratory parameters were analyzed
hemoglobin concentration (MCHC) and the percentage of                        on an Abbott Cell-Dyn Sapphire hematology analyzer (Abbott
reticulocytes (Reliene et al., 2002; Li et al., 2016; Zaninoni               Diagnostics Division, Santa Clara, CA, United States).
et al., 2018; Huisjes et al., 2020). On a cellular level it has been
shown that the size of RBCs increases following splenectomy,                 Ektacytometry
and that microspherocytes can no longer be detected (Sugihara                Deformability of RBCs was measured with the Lorrca (Laser
et al., 1984). However, splenectomy has little effect on correcting          Optical Rotational Red Cell Analyzer, RR Mechatronics, Zwaag,
the cytoskeletal membrane defect (Reliene et al., 2002). More                Netherlands). In this ektacytometer, RBCs are exposed to shear
recent studies have shown that RBC deformability as measured                 stress in a viscous solution (Elon-Iso), forcing the cells to elongate
by osmotic gradient ektacytometry was not improved after                     into an elliptical shape. The diffraction pattern that is generated
splenectomy (Zaninoni et al., 2018; Huisjes et al., 2020). An                by a laser beam is measured by a camera. The vertical axis (A)
important limitation of these studies was the fact that they                 and the horizontal axis (B) of the ellipse are used to calculate
compared cohorts of splenectomized and non-splenectomized                    the elongation index (EI) by the formula (A-B)/(A+B). The EI
patients; longitudinal studies on the response to splenectomy of             reflects the deformability of the total population of RBCs.
individual HS patients are scarce (Li et al., 2016).
    In this study, we investigated individual responses to                   Osmotic Gradient Ektacytometry
splenectomy in a group of five HS patients, with particular focus            Osmotic gradient ektacytometry measurements of RBCs of HC
on RBC functional properties as determined by ektacytometry.                 and HS patients before and after splenectomy were obtained
Our results indicate that the Cell Membrane Stability Test                   using the osmoscan module on the Lorrca according to the
(CMST), which measures the RBCs response to high shear stress,               manufacturer’s instructions and as described elsewhere (DaCosta
is able to detect substantial functional improvement of the RBC              et al., 2016; Lazarova et al., 2017). Briefly, whole blood was
membrane after splenectomy, by showing a partly restored ability             standardized to a fixed RBC count of 1,000 × 106 and mixed
to shed membrane, a feature of healthy RBCs. We suggest that the             with 5 mL of Elon-Iso (RR Mechatronics). RBCs in the viscous
CMST represents a novel biomarker of RBC membrane health in                  solution (Elon-Iso) were exposed to an osmolarity gradient from
HS, and may be used to assess the efficacy of treatment.                     approximately 60 mOsmol/L to 600 mOsmol/L, while shear stress
                                                                             was kept constant (30 Pa).

MATERIALS AND METHODS                                                        Cell Membrane Stability Test
                                                                             The CMST was performed using the CMST module on
Patients                                                                     the ektacytometer. To perform a CMST, whole blood was
Two groups of patients were enrolled in this study. The first                standardized to a fixed RBC count of 200 × 106 and mixed with
group consisted of five patients (one male and four females, aged            5 mL of Elon-Iso. In the CMST RBCs are exposed to a shear stress

Frontiers in Physiology | www.frontiersin.org                            2                                       March 2021 | Volume 12 | Article 641384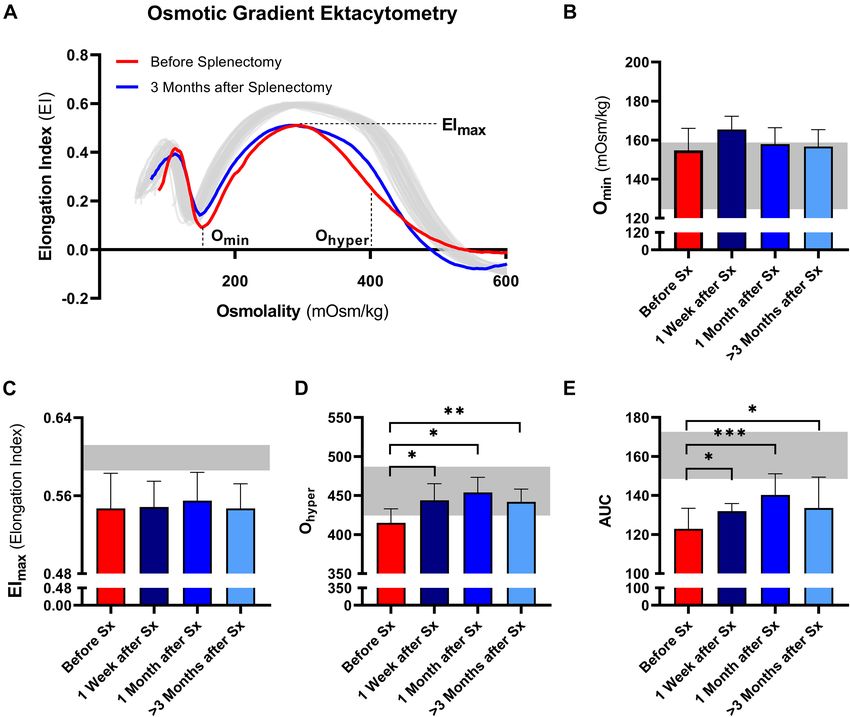
Berrevoets et al.                                                                            Cell-Membrane-Stability-Test in Hereditary Spherocytosis

of 100 Pa for 3,600 s (1 h) while the EI is continuously measured.       assess the values before and after splenectomy. An one-
The change in the elongation index (1EI) was calculated by               way ANOVA, with post-hoc Tukey analysis was used to
determining the median of the first and the last 100 s of the CMST       assess the differences between HC and HS patients, and non-
and subsequently calculating the difference between the medians.         splenectomized and splenectomized HS patients. In addition, a
The 1EI depicts the capacity of the RBCs to shed membrane and            correlation analysis between RBC related parameters and the
resist shear stress.                                                     change in elongation index (1EI) was conducted using the
   Microscopic analysis on a subset of samples was performed             Spearman’s rank correlation coefficient. A p-value below 0.05 was
with the use of a camera microscope (1/1.800 Sony CMOS                   considered statistically significant.
Global IMX265LLR imaging sensor, long working distance VS-
Technology 50X Plan LWD, VS-MS-COL tube) which was placed
on outside of the rotating cup of the Lorrca. A power-LED flash          RESULTS
(415 nm) coupled to a fiber-optic, in bright field illumination,
from the inside of the cup into a 45 degrees mirror and                  Routine Hematological Parameters
diffusor lens directed at the microscope, was used for proper            Show a Decrease in RBC Density and
lighting of the RBCs. A flash time of 214 ns was used to                 Increased RBC Homogeneity After
get less than 1% motion blur. The rotating cup was modified              Splenectomy
with 15 thin and small glass windows circumferential in the              Following splenectomy, routine hematology parameters showed
cup. Images were taken with Image Capture software during a              a significant improvement in RBC count, Hb, and reticulocyte
CMST measurement.                                                        count after 1 and ≥3 months (Figures 1A–C and Supplementary
                                                                         Table 1). Mean corpuscular volume (MCV) increased in the
Density Separation                                                       first week after splenectomy, but returned to pre-surgery
To assess the effect of splenectomy on the composition of                levels in the following months (Figure 1D). This suggests
the RBC population a density separation was carried out                  that cell volume is not altered by splenectomy. At the same
before splenectomy and approximately 1 month after in one                time, we observed a significant decrease in MCHC and
HS patient. A total of 20 mL whole blood was placed on                   the percentage of hyperchromic cells, indicating a decline
top of three layers with different percentage percoll (GE                in RBC density following splenectomy (Figures 1E,F). At
Healthcare) 1.130 ± 0.005 g/mL in eight different columns                the same time, spherocytes and microcytes as assessed by
(2 mL whole blood/column). RBCs were fractioned according                digital microscopy also declined, except for spherocytes in
to density (i.e., cellular age) using this density gradient of           patient 1 (Supplementary Table 1). When RBCs of one HS
percoll with addition of HEPES, NaCl, KCL, and NaOH as                   patient were separated according to density (Supplementary
described in detail elsewhere (Rennie et al., 1979). Cells were          Figure 1A), we noted that the MCHC before splenectomy
centrifuged at 1,665 × g for 15 min, after which four fractions          seemed determined mainly by density fraction 4, containing
could be obtained (Supplementary Figure 1A). Fraction 1,                 the most dense RBCs, whereas after splenectomy density
containing the RBCs with the lowest density, was present                 fractions 3 and 4 seem to contribute equally to the MCHC
on top of the 59% percoll layer, and was only present and                (Supplementary Figure 1B), This implies a more homogeneous
subsequently obtained from the pre-splenectomy blood sample              RBC population after splenectomy, which was also reflected
(Supplementary Figure 1A). Because of the limited amount                 by a more equal distribution of the different fractions after
of RBCs in fraction 1 only a subset of measurements could                splenectomy (Supplementary Figure 1A). Hyperchromic cells
be performed. Fraction 2 was obtained from the top of the                were predominantly present in fraction 4 before splenectomy,
70% percoll layer. Fraction 3 was obtained from the top                  and their number decreased substantially after splenectomy
of the 78% percoll layer. The 4th fraction, containing the               (Supplementary Figure 1C).
most dense RBCs was obtained from the bottom of the tube
(Supplementary Figure 1A).                                               Osmotic Gradient
Digital Microscopy                                                       Ektacytometry-Derived Parameters
Peripheral blood smears were analyzed using the CellaVision              Indicate Increased Cellular Hydration
digital microscope DM96 (software 5.0.1 build11). Analysis was           After Splenectomy
performed using a neuronal network which classifies RBCs                 Osmotic gradient ektacytometry was performed to determine the
based on morphological characteristics such as shape, color,             effect of splenectomy on RBC total surface area (EImax ), surface
and texture. Spherocytes, microcytes and macrocytes (%) were             area-to-volume ratio (Omin ), and RBC hydration state (Ohyper ).
calculated as a percentage of total RBCs as quantified by the            In addition, the area under the curve was calculated (Van Vuren
software (Huisjes et al., 2017).                                         et al., 2019). A representative curve of the effect of splenectomy
                                                                         after 1 month is shown in Figure 2A.
Statistical Analysis                                                         Post-splenectomy values for Omin and EImax did not change
All the data were analyzed using GraphPad Prism version                  significantly compared to pre-splenectomy values, indicating
8.3.0 for Windows (GraphPad Software, San Diego, CA,                     that after splenectomy HS RBCs still had reduced surface
United States). A paired T-test (two-tailed) was used to                 area-to-volume ratio and total surface area (Figures 2B,C,

Frontiers in Physiology | www.frontiersin.org                        3                                      March 2021 | Volume 12 | Article 641384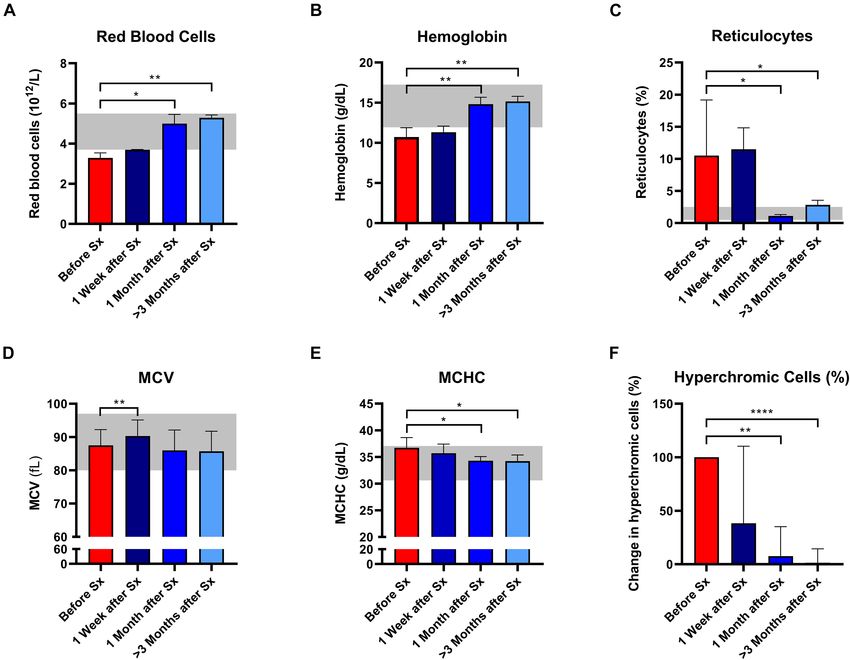
Berrevoets et al.                                                                                             Cell-Membrane-Stability-Test in Hereditary Spherocytosis

  FIGURE 1 | Red blood cell related parameters of patients with hereditary spherocytosis (HS) before and after splenectomy (Sx). Whole blood of HS patients (n = 5)
  was analyzed before and 1 week, 1 and 3 months after splenectomy. (A) Red Blood Cells significantly increased after splenectomy. (B) Mean hemoglobin values
  significantly increased after 1 and 3 months after splenectomy. (C) Mean values of reticulocytes decreased 1 and 3 months after splenectomy. (D) mean values of
  mean corpuscular volume (MCV) increased significantly 1 week after splenectomy but decreased 1 and 3 months after splenectomy. (E) Mean values of mean
  corpuscular hemoglobin concentration (MCHC) decreased significantly 1 and 3 months after splenectomy. (F) Mean change in hyperchromic cells (%) after
  splenectomy. The laboratory reference ranges (2SD) of the University Medical Center Utrecht (UMCU) are depicted in the light gray area. Error bars represent
  standard deviation. ****p < 0.0001, ***p < 0.001, **p < 0.01, and *p ≤ 0.05.

respectively). In contrast, the hydration state or cytoplasmic                        The Cell Membrane Stability Test Reveals
viscosity (Ohyper ) showed a significant increase toward normal                       That HS RBCs Have Regained the Ability
values after already 1 week and this was maintained after 1
and ≥3 months (Figure 2D). This is in line with the decrease                          to Shed Membrane After Splenectomy,
in number of hyperchromic cells and MCHC (Figures 1E,F).                              Reflecting Improved Membrane Health
The increase in Ohyper was accompanied by an increase                                 We next investigated RBC rigidity and its ability to respond
in the AUC, although values remained lower than normal                                to mechanical stress by performing CMST measurements. The
controls (Figure 2E).                                                                 CMST exposes RBCs to a high, supraphysiological, shear stress
    Additional osmotic gradient ektacytometry measurements on                         (100 Pa) for the duration of 1 h. Healthy RBCs showed a gradual
the different density fractions showed that following splenectomy                     decrease in deformability under these conditions (Representative
the variability between the curves from each density fraction                         curve, Figure 3A), reflected by a negative 1EI. The loss of
is less, again indicating a more homogeneous RBC population                           deformability likely results from increased vesiculation in vitro
(Supplementary Figures 1D,E). These analyses also showed                              and consequent membrane loss under shear. In contrast, HS
that only Ohyper of density fraction 4 improved. Therefore,                           RBCs showed a significantly lower 1EI before splenectomy
the increase in Ohyper after splenectomy seemed mainly                                compared to HC (p < 0.01, Figure 3B; representative curve
determined by this fraction, containing the most dense RBCs.                          Figure 3A). This suggests that RBCs of HS patients are more
Ohyper of fractions 2 and 3 decreased after splenectomy, most                         rigid and less able to shed membrane in vitro compared to
presumably due to a decrease in reticulocytes in both fractions                       healthy RBCs. After splenectomy, 1EI increased until it was
(Supplementary Figures 1D–G).                                                         no longer significantly different from HC ≥ 3 months after

Frontiers in Physiology | www.frontiersin.org                                     4                                           March 2021 | Volume 12 | Article 641384
Berrevoets et al. Cell-Membrane-Stability-Test in Hereditary Spherocytosis
FIGURE 2 | Osmotic gradient ektacytometry curve (Osmoscan) and the corresponding parameters of 5 patients with HS before and after splenectomy (Sx).
(A) Representative example of the osmotic gradient ektacytometry curve in P03 before and 3 months after splenectomy. The osmotic gradient ektacytometry curves
of healthy controls (n = 40) are depicted by the gray lines. The changes in (B) the surface area to volume ratio of red blood cells (Omin), (C) the maximum
deformability (EImax), (D) the hydration state or cytoplasmic viscosity (Ohyper) and (E) the area under the curve (AUC) are depicted above. The HS patients (n = 5)
were grouped and the results are displayed as the mean (SD) of the combined values. The mean (2SD) of healthy controls (n = 74) are depicted in the light gray area
(B–E). Error bars represent standard deviation. ***p < 0.001, **p < 0.01, *p ≤ 0.05.
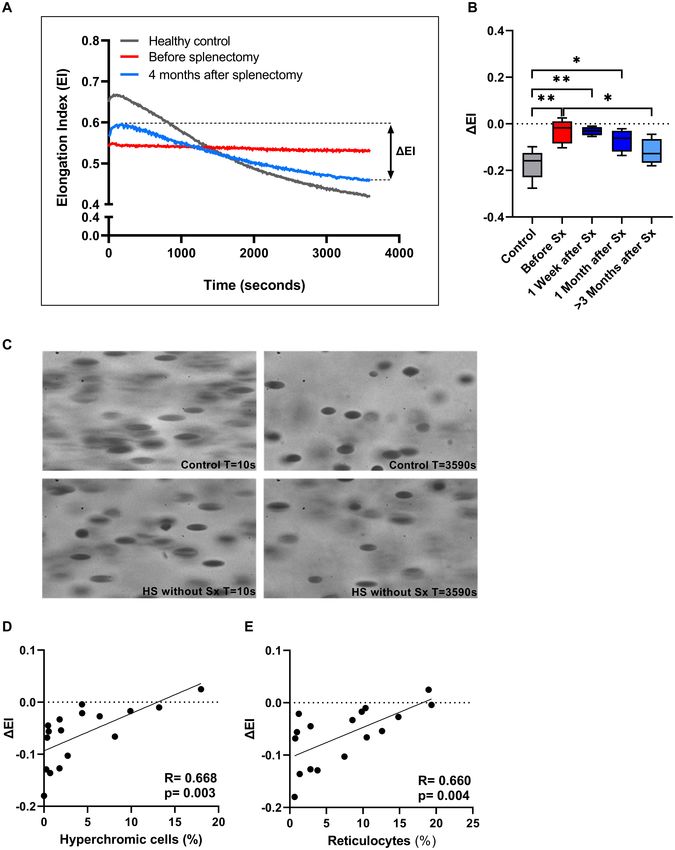
splenectomy (Figure 3B). Hence, splenectomy results in a less non-splenectomized, 8 splenectomized patients, and 26 HCs.
rigid cell population that has for a large part regained the These results confirmed the findings observed in our longitudinal
ability to shed membrane. These findings were strengthened study, showing that the CMST was able to distinguish
by microscopic analysis of RBCs during the CMST. Figure 3C splenectomized HS patients from non-splenectomized HS
shows how RBCs obtained from a HC were fully elongated patients (p = 0.028), in addition to the clear distinction between
and elliptical at the start of the CMST (t = 10 s), then HS patients in general and HCs (both p < 0.001). Similarly,
turning into dense and less elongated RBCs at the end of also in this large cohort there was a correlation of 1EI and
the measurement (t = 3,590 s). In contrast, RBCs of an HS reticulocyte count (R = 0.606, p < 0.01, Figure 4F) and
patient without splenectomy were already dense and unable hyperchromic cells (R = 0.521, p < 0.01 Figure 4G).
to elongate fully at the start of the CMST, remaining like We next evaluated osmotic gradient ektacytometry
this throughout the measurement. Notably, reticulocyte count measurements in this case-control cohort. In agreement
and hyperchromic cells both correlated with 1EI (r = 0.660, with our findings in the longitudinal study (Figure 2B), Omin was
p < 0.01 and r = 0.668, p < 0.01, respectively, Figures 3D,E), not different in splenectomized patients (Figure 4B). Also EImax
indicating that these cells strongly influence the outcome of and AUC were not significantly different in splenectomized
CMST measurements. HS patients (Figures 4C,E). In contrast, Ohyper was the
Additional CMST measurements on the density fractions only parameter that showed improvement when comparing
suggest that the increase in 1EI post-splenectomy are determined splenectomized to non-splenectomized HS patients (p < 0.01,
by density fractions 2 and 3 (Supplementary Figure 1H). Figure 4D). Furthermore, Ohyper correlated with hyperchromic
cells although less clear than 1EI (R = −0.461, p < 0.05,
Supplementary Figure 2), but not with reticulocyte count
Membrane-Shedding as Measured by (Figure 4H). Importantly, 1EI and Ohyper showed no correlation
the CMST Represents a Novel (Figure 4I), suggesting that both biomarkers reflect different
Pathophysiological Property of HS RBCs features of HS RBCs.
To further explore its added value we performed CMST Together, these findings confirm that a decreased ability
measurements on a large HS cohort consisting of 18 to shed membrane in vitro as measured by the CMST is
Frontiers in Physiology | www.frontiersin.org 5 March 2021 | Volume 12 | Article 641384Berrevoets et al. Cell-Membrane-Stability-Test in Hereditary Spherocytosis FIGURE 3 | The Cell membrane stability test (CMST) and the calculated parameter (1EI) improves after splenectomy in a longitudinal study of 5 HS patients. (A) Representative example of the CMST before (red line) and 4 months after splenectomy (light blue line) compared to a healthy control (dark gray line). (B) The mean values of 1EI of HS patients (n = 5) before and after splenectomy. (C) Microscopic images of the RBCs in the Lorrca during a CMST. Start of the measurement (T = 10 s) compared to the end of the measurement (T = 3,590 s) in a control and HS patient without splenectomy. (D) Correlation between 1EI and hyperchromic red blood cells. (E) Correlation between 1EI and reticulocytes (%). Error bars represent standard deviation. **p < 0.01, *p ≤ 0.05. Sx, splenectomy; HS, hereditary spherocytosis; T, time; s, seconds. a novel pathophysiological feature of HS RBCs. It likely DISCUSSION reflects membrane health and improves after splenectomy, thereby rendering a novel biomarker that is distinct from In the present study, we report on the longitudinal effects the improved density/cell hydration as measured by osmotic of splenectomy in five HS patients. We specifically focused gradient ektacytometry. on cellular properties related to membrane health with the Frontiers in Physiology | www.frontiersin.org 6 March 2021 | Volume 12 | Article 641384
Berrevoets et al.                                                                                            Cell-Membrane-Stability-Test in Hereditary Spherocytosis

  FIGURE 4 | Cell membrane stability test (CMST) and the calculated parameter (1EI) shows improvement in splenectomized patients with HS in a case-control study.
  CMST-derived parameter 1EI [panels (A,F,G,H)], osmotic gradient ektacytometry-derived parameters [panels (B–E,H,I,J)], reticulocytes and hyperchromic cells
  were assessed in 18 non-splenectomized HS patients, 8 non-splenectomized HS patients and 26 healthy controls (HC). (A) Mean 1EI of HS patients without
  splenectomy compared to patients with splenectomy, both groups were compared to HCs. (B) Mean values of Omin are increased in splenectomized patients
  compared to HCs or non-splenectomized HS. (C) Mean values of EImax are decreased in splenectomized HS patient RBCs, compared to HC and
  non-splenectomized HS RBCs. (D) Mean values of Ohyper are significantly different between the 3 groups mentioned above. (E) Mean values of AUC show no
  significant differences between non-splenectomized and splenectomized HS RBCs. (F) Linear correlation between reticulocytes (%) and 1EI of HS patients.
  (G) Linear correlation between hyperchromic cells (%) and 1EI of HS patients. (H) Linear correlation between Ohyper and 1EI. (I) Linear correlation between
  reticulocytes (%) and Ohyper. (J) Linear correlation between hyperchromic cells and Ohyper. Error bars represent standard deviation. ****p < 0.0001, ***p < 0.001,
  **p < 0.01, *p ≤ 0.05; ns, non-significant. Sx, splenectomy; HS, hereditary spherocytosis; AUC, area under the curve.

use of two different forms of ektacytometry: osmotic gradient                         cellular property following splenectomy. Membrane-shedding
ektacytometry and the CMST. In particular the CMST results                            capacity in this test is assessed by the loss of deformability that
revealed a novel feature of HS RBCs, i.e., the loss of the                            occurs during prolonged exposure of RBCs to high shear stress.
ability to shed membrane, and improvement of this in vitro                            We suggest that improved membrane-shedding capacity after

Frontiers in Physiology | www.frontiersin.org                                     7                                          March 2021 | Volume 12 | Article 641384
Berrevoets et al.                                                                               Cell-Membrane-Stability-Test in Hereditary Spherocytosis

splenectomy reflects improved RBC membrane health, and 1EI                 in vitro (Waugh and La Celle, 1980). This is confirmed by the
as measured by the CMST may thus serve as a novel clinically               microscopic evaluation of HS RBCs during CMST measurement,
relevant biomarker.                                                        which shows that, in contrast to healthy RBCs, HS RBCs do not
    The longitudinally observed increase in RBC count, Hb                  change morphologically (Figure 3C). Further support for this
and reticulocyte count after splenectomy corresponds well with             hypothesis is obtained from the significant correlation of 1EI and
results from previous studies where splenectomized and non-                hyperchromic cells (Figure 3D).
splenectomized patient groups were compared (Zaninoni et al.,                 Following splenectomy HS RBCs showed an increase in
2018; Huisjes et al., 2020). In addition, our patients also showed a       1EI (Figure 3B) and after more than 3 months 1EI was not
decrease in MCHC directly after splenectomy, which continued               significantly different compared to HC. This suggests that after
to decrease in the following months. This implicates that the              splenectomy HS RBCs have regained part of the ability to shed
internal viscosity or cellular density of HS RBCs is reduced               membrane in vitro, which may be related to a partly restored
after splenectomy, which is supported by the reduction in the              ability of HS RBCs for de novo synthesis of lipids (Cooper
percentage of hyperchromic cells. Little is known about the effect         and Jandl, 1969; Sugihara et al., 1984; Takashi and Yoshihito,
of splenectomy on in vivo RBC vesiculation in HS, an important             1984). The increase in 1EI could also indicate a change in RBC
pathophysiological feature, but previous studies demonstrated              population due to the absence of the quality control function
that RBC vesiculation caused an increase in internal viscosity             of the spleen; Instead of shedding micro vesicles in vivo in the
(MCHC) through shedding of RBC-derived microvesicles (Bosch                spleen (i.e., splenic conditioning), this now occurs in vitro under
et al., 1994; Alaarg et al., 2013; Bosman, 2013). Hence, both the          the supraphysiological conditions in the CMST. In both cases
decrease in MCHC and hyperchromic cells could indicate that                cellular characteristics as obtained by the CMST measurements
in vivo vesiculation of RBCs in HS is reduced after splenectomy.           indicate an improvement after splenectomy, in a sense that
In turn this could explain the observed improvement in 1EI in              they behave more like normal healthy RBCs. Furthermore, the
the CMST after splenectomy, which reflects improved ability to             degree of increase in 1EI after splenectomy we observed could
shed membrane in vitro.                                                    also be dependent on genetic defect (Ingrosso et al., 1996;
    More detailed analysis of the longitudinal effects of                  Reliene et al., 2002). Our findings were strengthened by CMST
splenectomy was obtained by osmotic gradient ektacytometry.                results on a large cohort of HS patients that showed that this
This technique is generally considered as the gold standard                test was able to discriminate between splenectomized and non-
in the diagnosis of HS (DaCosta et al., 2016; Lazarova et al.,             splenectomized HS patients (Figure 4A). This implies that the
2017; Llaudet-Planas et al., 2018; Zaninoni et al., 2018), and its         CMST may represent a novel biomarker of HS, which was
parameters EImax , Omin , and Ohyper are considered biomarkers             further supported by the correlation of 1EI and % reticulocytes
of, respectively, total membrane surface area, surface area to             (r = 0.66, p = 0.004). The ability to distinguish splenectomized
volume ratio, and RBC hydration status. Upon splenectomy                   patients from non-splenectomized patients can be valuable in an
most of these parameters were not affected, only Ohyper was                era where different types of splenectomy are explored. Partial
significantly increased (Figures 2D, 4D). Ohyper and MCHC are              splenectomy, either through embolization of splenic arteries or
known to have an inverse correlation with each other (Zaninoni             through (laparoscopic) removal of a part of the spleen, might
et al., 2018). Both the increase in Ohyper and the decrease in             ameliorate symptoms and improve anemia while maintaining
MCHC indicate that splenectomy improves the hydration                      splenic phagocytic function (Tchernia et al., 1993; Pratl et al.,
state/intracellular viscosity. In line with this, an increase in the       2008). However, data of several small studies are inconclusive
AUC was observed in the longitudinal cohort, whereas AUC                   regarding the remaining immunological capacity of the spleen
remained unchanged after splenectomy in the case-control                   after partial splenectomy even though hemolysis is decreased
cohort. Our findings partly contradict with previous studies were          (Guizzetti, 2016). Larger studies that also include functional
both Ohyper and AUC remained unaltered after splenectomy                   analysis of the spleen and functional analysis of RBCs, i.e., the
(Zaninoni et al., 2018; Huisjes et al., 2020). This could be               CMST, are warranted to accurately assess the efficacy of (partial)
explained by the non-longitudinal design of these latter studies           splenectomy or embolization, and to investigate whether changes
in which individual differences in response to splenectomy                 in RBC properties or the nature of the underlying molecular
become less apparent.                                                      defect (Ingrosso et al., 1996; Reliene et al., 2002) contribute to the
    We next investigated the effect of splenectomy on the ability          clinical benefit of splenectomy.
of HS RBCs to respond to mechanical stress. For this we used                  In conclusion, we report on the longitudinal effects of
the CMST, an ektacytometry based test that was previously used             splenectomy on HS RBC characteristics and function as studied
to study membrane stability in HS by studying resealed RBC                 by ektacytometry. Our data shows that before splenectomy the
ghosts (Mohandas et al., 1982; Chasis and Mohandas, 1986). We              HS RBC population is more heterogeneous, cells are more rigid,
demonstrate that RBCs from non-splenectomized HS patients                  have increased intracellular viscosity and reduced deformability.
show no or only a modest decrease in EI after prolonged exposure           Functional analysis of HS RBCs using osmotic gradient
to shear stress, in contrast to HC RBCs which display a substantial        ektacytometry and CMST further shows that splenectomy
decrease in EI under these conditions. We hypothesize that HS              improves the hydration state of HS RBCs and allows cells
RBCs from non-splenectomized HS patients are more dense                    to regain the ability to shed membrane. In particular the
and rigid due to in vivo vesiculation that is accelerated by               CMST reflects an yet-undescribed distinct RBC characteristic
the spleen, and, therefore are less able to shed membrane                  and holds promise as a novel biomarker for membrane health

Frontiers in Physiology | www.frontiersin.org                          8                                       March 2021 | Volume 12 | Article 641384
Berrevoets et al. Cell-Membrane-Stability-Test in Hereditary Spherocytosis
in HS that could be helpful, together with a comprehensive RH, TM, BO, and MR performed laboratory experiments.
clinical evaluation and appropriate follow-up, to assess the MCB, RW, and MR analyzed the data and wrote the
effect of different treatments such as embolization and (partial) manuscript. All authors edited the manuscript and approved
splenectomy, and that may be related to clinical severity given the final version.
the correlation of 1EI and reticulocyte count. Larger studies are
warranted to establish if the CMST can be used to improve the
assessment of clinical severity and/or is able to contribute to a
better understanding of phenotypic differences in HS. FUNDING
The research has received funding from the European Seventh
DATA AVAILABILITY STATEMENT Framework Program under grant agreement number 602121
(CoMMiTMenT) and was partially funded by an unrestricted
The raw data supporting the conclusions of this article will be grant from RR Mechatronics.
made available by the authors, without undue reservation.
ETHICS STATEMENT ACKNOWLEDGMENTS
The studies involving human participants were reviewed and The authors would like to thank all patients that donated
approved by METC University Medical Center Utrecht. Written blood for this study.
informed consent to participate in this study was provided by the
participants’ legal guardian/next of kin.
SUPPLEMENTARY MATERIAL
AUTHOR CONTRIBUTIONS
The Supplementary Material for this article can be found
RH, MB, RW, and MR designed the study. RH, JV, ML, online at: https://www.frontiersin.org/articles/10.3389/fphys.
MB, EB, and MR collected clinical and laboratory data. JB, 2021.641384/full#supplementary-material
REFERENCES Huisjes, R., Makhro, A., Llaudet-Planas, E., Hertz, L., Petkova-Kirova, P.,
Verhagen, L. P., et al. (2020). Density, heterogeneity and deformability of red
Alaarg, A., Schiffelers, R. M., Van Solinge, W. W., and Van Wijk, R. (2013). Red cells as markers of clinical severity in hereditary spherocytosis. Haematologica
blood cell vesiculation in hereditary hemolytic anemia. Front. Physiol. 4:365. 105, 338–347. doi: 10.3324/haematol.2018.188151
doi: 10.3389/fphys.2013.00365 Huisjes, R., Solinge, W. W., Levin, M. D., Wijk, R., and Riedl, J. A. (2017). Digital
Bosch, F. H., Werre, J. M., Schipper, L., Roerdinkholder-Stoelwinder, B., Huls, T., microscopy as a screening tool for the diagnosis of hereditary hemolytic anemia.
Willekens, F. L., et al. (1994). Determinants of red blood cell deformability in Int. J. Lab. Hematol. 40, 159–168. doi: 10.1111/ijlh.12758
relation to cell age. Eur. J. Haematol. 52, 35–41. Ingrosso, D., D’Angelo, S., Perrotta, S., d’Urzo, G., Iolascon, A., Perna, A. F., et al.
Bosman, G. J. C. G. M. (2013). Survival of red blood cells after transfusion: (1996). Cytoskeletal behaviour in spectrin and in band 3 deficient spherocytic
processes and consequences. Front. Physiol. 4:376. doi: 10.3389/fphys.2013. red cells: evidence for a differentiated splenic conditioning role. Br. J. Haematol.
00376 93, 38–41. doi: 10.1046/j.1365-2141.1996.451990.x
Chasis, J. A., Agre, P., and Mohandas, N. (1988). Decreased membrane mechanical Lazarova, E., Gulbis, B., van Oirschot, B., and van Wijk, R. (2017). Next-generation
stability and in vivo loss of surface area reflect spectrin deficiencies in hereditary osmotic gradient ektacytometry for the diagnosis of hereditary spherocytosis:
spherocytosis. J. Clin. Invest. 82, 617–623. doi: 10.1172/JCI113640 interlaboratory method validation and experience. Clin. Chem. Lab. Med. 55,
Chasis, J. A., and Mohandas, N. (1986). Erythrocyte membrane deformability and 394–402. doi: 10.1515/cclm-2016-0290
stability: two distinct membrane properties that are independently regulated Li, Y., Lu, L., and Li, J. (2016). Topological structures and membrane
by skeletal protein associations. J. Cell Biol. 103, 343–350. doi: 10.1083/jcb.103. nanostructures of erythrocytes after splenectomy in hereditary spherocytosis
2.343 patients via atomic force microscopy. Cell Biochem. Biophys. 74, 365–371. doi:
Cooper, R. A., and Jandl, J. H. (1969). The role of membrane lipids in the survival 10.1007/s12013-016-0755-4
of red cells in hereditary spherocytosis. J. Clin. Invest. 48, 736–744. doi: 10.1172/ Llaudet-Planas, E., Vives-Corrons, J. L., Rizzuto, V., Gómez-Ramírez, P., Navarro,
JCI106031 J. S., Sibina, M. T. C., et al. (2018). Osmotic gradient ektacytometry: a valuable
DaCosta, L., Suner, L., Galimand, J., Bonnel, A., Pascreau, T., Couque, N., et al. screening test for hereditary spherocytosis and other red blood cell membrane
(2016). Diagnostic tool for red blood cell membrane disorders: assessment of disorders. Int. J. Lab. Hematol. 40, 94–102. doi: 10.1111/ijlh.12746
a new generation ektacytometer. Blood Cells Mol. Dis. 56, 9–22. doi: 10.1016/j. Mebius, R. E., and Kraal, G. (2005). Structure and function of the spleen. Nat. Rev.
bcmd.2015.09.001 Immunol. 5, 606–616. doi: 10.1038/nri1669
Eber, S. W., and Lux, S. E. (2004). Hereditary spherocytosis–defects in proteins Mohandas, N., Clark, M. R., Health, B. P., Rossi, M., Wolfe, L. C., Lux,
that connect the membrane skeleton to the lipid bilayer. Semin. Hematol. 41, S. E., et al. (1982). A technique to detect reduced mechanical stability
118–141. of red cell membranes: relevance to elliptocytic disorders. Blood 59,
Guizzetti, L. (2016). Total versus partial splenectomy in pediatric hereditary 768–774.
spherocytosis: a systematic review and meta-analysis. Pediatr. Blood Cancer 63, Musser, G., Lazar, G., Hocking, W., and Busuttil, W. (1984). Splenectomy for
1713–1722. doi: 10.1002/pbc.26106 hematologic disease. The UCLA experience with 306 patients. Ann. Surg. 200,
Huisjes, R., Bogdanova, A., van Solinge, W. W., Schiffelers, R. M., Kaestner, L., 40–45. doi: 10.1097/00000658-198407000-00006
and van Wijk, R. (2018). Squeezing for life - Properties of red blood cell Perrotta, S., Gallagher, P. G., and Mohandas, N. (2008). Hereditary spherocytosis.
deformability. Front. Physiol. 9:656. doi: 10.3389/fphys.2018.00656 Lancet 372, 1411–1426. doi: 10.1016/S0140-6736(08)61588-3
Frontiers in Physiology | www.frontiersin.org 9 March 2021 | Volume 12 | Article 641384Berrevoets et al. Cell-Membrane-Stability-Test in Hereditary Spherocytosis Pratl, B., Benesch, M., Lackner, H., Portugaller, H. R., Pusswald, B., Sovinz, P., et al. Van Vuren, A., Van Der Zwaag, B., Huisjes, R., Lak, N., Bierings, M., (2008). Partial splenic embolization in children with hereditary spherocytosis. Gerritsen, E., et al. (2019). The complexity of genotype-phenotype correlations Eur. J. Haematol. 80, 76–80. doi: 10.1111/j.1600-0609.2007.00979.x in hereditary spherocytosis: a cohort of 95 patients: genotype-phenotype Reliene, R., Mariani, M., Zanella, A., Reinhart, W. H., Ribeiro, M. L., del Giudice, correlation in hereditary spherocytosis. HemaSphere 3:e276. doi: 10.1097/HS9. E. M., et al. (2002). Splenectomy prolongs in vivo survival of erythrocytes 0000000000000276 differently in spectrin/ankyrin- and band 3-deficient hereditary spherocytosis. Waugh, R. E., and La Celle, P. L. (1980). Abnormalities in the membrane material Blood 100, 2208–2215. doi: 10.1182/blood.v100.6.2208.h81802002208_2208_ properties of hereditary spherocytes. J. Biomech. Eng. 102:240. doi: 10.1115/1. 2215 3149580 Rennie, C. M., Thompson, S., Parker, A. C., and Maddy, A. (1979). Human Zaninoni, A., Fermo, E., Vercellati, C., Consonni, D., Marcello, A. P., Zanella, erythrocyte fractionation in “percoll” density gradients. Clin. Chim. Acta 98, A., et al. (2018). Use of laser assisted optical rotational cell analyzer (LoRRca 119–125. doi: 10.1016/0009-8981(79)90172-4 MaxSis) in the diagnosis of RBC membrane disorders, enzyme defects, and Schilling, R. F., Gangnon, R. E., and Traver, M. I. (2008). Delayed adverse vascular congenital dyserythropoietic anemias: a monocentric study on 202 patients. events after splenectomy in hereditary spherocytosis. J. Thromb. Haemost. 6, Front. Physiol. 9:451. doi: 10.3389/fphys.2018.00451 1289–1295. doi: 10.1111/j.1538-7836.2008.03024.x Sugihara, T., Miyashima, K., and Yawata, Y. (1984). Disappearance of Conflict of Interest: The authors declare that the research was conducted in the microspherocytes in peripheral circulation and normalization of decreased absence of any commercial or financial relationships that could be construed as a lipids in plasma and in red cells of patients with hereditary spherocytosis after potential conflict of interest. splenectomy. Am. J. Hematol. 17, 129–139. Takashi, S., and Yoshihito, Y. (1984). Observations on plasma and red cell lipids Copyright © 2021 Berrevoets, Bos, Huisjes, Merkx, van Oirschot, van Solinge, in hereditary spherocytosis. Clin. Chim. Acta 137, 227–232. doi: 10.1016/0009- Verweij, Lindeboom, van Beers, Bartels, van Wijk and Rab. This is an open-access 8981(84)90182-7 article distributed under the terms of the Creative Commons Attribution License Tchernia, G., Gauthier, F., Mielot, F., Dommergues, J. P., Yvart, J., Chasis, J. A., (CC BY). The use, distribution or reproduction in other forums is permitted, provided et al. (1993). Initial assessment of the beneficial effect of partial splenectomy the original author(s) and the copyright owner(s) are credited and that the original in hereditary spherocytosis. Blood 81, 2014–2020. doi: 10.1016/B978-0-323- publication in this journal is cited, in accordance with accepted academic practice. No 05226-9.50014-1 use, distribution or reproduction is permitted which does not comply with these terms. Frontiers in Physiology | www.frontiersin.org 10 March 2021 | Volume 12 | Article 641384
You can also read