Second-Quarter Earnings - July 22, 2021 - Investors
←
→
Page content transcription
If your browser does not render page correctly, please read the page content below
Second-Quarter Earnings
July 22, 2021

Safe Harbor Statements and Non-GAAP Results
These materials contain forward-looking information. Words such as "anticipate," "assume," "estimate," "expect," “target” "project," “model”, "predict," "intend," "plan," "believe," "potential,"
"may," "should" and similar expressions may identify forward-looking information. Forward-looking information in these materials includes, but is not limited to information regarding: 2021
outlook, including revenue, operating profit, adjusted EBITDA, earnings per share, capital expenditures, net debt and leverage, free cash flow and the drivers thereof; 2022 financial
targets; the impact of economic recovery, cost reductions, leverage, the PAI acquisition, the G4S acquisitions and cross-currency interest rate swap; strength of cash levels; ESG initiatives
and commitments; strategic targets and initiatives (including Strategic Plan 2); future legacy liability contributions.

Forward-looking information in this document is subject to known and unknown risks, uncertainties and contingencies, which are difficult to predict or quantify, and which could cause
actual results, performance or achievements to differ materially from those that are anticipated. These risks, uncertainties and contingencies, many of which are beyond our control,
include, but are not limited to: our ability to improve profitability and execute further cost and operational improvement and efficiencies in our core businesses; our ability to improve service
levels and quality in our core businesses; market volatility and commodity price fluctuations; seasonality, pricing and other competitive industry factors; investment in information
technology (“IT”) and its impact on revenue and profit growth; our ability to maintain an effective IT infrastructure and safeguard confidential information; our ability to effectively develop
and implement solutions for our customers; risks associated with operating in foreign countries, including changing political, labor and economic conditions, regulatory issues (including the
imposition of international sanctions, including by the U.S. government), currency restrictions and devaluations, restrictions on and cost of repatriating earnings and capital, impact on the
Company’s financial results as a result of jurisdictions determined to be highly inflationary, and restrictive government actions, including nationalization; labor issues, including negotiations
with organized labor and work stoppages; pandemics (including the ongoing Covid-19 pandemic and related impact to and restrictions on the actions of businesses and consumers,
including suppliers and customers), acts of terrorism, strikes or other extraordinary events that negatively affect global or regional cash commerce; anticipated cash needs in light of our
current liquidity position and the impact of Covid-19 on our liquidity; the strength of the U.S. dollar relative to foreign currencies and foreign currency exchange rates; our ability to identify,
evaluate and complete acquisitions and other strategic transactions and to successfully integrate acquired companies; costs related to dispositions and product or market exits; our ability
to obtain appropriate insurance coverage, positions taken by insurers relative to claims and the financial condition of insurers; safety and security performance and loss experience;
employee and environmental liabilities in connection with former coal operations, including black lung claims; the impact of the Patient Protection and Affordable Care Act on legacy
liabilities and ongoing operations; funding requirements, accounting treatment, and investment performance of our pension plans, the VEBA and other employee benefits; changes to
estimated liabilities and assets in actuarial assumptions; the nature of hedging relationships and counterparty risk; access to the capital and credit markets; our ability to realize deferred
tax assets; the outcome of pending and future claims, litigation, and administrative proceedings; public perception of our business, reputation and brand; changes in estimates and
assumptions underlying critical accounting policies; the promulgation and adoption of new accounting standards, new government regulations and interpretation of existing standards and
regulations.

This list of risks, uncertainties and contingencies is not intended to be exhaustive. Additional factors that could cause our results to differ materially from those described in the forward-
looking statements can be found under "Risk Factors" in Item 1A of our Annual Report on Form 10-K for the period ended December 31, 2020 and in related disclosures in our other public
filings with the Securities and Exchange Commission, including our Quarterly Report on Form 10-Q for the quarterly period ended March 31, 2021. Unless otherwise noted, the forward-
looking information discussed today and included in these materials is representative as of today only and The Brink's Company undertakes no obligation to update any information
contained in this document.

These materials are copyrighted and may not be used without written permission from Brink's.

Today’s presentation is focused primarily on non-GAAP results. Detailed reconciliations of non-GAAP to GAAP results are included in the appendix and in the Second Quarter 2021
Earnings Release available in the Quarterly Results section of the Brink’s website: www.brinks.com.
                                                                                                                                                                                                       2
Key Messages
                                                                                                                                                                                                         (non-GAAP)
Strong 2Q Results, Continued Growth Expected in Second Half and in 2022

Strong 2Q growth in revenue, operating profit, adjusted EBITDA and EPS
 • Revenue up 27%...driven by organic growth of 15% and acquisitions
 • Operating profit up 51%, margin up 160 bps to 10.5%
 • Adjusted EBITDA up 39%, margin up 130 bps to 15.8%
 • EPS up 62%...$1.18 vs $.73

2021 Guidance
 • Revenue % growth expected in mid-to-high teens
 • Second-half growth and margin expansion expected to drive strong increases in Op Profit, Adj. EBITDA and EPS

Expect Continued Growth in 2022
  • Second-half momentum, continued re-openings lead to 2022 revenue that exceeds comparable pre-Covid levels
  • Continued margin expansion to drive strong growth in Adj. EBITDA and cash flow

Investor Day planned for early December
  • Detailed review of core and digital strategies
  • 2023 financial targets to be disclosed

Notes: See detailed reconciliations of non-GAAP to GAAP results included in the Second Quarter 2021 Earnings Release available in the Quarterly Results section of the Brink’s website www.brinks.com.
                                                                                                                                                                                                              3
2021 Guidance
(non-GAAP, $ millions, except EPS)
Strong Revenue and Margin Growth Expected in 2021
Revenue1,2 +14 -19% Op Profit1 +34% Adj. EBITDA1 +25% EPS1 +32%
~15%
growth
$785-
$825
$4,600
$4,400 $750
$556 $5.55
$4,200 $705
$511 $4.95
$3,680 $3,691
$660
$466 $4.35
$567 $566
$3.89 $3.76
$392 $381
15.4% 15.3% ~16.0%
10.6% 10.3% ~11.6%
Margin Margin Margin
Margin Margin Margin
2019 2020 2021 2019 2020 2021 2019 2020 2021 2022 2019 2020 2021
Guidance Guidance Guidance Target Guidance
1. 2021 growth rates calculated based on mid-point of range provided vs 2020 except revenue which is calculated based on the low-point and mid-point.
2. Revenue Guidance reduced by $50M to reflect net vs gross revenue recognition for PAI.
Notes: See detailed reconciliations of non-GAAP to GAAP results included in the Second Quarter 2021 Earnings Release available in the Results section of the Brink’s website www.brinks.com. 4
See detailed reconciliations of non-GAAP to GAAP 2019 results in the Appendix.Second-Quarter 2021 Results
(non-GAAP, $ millions, except EPS)
Revenue +27% Op Profit +51% Adj. EBITDA +39% EPS +62%
Constant currency +22% Constant currency +48% Constant currency +35% Constant currency +56%
Organic +15% Organic +42%
+59% excluding
Acq +7% Acq +5%
MGI impact1
FX +5% FX +4%
$1,049
$1,010 $166 $161
$111 $1.18
$914 $108 $1.14
$826 $133
$89
$120
$0.86
$73
$0.73
9.7% 8.9% 10.5% 10.7% 14.6% 14.5% 15.8% 15.9%
Margin Margin Margin Margin Margin Margin Margin Margin
2019 2020 2021 Const. 2019 2020 2021 Const. 2019 2020 2021 Const. 2019 2020 2021 Const.
Curr. Curr. Curr. Curr.
Notes: See detailed reconciliations of non-GAAP to GAAP results included in the Second Quarter 2021 Earnings Release available in the Results section of the Brink’s website www.brinks.com.
See detailed reconciliations of non-GAAP to GAAP 2019 results in the Appendix.
Constant currency represents 2021 results at 2020 exchange rates.
1. Excludes the impact of mark-to-market accounting related to equity investment in MoneyGram International, Inc. 5Second-Quarter Revenue and Operating Profit vs 2020
(non-GAAP, $ millions)
Revenue Operating Profit
% Change 15% 7% 22% 5% 27% % Change 42% 5% 48% 4% 51%
Constant Constant
Currency Currency
$4 $108 $3 $111
$39 $1,049 $31
$59 $1,010
$125
$826
$73
8.9% 10.7% 10.5%
Margin Margin Margin
2020 Organic Acq / Disp* 2021 FX 2021 2020 Organic Acq / Disp* 2021 FX 2021
Revenue Revenue Revenue Op Profit Op Profit Op Profit
Before FX Before FX
Notes: Amounts may not add due to rounding. See detailed reconciliations of non-GAAP to GAAP results included in the Second Quarter 2021 Earnings Release available in the Results section of the Brink’s website www.brinks.com.
* Acq/Disp amounts include the impact of prior year trailing twelve-month results for acquired and disposed businesses. 6Second-Quarter Adjusted EBITDA and EPS vs 2020
(non-GAAP, $ millions, except EPS)
+39%
Q2 2021 EPS: $1.18 +62% vs PY
vs PY
Q2 2020 EPS: $0.73
Q2 2021 EPS includes MGI
impact of +$0.07 vs Q2 2020 $11 ( $11 )
$58 $166
$111 ( $28 ) $48
( $30 )
$6 $60
Op Profit Interest Taxes Other Income from D&A Interest Exp Stock Comp Marketable Adj. EBITDA
Expense Continuing Ops & Taxes Securities
VS. 2020 $37 ( $5 ) ( $12 ) $2 $22 $6 $17 $6 ( $5 ) $46
Notes: Amounts may not add due to rounding. See detailed reconciliations of non-GAAP to GAAP results included in the Second Quarter 2021 Earnings Release available in the Quarterly Results section of the Brink’s website www.brinks.com. 7Strong Free Cash Flow Expected in 2021
(Non-GAAP, $ millions)
Adjusted
EBITDA $660-$750 ( $95 )
Growth of ~65%
excluding Adjusted EBITDA
D&A / ( $95 ) deferred
$194 Working Capital and Cash Restructuring: Lower
Other payments
restructuring expected in 2021 post-Covid-19 and
( $105 ) G4S acquisition
$35 Deferred Payments to be made: primarily
( $180 ) 33-41% of payroll taxes in US and France
EBITDA
Cash Taxes: Higher due to timing of refunds
$220-$310 Cash Interest: Higher due to acquisitions, partially
Op Profit $466- $185-$275
$556 offset by cross-currency interest rate swap
Cash Capital Expenditures: Higher due to
temporary reductions in 2020
Free Cash Flow before Dividends
Pro-forma excluding deferred payroll taxes
Adj. WC, Cash Cash Cash Cash Free Cash Flow Pro-forma
1 1
EBITDA Restructuring Taxes Interest CapEx before Dividends excluding
& Deferred deferred
Payments payroll taxes
VS. 2020 $94-$184 ( $3 ) ( $18 ) ( $27 ) ( $67 ) ($21)-$69 $59-$149 2022 FCF Growth Target 50%+
Notes: Amounts may not add due to rounding. See detailed reconciliations of non-GAAP to GAAP results included in the Second Quarter 2021 Earnings Release available in the Quarterly Results section of the Brink’s website www.brinks.com.
1. Includes cash proceeds from sale of property, equipment and investments. 8Net Debt and Leverage
(Non-GAAP, $ millions)
Net Debt Adjusted EBITDA and Financial Leverage
Net Debt
Leverage 3.3 3.4 ~2.7 – 3.2 ~2.2 – 2.4
Ratio1
$2,219 $2,055 - Secured Leverage Ratio3
$2,145 ~2.0 $785 - $825
(Max = 4.0x)
$1,800 -
$1,884 $1,900
$660 - $750
$989
Unsecured $645
$990 Adjusted
Senior
Notes4 EBITDA
$988 $566
$1,230 $1,065 –
Secured $1,155
Net Debt $896
12/31/2020 6/30/2021 12/31/2021 12/31/2022 2020 Q2 2021 TTM 2021 2022
Actual Actual Estimate 2 Target 2 Actual Actual Guidance Target
Note: See detailed reconciliations of non-GAAP to GAAP results in the Appendix and included in the Second Quarter 2021 Earnings Release available in the Quarterly Results section of the Brink’s website www.brinks.com.
1. Net Debt divided by Adjusted EBITDA.
2. Pro-forma Net Debt at year-end, considering our 2021 and 2022 Free Cash Flow Targets.
3. Bank-defined. Bank defined EBITDA includes TTM EBITDA, plus projected 18 month synergies for acquisitions
4. Net of unamortized debt issuance costs of $13 million as of 12/31/2020, $11 million as of 6/30/2021, $10 million as of 12/31/2021 and $8 million as of 12/31/2022. 9Building a More Sustainable Brink’s
As the world’s largest cash management company, we help empower millions of underbanked people around the world access
goods and services by keeping cash moving and accessible.
While sustainability has long been important to us, societal expectations have intensified and we are doing more to improve in
each pillar of ESG.
ENVIRONMENT SOCIAL GOVERNANCE
Reducing our environmental Promoting inclusion by: Enhancing trust with all of our
impact by: • Serving as advocates for cash as stakeholders by:
• Integrating responsible a payment method, which supports • Ensuring everything we do aligns with
environmental practices in our daily the unbanked and underbanked our code of ethics
operations • Fostering a diverse, equitable and • Employing risk management and other
• Reducing emissions and increasing inclusive workplace processes for responsible operations
the efficiency of our fleet operations • Ensuring our supplier base reflects and ethical decision-making
through our digital transformation the diversity of the communities • Adhering to good corporate
and route optimization we serve governance practices, including our
focus on Board diversity and robust
shareholder rights
10
For more information, please visit the Sustainability page at brinks.comStrategic Plan 2: A New Layer of Growth on a Strong Foundation
Strategy 2.0 adds digital cash management solutions
2020 2021 2022 2023
2.1 – Digital Cash Management
Strategy 2.0 2.2 – Enterprise Cash Automation
Digital Cash Management 2.3 – ATM Managed Services
2.4 – Integrating Cash with Digital Payments
• $2.2B invested in 15 acquisitions, including G4S and PAI
Strategy 1.5 • G4S largely integrated, expect to exceed synergy targets
Acquisitions • $1.4B in liquidity, assessing new opportunities primarily to support Strategy 2.01
Strategy 1.0 • Leverage – sustained cost reductions + rev growth expected to add 150 bps margin by 2022
Wider Deeper + Leverage • WD Target $70M cost reductions 2021 – 2022
Core Organic Growth — Implementing efficiency initiatives over expanded platform with dedicated Lean experts
1. Pro-forma liquidity at year-end 2021, considering our 2021 Free Cash Flow Target and the impact of the PAI acquisition. 11Digital Solutions Expected to Gain Traction in 2022
Seizing the Unvended Opportunity with Brink’s Complete
Unvended Opportunity for Cash Management Benefits for retailers include:
~85% of U.S. Retail / Merchant Locations Not Served
• On-site deposits eliminate trips to the bank
Unvended
“white space” • Eliminates multiple bank accounts and
Partially Vended
opportunity related fees
Vended
• Reduces labor costs, enables staff to
prioritize customer service
~3 Million+ • Next-day credit optimizes working capital
Locations access; settlement same as debit and credit
• Improved security/reduced theft
• Improved analytics for tracking and
reconciliation
Digital solutions that make cash payments as easy as debit and credit
12
Note: Brink’s internal estimatesCore Operations Drive Strong Earnings Growth
(non-GAAP, $ millions, except EPS)
Digital Solutions Expected to Add New Layer of Growth in 2022
Revenue, Adjusted EBITDA & Operating Profit 2021 Guidance
$4,200 - $4,600 Low Mid High
vs 20202
$3,680 $3,691
Revenue
Revenue1 $4,200 $4,400 $4,600 +14 - 19%
15.7% - 16.3% Op Profit $466 $511 $556
+34%
15.4% 15.3% Margin 11.1% 11.6% 12.1%
Adj. EBITDA
Adj. EBITDA $660 $705 $750
+25%
11.1% - 12.1% Margin 15.7% 16.0% 16.3%
Op Profit 10.6%
10.3% $785– EPS $4.35 $4.95 $5.55 +32%
$825
$660 –
$750
As we approach Investor Day in December…
Adj. EBITDA $567 $566 ~$194
• Strong 2021 recovery in core business expected to
D&A/Other
$175 $185 accelerate in second half
• 2022 preliminary targets reflect continued momentum in
$466 - core as pandemic impact subsides
Op Profit $392 $556
$381 • Digital solutions expected to gain traction in 2022
• Detailed growth strategy and 2023 financial targets to be
provided at Investor Day
2019 2020 2021 2022
Guidance Target
Note: See detailed reconciliations of non-GAAP to GAAP results in the Appendix and included in the Second Quarter 2021 Earnings Release available in the Quarterly Results section of the Brink’s website www.brinks.com.
1. Revenue Guidance reduced by $50M to reflect net vs gross revenue recognition for PAI. 13
2. 2021 growth rates calculated based on mid-point of range provided vs 2020 except revenue which is calculated based on the low-point and mid-point.Appendix
Second-Quarter Results by Segment
                                                                                                                                                                                                          ($ millions)

          North America                                                   Latin America                                       Europe                                  Rest of the World
Revenue +30%                Op Profit +389%                  Revenue +18%                Op Profit +37%      Revenue +37%             Op Profit +1458%          Revenue +23%                Op Profit +3%
Constant currency +29%                     +388%             Constant currency +17%                   +40%   Constant currency +26%                    +1342%   Constant currency +15%                    (4%)

       Organic         +21%        +344%                            Organic       +16%       +40%                  Organic        +18%    +1300%                      Organic           –         (2%)
       Acq              +8%         +44%                            Acq              –           –                 Acq             +8%      +42%                      Acq            +15%         (2%)
       FX               +1%          +1%                            FX             +2%        (4%)                 FX             +11%     +117%                      FX              +8%         +6%

               $357
                                                                           $273
                                                                                                                          $231
     $274                                                        $230
                                                                                                                                                                            $188

                                                                                                  $57           $168                                               $153
                                                                                                  20.9%
                                                                                          $42     Margin
                                         $41
                                         11.5%                                           18.1%                                                                                              $31     $32
                                         Margin                                          Margin
                                                                                                                                                                                            20.2% 16.9%
                                                                                                                                                   $19
                                                                                                                                                                                            Margin Margin
                                  $8                                                                                                               8.1%
                                                                                                                                                   Margin
                                3.1%                                                                                                      $1
                                Margin
                                                                                                                                               1
     2020 2021                  2020 2021                       2020 2021                2020 2021              2020 2021                2020 2021                 2020 2021                2020 2021

1. 2Q20 Op Profit Margin of 0.7%
Note: Constant currency represents 2021 results at 2020 exchange rates.
                                                                                                                                                                                                                 15
Cash Levels Stronger Post-Covid
(USD, Billions)
USD – Currency in Circulation1 Brink’s Cash Levels
2,200 Second Quarter 2021
Second quarter 2021
2,100
2,000
13% Brink’s U.S. Cash Processed
YoY % Increase
1,900
1,800
1,700
1990-2020
6%
+17% +19%
1,600 30-yr CAGR
vs 2Q20 vs 2Q19
2019 2020 2021
Value of Cash2
Euro – Currency in Circulation3
(Euro, Billions)
Second quarter 2021 PAI U.S. ATM Levels
1,500
1,400
9%
YoY % Increase
1,300
1,200
2002-2020
+32% +13%
1,100
vs 2Q20 vs 2Q19
9%
1,000
2019 2020 2021
18-yr CAGR
Withdrawal Transactions4
Q2-2021 Key Latin American markets year-over-year currency in circulation increases:
• Mexico 17%5
• Brazil 8%5
1. U.S. currency in circulation through June 2021. Source: St. Louis Federal Reserve (FRED). Weekly (QoQ) / Monthly (Historical) Average Currency in Circulation (Billions of Dollars, Weekly, Not Seasonally Adjusted)
2. Represents year-over-year increase in value of cash processed in U.S.
3. Euro currency in circulation through June 2021. Source: ECB. Monthly Currency in Circulation (Billions, Monthly, Not Seasonally Adjusted)
4. Represents year-over-year increase in number of withdrawal transactions on “same terminal” basis 16
5. Brazilian real currency in circulation source: Banco Central do Brazil. Mexican peso currency in circulation source: Banco de MexicoCash is Inclusive and Does Not Discriminate
Cash is a vital lifeline to millions of Americans who rely on it to Restricting cash will exclude a
purchase goods and services. In 2020, ~18% of U.S. adults were significant portion of the population,
either unbanked or underbanked and consequently highly reliant on primarily in lower-income
cash, according to the Federal Reserve1. communities and communities
of color, say advocates.
All consumers should be able to
use cash to purchase goods and
services, regardless of their level
of sophistication with technology
or their ability to open a
bank account.
Businesses that refuse to accept cash face
well-deserved accusations of discrimination
because they are limiting equal access to the
same goods or services.”
– Linda Sherry,
Director of National Priorities, Consumer Action
1. Federal Reserve Report on the Economic Well-Being of U.S. Households in 2020
17U.S. Lawmakers Pursue Legislation to Protect Cash
Local and federal lawmakers are pursuing legislation to
ensure cash is accepted at all physical retail locations. There are too many
stores and businesses that want
The Payment Choice Act recently introduced by
Representative Donald M. Payne Jr. (D-NJ, 10th District), to reject American cash in favor
has bipartisan support. It prohibits retail businesses from of digital payments. But cash is
refusing cash payments. the only option available for
millions of Americans to pay for
food, housing and other
essentials.”
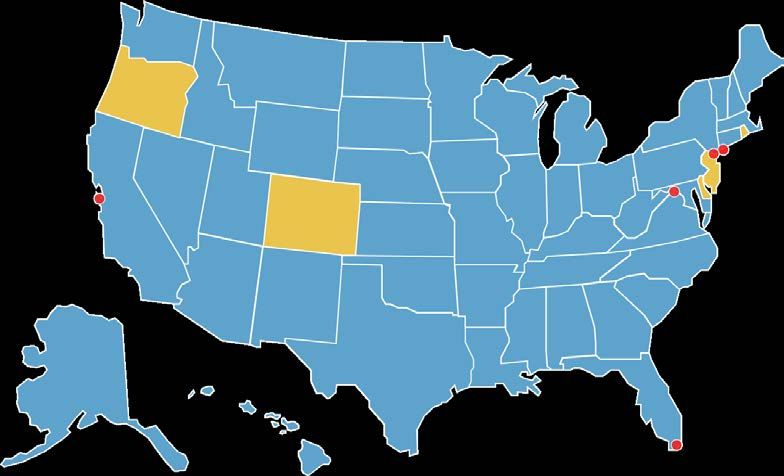
Several local and state governments
have recently passed or considered – Rep. Donald M. Payne, Jr.,
legislation to protect cash, including: (D-NJ, 10th District), July 9, 2021
• Colorado
• Delaware
• Miami-Dade County
• New Jersey
• New York City Learn more at
• Oregon
• Philadelphia investors.brinks.com/
• Rhode Island cash-usage
• San Francisco
• Washington, D.C.
18Strong Financial Health – Ample Liquidity
($ millions, except where noted)
Increased liquidity in 2020
Cash and Debt Capacity
• Incremental $590 million Term Loan A closed on
April 1, 2020
Cash $602 $634
~$1.3 B
• Incremental $400 million Senior Notes closed on
~$1.6 B
Liquidity
Liquidity
~$1.4 B June 22, 2020
Liquidity
Revolver No Maturities until 2024
$1 B
• Credit Facility matures February 2024
• $600 million 4.625% Senior Notes mature October 2027
• $400 million 5.5% Senior Notes mature July 2025
Term Loan A $1,298 $1,263 $1,229
Interest Rates
• Variable interest LIBOR plus 2.00%
• $400M USD/EUR interest rate swap saves 151 bps
Senior Notes $1,000 $1,000 $1,000 Debt Covenants Amended
• Net secured debt leverage ratio of 1.8x vs 4.0x max
Fin. Leases & Other $206 $239 $239
No legacy liability contributions expected until 2029
12/31/2020 6/30/2021 12/31/2021
Pro-forma1 Moody’s Ba2 (Stable); S&P BB (Stable)
Utilized Revolver Available Revolver
1. Pro-forma liquidity at year-end 2021, considering our 2021 Free Cash Flow Target. 19Debt Maturity Profile
($ millions)
$1,000
Revolver
Term
Loan A Senior Notes
$1,089 Senior Notes
$600
$70 $70 $70 $400
2021 2022 2023 2024 2025 2026 2027
Maturity Schedule for Credit Facility and Senior Notes
20Estimated Cash Payments for Legacy Liabilities
($ millions)
Payments to Primary U.S. Pension Payments to UMWA $281
No cash payments are expected in foreseeable future
$23 $24 $23
Term $0
Loan A
2021 2022 2023 2024 2025 2026 2020 2029 2030 2031 After 2031
Primary US Pension
• The American Rescue Plan Act ("ARPA") signed into law in March 2021, provides funding relief for single-employer
defined benefit pension plans. The ARPA provisions result in significant reduction in, and deferral of, minimum funding
requirements. Because of the significant impact the ARPA provisions have on our primary U.S. pension plan's
estimated future funding requirements, we have updated the assumptions used to calculate the estimated future
payments. Based on these revised assumptions, no cash payments to the plan are needed in the foreseeable future.
• Remeasurement occurs every year-end: disclosed in the 2020 annual report on Form 10-K
UMWA
• Based on actuarial assumptions (as of 12/31/20), cash payments are not needed until 2029
• Remeasurement occurs every year-end: disclosed in the 2020 annual report on Form-10K
212019 Non-GAAP Results Reconciled to GAAP (1 of 3)
The Brink’s Company and subsidiaries
Non-GAAP Reconciliations
2019
(In millions) Q2 Full Year
Revenues:
GAAP $ 914.0 3,683.2
Acquisitions and dispositions(a) 0.3 0.5
Internal loss(a) - (4.0)
Non-GAAP $ 914.3 3,679.7
Operating profit (loss):
GAAP $ 52.6 236.8
Reorganization and Restructuring(a) 10.6 28.8
Acquisitions and dispositions(a) 22.6 88.5
Argentina highly inflationary impact(a) 0.1 14.5
Internal loss(a) 2.6 20.9
Reporting compliance(a) 0.3 2.1
Non-GAAP $ 88.8 391.6
Interest expense:
GAAP $ (22.7) (90.6)
Acquisitions and dispositions(a) 1.5 5.8
Non-GAAP $ (21.2) (84.8)
Taxes:
GAAP $ 12.7 61.0
Retirement plans(c) 1.6 11.1
Reorganization and Restructuring(a) 2.6 7.1
Acquisitions and dispositions(a) 1.1 5.1
Tax on accelerated income(d) - 7.3
Argentina highly inflationary impact(a) - (1.4)
Internal loss(a) 0.1 4.0
Reporting compliance(a) - 0.1
Gain on lease termination(h) - (1.2)
Income tax rate adjustment(b) 2.7 -
Non-GAAP $ 20.8 93.1
Amounts may not add due to rounding.
See slide 24 for footnote explanations. 222019 Non-GAAP Results Reconciled to GAAP (2 of 3) The Brink’s Company and subsidiaries Non-GAAP Reconciliations 2019 (In millions, except for per share amounts) Q2 Full Year Income (loss) from continuing operations attributable to Brink's: GAAP $ 12.6 28.3 Retirement plans(c) 4.9 36.2 Venezuela operations(g) 0.4 0.9 Reorganization and Restructuring(a) 8.0 21.7 Acquisitions and dispositions(a) 23.0 88.4 Tax on accelerated income(d) - (7.3) Argentina highly inflationary impact(a) 0.1 15.9 Internal loss(a) 2.5 16.9 Reporting compliance(a) 0.3 2.0 Gain on lease termination(h) (5.2) (4.0) Income tax rate adjustment(b) (2.7) - Non-GAAP $ 43.9 199.0 EPS: GAAP $ 0.25 0.55 Retirement plans(c) 0.10 0.71 Venezuela operations(g) 0.01 0.02 Reorganization and Restructuring(a) 0.16 0.43 Acquisitions and dispositions(a) 0.45 1.73 Tax on accelerated income(d) - (0.14) Argentina highly inflationary impact(a) - 0.31 Internal loss(a) 0.05 0.33 Reporting compliance(a) 0.01 0.04 Gain on lease termination (0.10) (0.08) Income tax rate adjustment(b) (0.05) - Non-GAAP $ 0.86 3.89 Depreciation and Amortization: GAAP $ 48.7 185.0 Reorganization and Restructuring(a) - (0.2) Acquisitions and dispositions(a) (10.4) (30.9) Argentina highly inflationary impact(a) (0.3) (1.8) Non-GAAP $ 38.0 152.1 Amounts may not add due to rounding. See slide 24 for footnote explanations. 23
2019 Non-GAAP Results Reconciled to GAAP (3 of 3)
The Brink’s Company and subsidiaries
Non-GAAP Reconciliations
(In millions)                                                                                                                                2019
                                                                                                                                    Q2                  Full Year
Adjusted EBITDA(f):
Net income (loss) attributable to Brink's - GAAP                                                                          $        12.5                        29.0
  Interest expense - GAAP                                                                                                          22.7                        90.6
  Income tax provision - GAAP                                                                                                      12.7                        61.0
  Depreciation and amortization - GAAP                                                                                             48.7                       185.0
    EBITDA                                                                                                                $        96.6                       365.6
      Discontinued operations - GAAP                                                                                                 0.1                        (0.7)
      Retirement plans(c)                                                                                                            6.5                       47.3
      Venezuela operations(g)                                                                                                        0.4                         0.9
      Reorganization and Restructuring(a)                                                                                          10.6                        28.6
      Acquisitions and dispositions(a)                                                                                             12.2                        56.8
      Argentina highly inflationary impact(a)                                                                                       (0.2)                      12.7
      Internal loss(a)                                                                                                               2.6                       20.9
      Reporting compliance(a)                                                                                                        0.3                         2.1
      Gain on lease termination(h)                                                                                                  (5.2)                       (5.2)
      Income tax rate adjustment(b)                                                                                                   -                           -
      Share-based compensation(e)                                                                                                    9.7                       35.0
      Marketable securities (gain) loss(i)                                                                                          (0.5)                        2.9
        Adjusted EBITDA                                                                                                   $       133.1                       566.9

The 2021 Non-GAAP outlook amounts exclude certain forecasted Non-GAAP adjusting items, such as intangible asset amortization and U.S. retirement plan costs. We have not forecasted the impact of highly inflationary accounting on our Argentina operations in 2021 or
other potential Non-GAAP adjusting items for which the timing and amounts are currently under review, such as future restructuring actions. We have also not forecasted changes in cash held for customer obligations or proceeds from the sale of property, equipment and
investments in 2021. The 2021 Non-GAAP outlook amounts for operating profit, EPS from continuing operations, free cash flow before dividends and Adjusted EBITDA cannot be reconciled to GAAP without unreasonable effort. We cannot reconcile these amounts to GAAP
because we are unable to accurately forecast the impact of highly inflationary accounting on our Argentina operations in 2021 or other potential Non-GAAP adjusting items for which the timing and amounts are currently under review, such as future restructuring actions. We
are also unable to forecast changes in cash held for customer obligations or proceeds from the sale of property, equipment and investments in 2021.

a)   See “Other Items Not Allocated To Segments” on slide 25 for details. We do not consider these items to be reflective of our core operating performance due to the variability of such items from period-to-period in terms of size, nature and significance.
b)   Non-GAAP income from continuing operations and non-GAAP EPS have been adjusted to reflect an effective income tax rate in each interim period equal to the full-year non-GAAP effective income tax rate. The full-year non-GAAP effective tax rate was 31.4% for 2019.
c)   Our U.S. retirement plans are frozen and costs related to these plans are excluded from non-GAAP results. Certain non-U.S. operations also have retirement plans. Settlement charges related to these non-U.S. plans are also excluded from non-GAAP results.
d)   The non-GAAP tax rate excludes the 2019 foreign tax benefits that resulted from the transaction that accelerated U.S. tax in 2015.
e)   Due to reorganization and restructuring activities, there was a $7.7 million non-GAAP adjustment to share-based compensation in 2019. There is no difference between GAAP and non-GAAP share-based compensation amounts for the other periods presented.
f)   Adjusted EBITDA is defined as non-GAAP income from continuing operations excluding the impact of non-GAAP interest expense, non-GAAP income tax provision, non-GAAP depreciation and amortization, non-GAAP share-based compensation and non-GAAP marketable
     securities (gain) loss. In the fourth quarter of 2020, we changed our definition of Adjusted EBITDA to exclude non-GAAP marketable securities (gain) loss and all previously disclosed information for all periods presented has been revised.
g)   Post-deconsolidation funding of ongoing costs related to our Venezuelan operations was $0.9 million in 2019 and was expensed as incurred and reported in interest and other nonoperating income (expense). We do not expect any future funding of the Venezuela business, as
     long as current U.S. sanctions remain in effect.
h)   Gain on termination of a mining lease obligation related to former coal operations. We have no remaining mining leases.
i)   Due to the impact of Argentina highly inflationary accounting, there was a $0.1 million non-GAAP adjustment for a gain in the second quarter of 2019. There is no difference between GAAP and non-GAAP marketable securities gain and loss amounts for the other periods
     presented.

Amounts may not add due to rounding                                                                                                                                                                                                                                                 24
Non-GAAP Reconciliation – Other The Brink’s Company and subsidiaries Other Items Not Allocated to Segments (Unaudited) (In millions) Brink’s measures its segment results before income and expenses for corporate activities and for certain other items. See below for a summary of the other items not allocated to segments. Reorganization and Restructuring Other Restructurings Management periodically implements restructuring actions in targeted sections of our business. As a result of these actions, we recognized charges of $28.8 million in 2019, primarily severance costs and charges related to the modification of share-based compensation awards. Due to the unique circumstances around these charges, they have not been allocated to segment results and are excluded from non-GAAP results. Acquisitions and dispositions Certain acquisition and disposition items that are not considered part of the ongoing activities of the business and are special in nature are consistently excluded from non-GAAP results. These items are described below: 2019 Acquisitions and Dispositions • We incurred $43.1 million in integration costs related to Dunbar, Rodoban, COMEF and TVS in 2019. • Amortization expense for acquisition-related intangible assets was $27.8 million in 2019. • Transaction costs related to business acquisitions were $7.9 million in 2019. • Restructuring costs related to acquisitions, primarily Rodoban and Dunbar, were $5.6 million in 2019. • In 2019, we recognized $2.2 million in net charges, primarily asset impairment and severance costs, related to the exit from our top-up prepaid mobile phone business in Brazil. • Compensation expense related to the retention of key Dunbar employees was $1.5 million in 2019. Argentina highly inflationary impact Beginning in the third quarter of 2018, we designated Argentina's economy as highly inflationary for accounting purposes. As a result, Argentine peso-denominated monetary assets and liabilities are now remeasured at each balance sheet date to the currency exchange rate then in effect, with currency remeasurement gains and losses recognized in earnings. In addition, nonmonetary assets retain a higher historical basis when the currency is devalued. The higher historical basis results in incremental expense being recognized when the nonmonetary assets are consumed. In 2019, we recognized $14.5 million in pretax charges related to highly inflationary accounting, including currency remeasurement losses of $11.3 million. These amounts are excluded from non-GAAP results. Internal loss A former non-management employee in our U.S. global services operations embezzled funds from Brink's in prior years. Except for a small deductible amount, the amount of the internal loss related to the embezzlement was covered by our insurance. In an effort to cover up the embezzlement, the former employee intentionally misstated the underlying accounts receivable subledger data. In 2019, we incurred $4.5 million in costs (primarily third party expenses) to reconstruct the accounts receivables subledger. In the third quarter of 2019, we were able to identify $4.0 million of revenues billed and collected in prior periods which had never been recorded in the general ledger. We also identified and recorded $0.3 million in bank fees, which had been incurred in prior periods. The rebuild of the subledger was substantially completed during the third quarter of 2019. Based on the reconstructed subledger, we were able to analyze and quantify the uncollected receivables from prior periods. Although we plan to attempt to collect these receivables, we estimated an increase to bad debt expense of $13.7 million in the third quarter of 2019. The estimate of the allowance for doubtful accounts was adjusted in the fourth quarter of 2019 for an additional $6.4 million. This estimate will be adjusted in future periods, if needed, as assumptions related to the collectability of these accounts receivable change. At December 31, 2019, we have recorded an allowance of $19.2 million on $34.0 million of accounts receivable, or 56%. Due to the unusual nature of this internal loss and the related errors in the subledger data, along with the fact that management has excluded these amounts when evaluating internal performance, we have excluded these net charges from segment and non-GAAP results. Reporting compliance Certain compliance costs (primarily third party expenses) are excluded from 2019 non-GAAP results. These costs relate to the implementation and January 1, 2019 adoption of the new lease accounting standard ($1.8 million in 2019) and the mitigation of material weaknesses ($0.3 million in 2019). Amounts may not add due to rounding 25
Non-GAAP Reconciliation – Net Debt
The Brink’s Company and subsidiaries
Non-GAAP Reconciliations - Net Debt (Unaudited)
(In millions)

                                                                                      December 31,                          June 30,
(In millions)                                                                            2020                                 2021
Debt:
  Short-term borrowings                                                              $        14.2                      $        14.7
  Long-term debt                                                                           2,471.5                            2,837.7
    Total Debt                                                                             2,485.7                            2,852.4

Less:
 Cash and cash equivalents                                                                   620.9                              661.6
 Amounts held by Cash Management Services operations(a)                                      (19.1)                             (27.7)
   Cash and cash equivalents available for general corporate purposes                        601.8                              633.9

   Net Debt                                                                          $     1,883.9                      $     2,218.5

a) Title to cash received and processed in certain of our secure Cash Management Services operations transfers to us for a short period of time. The cash is
   generally credited to customers’ accounts the following day and we do not consider it as available for general corporate purposes in the management of our
   liquidity and capital resources and in our computation of Net Debt.

Net Debt is a supplemental non-GAAP financial measure that is not required by, or presented in accordance with GAAP. We use Net Debt as a measure of our
financial leverage. We believe that investors also may find Net Debt to be helpful in evaluating our financial leverage. Net Debt should not be considered as an
alternative to Debt determined in accordance with GAAP and should be reviewed in conjunction with our consolidated balance sheets. Set forth above is a
reconciliation of Net Debt, a non-GAAP financial measure, to Debt, which is the most directly comparable financial measure calculated and reported in accordance
with GAAP, December 31, 2020 and June 30, 2021.

                                                                                                                                                                   26
You can also read


