STELAR: A statistically consistent coalescent-based species tree estimation method by maximizing triplet consistency - bioRxiv
←
→
Page content transcription
If your browser does not render page correctly, please read the page content below
bioRxiv preprint first posted online Mar. 31, 2019; doi: http://dx.doi.org/10.1101/594911. The copyright holder for this preprint
 (which was not peer-reviewed) is the author/funder, who has granted bioRxiv a license to display the preprint in perpetuity.
                                It is made available under a CC-BY-ND 4.0 International license.

       STELAR: A statistically consistent coalescent-based
       species tree estimation method by maximizing triplet
                             consistency
        Mazharul Islam1 , Kowshika Sarker1 , Trisha Das1 , Rezwana Reaz2 and
                            Md. Shamsuzzoha Bayzid1,*
                         1
                         Department of Computer Science and Engineering
                       Bangladesh University of Engineering and Technology
                                     Dhaka-1205, Bangladesh
                                2
                                  Department of Computer Science
                                The University of Texas at Austin
                                         Texas 78712, USA
                                      *
                                        Corresponding author

                                                          March 31, 2019

                                                  Abstract
                  Background: Species tree estimation is frequently based on phylogenomic ap-
              proaches that use multiple genes from throughout the genome. However, estimat-
              ing a species tree from a collection of gene trees can be complicated due to the
              presence of gene tree incongruence resulting from incomplete lineage sorting (ILS),
              which is modelled by the multi-species coalescent process. Maximum likelihood and
              Bayesian MCMC methods can potentially result in accurate trees, but they do not
              scale well to large datasets.
                  Results: We present STELAR (Species Tree Estimation by maximizing tripLet
              AgReement), a new fast and highly accurate statistically consistent coalescent-
              based method for estimating species trees from a collection of gene trees. We
              formalized the constrained triplet consensus (CTC) problem and showed that the
              solution to the CTC problem is a statistically consistent estimate of the species tree
              under the multi-species coalescent (MSC) model. STELAR is an efficient dynamic
              programming based solution to the CTC problem which is very fast and highly
              accurate. We evaluated the accuracy of STELAR in comparison with MP-EST
              and ASTRAL – two of the most popular and accurate coalescent-based methods.
              Experimental results suggest that STELAR matches the accuracy of ASTRAL and
              improves on MP-EST.
                  Conclusions: Theoretical and empirical results (on both simulated and real
              biological datasets) suggest that STELAR is a valuable technique for species tree
              estimation from gene tree distributions.
                  Availability: STELAR is freely available at https://islamazhar.github.io/STELAR/.

                                                                       1
bioRxiv preprint first posted online Mar. 31, 2019; doi: http://dx.doi.org/10.1101/594911. The copyright holder for this preprint
(which was not peer-reviewed) is the author/funder, who has granted bioRxiv a license to display the preprint in perpetuity.
It is made available under a CC-BY-ND 4.0 International license.
1 Introduction
Estimated species trees are useful in many biological analyses, but accurate estimation
of species trees can be quite complicated. Species tree inference can potentially result
in accurate evolutionary history using data from multiple loci. Therefore, due to the
advent of modern sequencing technologies, it is increasingly common to infer trees by
analyzing sequences from multiple loci. However, combining multi-locus data is diffi-
cult, especially in the presence of gene tree discordance. The traditional approach to
species tree estimation is called concatenation (also known as combined analysis), which
concatenates gene sequence alignments into a supergene matrix, and then estimates the
species tree using a sequence based tree estimation technique (e.g., maximum parsimony,
maximum likelihood etc.). Although it has been used in many biological analyses, con-
catenation can be problematic as it is agnostic to the topological differences among the
gene trees, can be statistically inconsistent [1], and can return incorrect trees with high
confidence [2, 3, 4, 5].
Recent modeling and computational advances have produced methods that explicitly
take the gene tree discordance into account while combining multi-locus data to estimate
species trees. Incomplete lineage sorting (ILS), also known as deep coalescence, is one of
the most prevalent reasons for gene tree incongruence [6]. Rapid radiation is known to
happen in many organisms (for example, birds) where ILS is likely to occur [7]. Due to
this growing awareness that ILS can be present in many phylogenomic datasets, ILS-aware
species tree estimation techniques have gained substantial attention from systematists.
These types of method are usually referred to as “summary methods” as they summarize
a set of gene trees to estimate the species trees.
Several species-tree estimation methods have been proven to be statistically consistent
under the multi-species coalescent model, meaning that they will return the true species
tree with high probability given a sufficiently large number of true gene trees sampled
from the distribution defined by the species tree. Methods that are statistically consistent
under the MSC include ASTRAL [8], MP-EST [9], *BEAST [10], NJst [11], BUCKy [12],
GLASS [13], STEM [14], SNAPP [15], SVDquartets [16], STEAC [17] and ASTRID [18].
*BEAST, which is a Bayesian technique, can co-estimate both gene trees and species
trees, and simulation studies suggest that *BEAST can be considered the best of the
co-estimation methods with excellent accuracy, but it is computationally very intensive
to run on even moderately-sized dataset [19, 20]. ASTRAL and MP-EST are two of the
most accurate and widely used summary methods that are much faster than *BEAST.
ASTRAL has been shown to be faster and more accurate than MP-EST and can handle
large dataset containing hundreds of species which is not possible by MP-EST [8, 21].
ASTRAL finds a species tree that maximizes the number of consistent quartets be-
tween the species tree and the gene trees. MP-EST maximizes a pseudo-likelihood esti-
mate utilizing the underlying triplet distribution of the gene trees. Quartet and triplet
based methods are robust to the “anomaly zone” [22, 23] (a condition where the most
probable gene tree topology may not be identical to the species tree topology) as there are
no anomalous rooted three-taxon species trees [24] and no anomalous unrooted four-taxon
species trees [25, 23].
We present STELAR (Species Tree Estimation by maximizing tripLet AgReement), a
new colescent-based method which finds a species tree that agrees with the largest number
2bioRxiv preprint first posted online Mar. 31, 2019; doi: http://dx.doi.org/10.1101/594911. The copyright holder for this preprint
(which was not peer-reviewed) is the author/funder, who has granted bioRxiv a license to display the preprint in perpetuity.
It is made available under a CC-BY-ND 4.0 International license.
of triplets induced by the gene trees. STELAR is statistically consistent, fast (having a
polynoimial running time), and highly accurate – enabling genome wide phylogenomic
analyses.
2 Approach
Design of ASTRAL and other quartet-based methods [8, 26] and their proofs of being
statistically consistent is based upon the fact that unrooted 4-taxon species trees do not
contain anomaly zone [25, 27]. We use similar design in STELAR, utilizing the fact that
rooted 3-taxon species trees do not contain anomaly zone [28].
2.1 Definitions and notations
Let T be a rooted tree, leaf-labelled by species set X with n taxa. Each internal node
u in a tree T divides the set of taxa present in the subtree rooted at u into two distinct
partitions. We call this a subtree-bipartition which was originally defined in [29]. We
denote by Tu the subtree under node u of tree T . L(T ) denotes the leaves in T . r
denotes an arbitrary set of three species {a, b, c} ⊂ X , tr is a rooted tree topology on
r. We use a|bc to show that b and c are siblings. Possible three topologies on {a, b, c}
are: a|bc, b|ca, c|ab. The triplet tree topology that appears more frequently than the two
alternative topologies is called the dominant topology. T R(T ) denotes the set of n3
triplet topologies induced by the tree T . We denote by T |r the triplet tree topology
obtained by restricting T to the three species in r.
2.2 Problem definition
A natural optimization problem for estimating a species tree from a collection of gene
trees under triplet consistency would be first decomposing the input gene trees into
their induced triplets, and then estimating a species tree by amalgamating the dominant
triplets. Building such a consensus tree from a set of triplets has been shown to be an
NP-hard problem, and exact and heuristic algorithms have been proposed [30]. This
approach considers only the dominant triplets which could be problematic when the
frequencies of the alternate triplet topologies are very close to that of the dominant one,
and when all the dominant triplets are not compatible with each other meaning that all
of them do not agree with a single species tree. Moreover, this approach has to explicitly
n
enumerate and consider 3 ∗ 3 possible triplets, making it computationally expensive for
larger values of n. An alternate approach (perhaps a better one) would be to consider
the relative frequencies of all the triplets, and infer a species tree that agrees with the
largest number of triplets induced by the gene trees. Methods that do not explicitly
decompose the gene trees into induced triplets and quartets are preferred over the ones
that take a set of quartets or triplets as input, since the latter types of methods demand
high computational time and memory and thus are not scalable to large dataset [26, 8].
This is possibly one of the reasons why quartet amalgamation method like QFM [26],
despite having excellent accuracy, is not as popular as ASTRAL. Taking these issues
into consideration, we introduce a constrained version of the triplet consistency problem,
3bioRxiv preprint first posted online Mar. 31, 2019; doi: http://dx.doi.org/10.1101/594911. The copyright holder for this preprint
(which was not peer-reviewed) is the author/funder, who has granted bioRxiv a license to display the preprint in perpetuity.
It is made available under a CC-BY-ND 4.0 International license.
which we call the Constrained Triplet Consensus (CTC) problem, and formalize it as
follows.
• Input: a set G of rooted gene trees on X and a set SBP of subtree-bipartitions.
• Output: a species tree ST on X that maximizes the triplet agreement with G and
all its subtree-bipartitions are in SBP.
Note that when SBP is set to all possible subtree-bipartitions on X , the triplet
consistency problem will find the globally optimal solution (exact solution). Otherwise,
when SBP contains only the subtree-bipartitions in the input gene trees, the search space
will include only those species trees where every subtree-bipartition is present in at least
one of the gene trees in G, and we call this the constrained version or heuristic version.
Theorem 2.1. Given a set G of true gene trees, solution to the CTC problem (both exact
and constrained version) is a statistically consistent estimator of the species tree topology
under the MSC model.
Proof. Let G be a set of sufficiently large number of true gene trees that has evolved
within the model species tree T under the multi-species coalescent model. We know that
a rooted 3-taxon species tree does not have any anomaly zone [28]. So, as we increase the
number of gene trees, each triplet topology induced by the species tree will have more
frequency in G than its alternatives, with probability that approaches 1. Let wG (tr ) be the
number of trees in G that agrees with tr . Hence, for every triplet r and every possible tree
T 0 , wG (T |r) ≥ wG (T 0 |r) with probability that approaches 1 for a large enough number of
gene trees. Therefore, if T R is the set of all possible triplets on X , then
X X
wG (T |r) ≥ wG (T 0 |r).
rT R rT R
By definition, the exact solution to the CTC problem will find a tree that will maximize
the triplet agreement with G. Therefore, for a sufficiently large number of true gene trees,
the optimal tree under CTC will be identical to the true species tree T with probability
approaching one.
We now show that the solution to the constrained version is also statistically consis-
tent. If we increase the number of gene trees, with probability approaching 1, at least
one of the gene tree topologies in G will be identical to the the true species tree topology.
Therefore, with probability that tends to 1, the set SBP will contain all the subtree
bipartitions from the true species tree, and therefore the solution to the CTC problem
will be identical to the true species tree T .
2.3 Algorithmic design of STELAR
We propose a dynamic programming (DP) solution to the CTC problem. The algorith-
mic design (and corresponding theoretical results) in STELAR is structurally similar to
4bioRxiv preprint first posted online Mar. 31, 2019; doi: http://dx.doi.org/10.1101/594911. The copyright holder for this preprint
(which was not peer-reviewed) is the author/funder, who has granted bioRxiv a license to display the preprint in perpetuity.
It is made available under a CC-BY-ND 4.0 International license.
ASTRAL. This sort of DP-based approach, which implicitly finds a maximum or mini-
mum clique in a graph modelled from the input gene trees, was first used by Hallett and
Lagergren and later was used in Phylonet [31, 32], DynaDup [29, 33] and ASTRAL. The
key idea in STELAR is to find an equation for computing the number of triplets in the
gene trees that agree with a given subtree in the species tree, which ultimately enables us
to design a dynamic programming algorithm for estimating a species tree by maximizing
the triplet agreement.
We call a triplet tr = a|bc to be mapped to a subtree-bipartition at an internal node
x in T (SBP (Tx ) = X1 |X2 ) when {a, b, c} ⊆ L(Tx ), and the topology of tr is compatible
(consistent) with Tu (see Fig. 1). Each triplet mapped to a subtree-bipartition (X1 |X2 )
will have either two leaves from X1 and one leaf from X2 or two leaves from X2 and one
leaf from X1 . Therefore, we have the following results.
Figure 1: Mapping of a triplet to a subtree-bipartition. Each internal node x in
a rooted tree defines a subtree bipartition (X1 |X2 ). Each induced triplet in T maps to
a subtree-bipartition in T . This figure shows the mapping of a triplet a|bc to a subtree-
bipartition x = X1 |X2 .
Lemma 2.2. Total number of triplets mapped to a subtree-bipartition x = (X1 |X2 ) of a
rooted binary tree T , where |X1 | = n1 and |X2 | = n2 is:
n1 n2 n2 n1 n1 n2 (n1 + n2 − 2)
N T (n1 , n2 ) = + = (1)
2 1 2 1 2
Lemma 2.3. For two subtree-bipartitions x = (X1 |X2 ) and y = (Y1 |Y2 ) where (X1 ∪X2 ) ⊆
X and (Y1 ∪ Y2 ) ⊆ X , number of triplets mapped to both x and y is given by:
M(x, y) = N T (|X1 ∩ Y1 |, |X2 ∩ Y2 |) + N T (|X1 ∩ Y2 |, |X2 ∩ Y1 |). (2)
Proof. We can obtain two possible subtree bipartitions by taking pairwise intersection:
z1 = (X1 ∩ Y1 |X2 ∩ Y2 ) and z2 = (X1 ∩ Y2 |X2 ∩ Y1 ). Note that each leaf in zi (i ∈ 1, 2) is
also a leaf in both x and y, and so each triplet mapped to zi is also mapped to x and y
and the number of mapped triplets can be computed by Eqn. 1.
5bioRxiv preprint first posted online Mar. 31, 2019; doi: http://dx.doi.org/10.1101/594911. The copyright holder for this preprint
(which was not peer-reviewed) is the author/funder, who has granted bioRxiv a license to display the preprint in perpetuity.
It is made available under a CC-BY-ND 4.0 International license.
We now prove that Eqn. 2 counts a mapped triplet only once. Let tr = ab|c is mapped
to both x and y where a, b ∈ X1 , c ∈ X2 , a, b ∈ Y1 and c ∈ Y2 . Eqn. 2 will count tr for
z1 = (X1 ∩ Y1 |X2 ∩ Y2 ) only as z2 will have no element from {a, b, c}. Thus the lemma
follows.
We now see how to compute the triplet consistency (T C) score of a species tree ST
with respect to a set G of gene trees, which we denote by T CG (ST ). If SBP(T ) is the set
of subtree-bipartitions in T , for a subtree-bipartition x and a set of rooted binary trees
G, total number of triplets in G that are mapped to x is given by:
X X
T CG (x) = M(x, y). (3)
gt∈G y∈SBP(gt)
Thus, the T C score of an estimated species tree ST is obtained by,
X
T CG (ST ) = T CG (x) (4)
x∈SBP(ST )
Therefore, we can design a dynamic programming approach which starts with the
whole species set X and recursively divides it into smaller subsets and picks the partition
that maximizes the triplet consistency. At each level, we compute V (A) which gives the
score of an optimal subtree on leaf set A ⊆ X . At the end level, we have computed
V (X ) and sufficient information so that backtracking yields the corresponding subtree-
bipartitions in the optimal species tree.
2.3.1 Dynamic Programming
Base case: |A| = 1; V (A) = 0
Recursive relation: V (A) = max(A0 |A−A0 )∈X {V (A0 ) + V (A − A0 ) + T CG (A0 |A − A0 )},
where A0 |A − A0 ∈ SBP.
2.3.2 Running time analysis
Lemma 2.4. Given a set G of k gene trees on n taxa and a subtree-bipartition x, com-
puting the triplet consistency score T CG (x) takes O(n2 k) time.
Proof. A gene tree with n taxa contains O(n) subtree-bipartitions. Thus, for a set of k
input gene trees, there will be O(nk) subtree-bipartitions. To find the triplet consistency
score T CG (x) of a subtree-bipartition x using Equation 3, we need to score M(x, y) for all
subtree-bipartions y present in the input gene trees. Each subtree-bipartion is represented
by a bitset, hence calculating M(x, y) using Equation 2 takes O(n) time. Since there are
O(nk) subtree-bipartions in G, calculating T CG (x) takes O(n2 k) time.
Theorem 2.5. For a given set G of k gene trees on n taxa and a set SBP of subtree-
bipartitions, STELAR runs in O(n2 k|SBP|2 ) time.
Proof. For a specific cluster A, V (A) can be computed in O(|SBP| ∗ n2 k) time since
at worst we need to look at every subtree-bipartition in SBP, and computing T CG (x)
6bioRxiv preprint first posted online Mar. 31, 2019; doi: http://dx.doi.org/10.1101/594911. The copyright holder for this preprint
(which was not peer-reviewed) is the author/funder, who has granted bioRxiv a license to display the preprint in perpetuity.
It is made available under a CC-BY-ND 4.0 International license.
takes O(n2 k) time. Note that this is a conservative analysis since the number of subtree-
bipartitions that the DP algorithm needs to consider for computing V (A) for a specific
cluster A is, in reality, much less than |SBP| (especially for A where |A| < |X |). There
will be O(|SBP|) possible clusters for which we need to compute V (A). Thus, the running
time of STELAR is O(n2 k|SBP|2 ).
The running time of STELAR is mostly dependent on the number of subtree-bipartions
considered by the DP algorithm. In the exact version, we consider all possible subtree-
bipartions. Hence |SBP| and the running time of STELAR grows exponentially as we
increase the number of taxa. In the heuristic version, we only consider O(nk) subtree
bipartions that are present in the input gene trees. Hence, from Thm. 2.5, heuristic
version has a running time of O(n4 k 3 ).
3 Experimental Studies
We compared STELAR with ASTRAL and MP-EST, two of the most widely used and
accurate coalescent-based methods. ASTRAL has already been compared and shown
to outperform many of the existing species tree estimation methods (e.g., BUCKy-pop,
MRP, greedy consensus, CA-ML, etc.). So we did not include those methods in this
study. We ran MP-EST with 10 random starting points and selected the species tree with
the highest pseudo likelihood value. We used previously studied simulated and biological
datasets to evaluate the performance of these methods. We compare the estimated species
trees to the model species tree (for the simulated datasets) or to the scientific literature
(for the biological datasets), to evaluate accuracy. We used False Negative (FN) rate
to measure the tree error since all the trees estimated in this study are binary and so
false negative and false positive rates are identical. We performed Wilcoxon signed-rank
test (with α = 0.05) to measure the statistical significance of the differences between two
methods.
3.1 Datasets
We studied three collections of simulated datasets: one based on a biological dataset
(37-taxon mammalian dataset) that was generated and subsequently analyzed in prior
studies [8, 34, 21], and two other simulated datasets from [35, 34]. Table 1 presents a
summary of these datasets, showing various model conditions with varying numbers of
taxa (11 to 37), ILS levels (reflected in the average topological distance between true
gene trees and true species tree) and gene sequence lengths. All datasets consist of gene
sequence alignments generated under a multi-stage simulation process that begins with a
species tree, simulates gene trees down the species tree under the multi-species coalescent
model (and so can differ topologically from the species tree), and then simulates gene
sequence alignments down the gene trees.
Mammalian dataset was simulated by taking the species tree estimated by MP-EST
on the biological dataset studied in [36]. This species tree had branch lengths in coalescent
units, which we used to produce a set of gene trees under the coalescent model. Thus,
the mammalian simulation model tree has an ILS level based on a coalescent analysis of
7bioRxiv preprint first posted online Mar. 31, 2019; doi: http://dx.doi.org/10.1101/594911. The copyright holder for this preprint
(which was not peer-reviewed) is the author/funder, who has granted bioRxiv a license to display the preprint in perpetuity.
It is made available under a CC-BY-ND 4.0 International license.
Table 1: Properties of the simulated datasets. Level of ILS is presented in terms of the
average topological distance between true gene trees and true species tree.
Dataset ILS level # genes # sites # Replicates Ref.
11-taxon 85% 5 - 100 2000 20 [35]
15-taxon 82% 100 - 1000 100 - 1000 10 [34]
37-taxon 18%, 32%, 54% 25 - 800 250 -1000 20 [34]
the biological mammalian dataset, and other properties of the simulation that are set to
reflect the biological sequences Song et al. studied. We explored the impact of varying
amounts of ILS, varying numbers of genes (25 ∼ 800), the impact of phylogenetic signal
by varying the sequence length (250, 500, and 1000 base pair (bp)) for the markers. Three
levels of ILS were simulated. The basic model species tree has branch lengths in coalescent
units, and we produced other model species trees by multiplying or dividing all internal
branch lengths in the model species tree by two. This rescaling varies the amount of ILS
(shorter branches have more ILS), and also impacts the amount of gene tree estimation
error in the estimated gene trees. The basic model condition with moderate amount of
ILS is referred to as 1X and the model conditions with higher and lower amounts of ILS
are denoted by 0.5X and 2X, respectively.
We used two other simulated datasets: 11-taxon dataset (generated by [35] and
subsequently studied by [20, 37]), and 15-taxon datasets (generated and studied by [34]).
For 11-taxon dataset, we analyzed only the model condition with high amount of ILS as
the model condition with lower amount of ILS is very easy to analyze and even methods
without any statistical guarantee produced highly accurate tree with just 25 ∼ 50 gene
trees [20]. 15-taxon datasets vary in sequence lengths and has high amount of ILS.
We used two biological datasets: the 37-taxon mammalian datasets studied by Song
et al. [36] with 424 genes, and the Amniota dataset from [38] containing 16 species and
248 genes.
4 Results
4.1 Results on mammalian simulated dataset
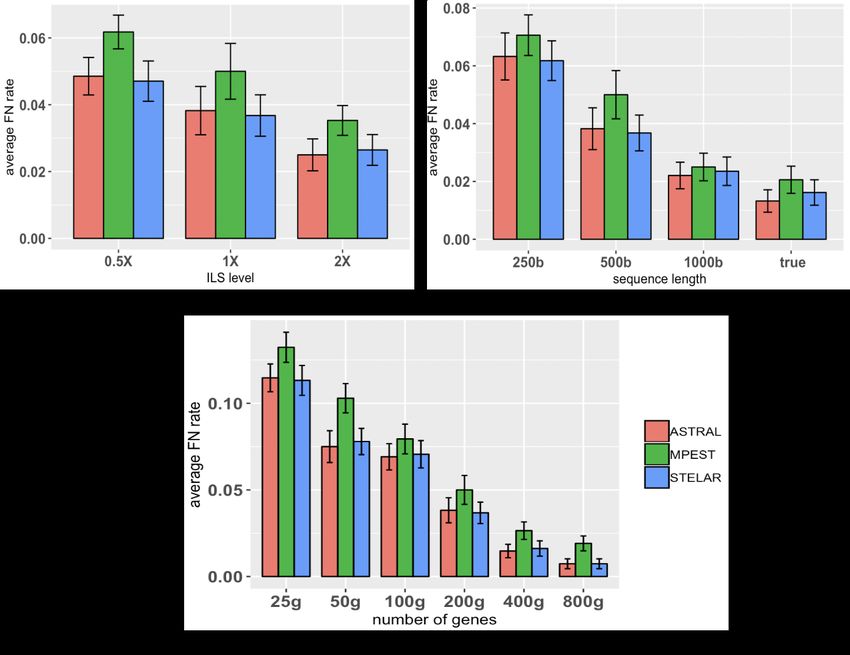
We analyzed the performance of ASTRAL, MP-EST and STELAR on various model
conditions with varying amounts of ILS, numbers of genes and lengths of the sequences.
Figure 2(a) shows the average FN rates of three methods on three model conditions with
varying amounts of ILS. For all methods, FN rates increase as we increase the amount of
ILS. STELAR and ASTRAL are better than MP-EST on all amounts of ILS and, in some
cases, the differences are statistically significant (P < 0.05). STELAR and ASTRAL are
comparable in terms of tree accuracy and no statistically significant difference was noticed.
Similar trends, in terms of relative performance, were observed when we varied the
lengths of the sequences (Fig. 2(b)). As we increase the gene sequence lengths, the
estimated gene trees become more accurate which results into lower FN rates of the
trees estimated by STELAR, ASTRAL and MP-EST. ASTRAL and STELAR are better
than MP-EST (in some cases the improvements are statistically significant). The lowest
8bioRxiv preprint first posted online Mar. 31, 2019; doi: http://dx.doi.org/10.1101/594911. The copyright holder for this preprint
(which was not peer-reviewed) is the author/funder, who has granted bioRxiv a license to display the preprint in perpetuity.
It is made available under a CC-BY-ND 4.0 International license.
Figure 2: Comparison of ASTRAL, STELAR and MP-EST on 37-taxon simu-
lated mammalian dataset. We show the average FN rates with standard error bars
over 20 replicates. (a) We fixed the sequence lenght to 500bp and number of genes to 200,
and varied the amounts of ILS. 2X model condition contains the lowest amount of ILS
while 0.5X refers to the model condition with the highest amount of ILS. (b) We varied
the amount of gene tree estimation error by varying the sequence lengths from 250 to
1000 bp, while keeping the ILS level (moderate) and the number of genes (200) fixed. (c)
We fixed the sequence length to 500bp and amount of ILS to 1X, and varied the numbers
of genes (25, 50, 100, 200, 400, 800).
9bioRxiv preprint first posted online Mar. 31, 2019; doi: http://dx.doi.org/10.1101/594911. The copyright holder for this preprint
(which was not peer-reviewed) is the author/funder, who has granted bioRxiv a license to display the preprint in perpetuity.
It is made available under a CC-BY-ND 4.0 International license.
amount of error was obtained for true gene trees. STELAR matched the accuracy of
ASTRAL.
Figure 2(c) shows the impact of the numbers of gene trees on the accuracy of the
estimated species trees. All methods improved with increasing numbers of genes (this is
expected as these methods are statistically significant and thus increasing the numbers of
genes has resulted into improved topological accuracy). STELAR and ASTRAL achieved
similar accuracy and performed significantly better than MPE ST acrossallmodelconditions.
4.2 Results on 11-taxon dataset
11-taxon dataset was simulated under a complex process to ensure substantial hetero-
geneity between genes and to deviate from the molecular clock [35]. We analyzed both
the estimated and true gene trees. In both cases, we varied the number of genes from (5
∼ 100). Figure 3 shows the results on 11-taxon dataset for both estimated and true gene
trees. As expected, all methods improved with increased numbers of genes, and had their
best accuracy on true gene trees. The accuracy of these three methods are almost similar
with no statistically significant difference. On true gene trees, these methods recovered
the true species trees across all the replicates with 50 or higher numbers of genes. Un-
like mammalian dataset, MP-EST was slightly better than ASTRAL and STELAR on
a couple of model conditions (albeit the differences are not statistically significant with
P -values greater than 0.05).
Figure 3: Average FN rates of ASTRAL, MP-EST and STELAR on the 11-
taxon dataset with high amount of ILS. We varied the numbers of genes from 5 to
100. We analyzed both the estimated and true gene trees. We show the average FN rates
with standard error bars over 20 replicates.
10bioRxiv preprint first posted online Mar. 31, 2019; doi: http://dx.doi.org/10.1101/594911. The copyright holder for this preprint
(which was not peer-reviewed) is the author/funder, who has granted bioRxiv a license to display the preprint in perpetuity.
It is made available under a CC-BY-ND 4.0 International license.
4.3 Results on 15-taxon dataset
15-taxon dataset evolved under a caterpillar model species tree with very high level of
ILS. We explored the performance on varying sequence lengths (100bp and 1000bp), and
numbers of genes (100 and 1000). ASTRAL, STELAR and MP-EST improved as the
the number of genes and sequence length increased, and had their best accuracy (FN
rate = 0) on true gene trees (Fig. 4). On 100bp alignments, ASTRAL was better than
STELAR and MP-EST and the difference was significant with 1000 genes (P < 0.05). On
1000bp alignments, no statistically significant difference was observed between STELAR
and ASTRAL. MP-EST consistently had the highest error rates across all the model
conditions on estimated gene trees. On true gene trees with 1000 genes, all the methods
recovered the true species tree across all the replicates. With 100 genes, ASTRAL and
STELAR reconstructed the true species tree on 9 replicates (out of 10), and MP-EST
recovered the true species tree on 8 replicates.
4.4 Results on Biological datasets
Amniota dataset: We analyzed the Amniota dataset from Chiari et al. [38] containing
248 genes across 16 amniota taxa in order to resolve the position of turtles within the
amniotes, especially relative to birds and crocodiles. We re-analyzed both the amino
acid (AA) and DNA gene trees, obtained from the authors, using ASTRAL, MP-EST
and STELAR. The sister relationship of crocodiles and birds (forming Archosaurs), and
placement of the turtles as the sister clade to Archosaurs are considered reliable and were
supported by previous studies [39, 40, 41].
For amino acid dataset, all the methods placed birds and crocodiles as sister groups
(forming archosaurs) and turtles as sister to archosaurs clade. However, they differed
in the placement of basal groups and resolution within the turtles. ASTRAL misplaced
Podarcis as the basal group and thus did not form the Squamates. STELAR and MP-
EST formed Squamates and rightly placed Protopterus annectens as the basal node [38].
We estimated quartet scores and triplet scores of these different tree topologies with
respect to the corresponding gene trees (see Table 2). STELAR estimated tree achieved
the highest triplet score, and interestingly it achieved the highest quartet score as well.
STELAR and MP-EST on the DNA gene trees produced the same tree which re-
solved bird/turtle/crocodile relationship as (birds,(turtles,crocodiles)) and thus did not
form Archosaurs. However, ASTRAL on the DNA gene trees resolved the relationships as
(birds,(turtles,crocodiles)). Therefore, maximizing triplet agreement and quartet agree-
ment both recovered the (birds,(turtles,crocodiles)) relationships on AA gene trees, but
differed on the DNA gene trees. MP-EST and STELAR rightly placed Protopterus an-
nectens as the outgroup while ASTRAL placed Ornithorhynchus anatinus as the basal
node. Moreover, ASTRAL did not recover the ((Homo sapiens, Monodelphis domestica),
Ornithorhynchus anatinus)) clade which was supported by previous studies [38] and was
also produced by STELAR and MP-EST. We note that previous study of this data us-
ing ASTRAL (with multi-locus bootsrapping (MLBS) [42] using 200 bootstrap replicates
instead of the maximum likelihood gene trees) reported a tree that is different in terms
of the placement of the basal nodes and resolving the relationships among Homo sapi-
ens, Monodelphis domestica and Ornithorhynchus anatinus [8]. As expected, ASTRAL
11bioRxiv preprint first posted online Mar. 31, 2019; doi: http://dx.doi.org/10.1101/594911. The copyright holder for this preprint
(which was not peer-reviewed) is the author/funder, who has granted bioRxiv a license to display the preprint in perpetuity.
It is made available under a CC-BY-ND 4.0 International license.
Figure 4: Comparison of ASTRAL, MP-EST and STELAR on the 15-taxon
dataset. We varied the numbers of estimated gene trees (100 and 1000) and sequence
lengths (100bp and 1000bp). We also anlyzed the true gene trees. We show the average
FN rates with standard errors over 10 replicates.
12bioRxiv preprint first posted online Mar. 31, 2019; doi: http://dx.doi.org/10.1101/594911. The copyright holder for this preprint
(which was not peer-reviewed) is the author/funder, who has granted bioRxiv a license to display the preprint in perpetuity.
It is made available under a CC-BY-ND 4.0 International license.
achieved the highest quartet agreement score and STELAR and MP-EST achieved the
highest triplet agreement score (Table 3 ).
caiman
turtles Caretta emys alligator
Chelonoidi chelonoidis
Gallus
Emys caretta
Taeniopygia
phrynops phrynops
crocodiles chelonoidis
alligator alligator
caretta
caiman caiman
emys
Gallus Gallus
phrynops
Taeniopygia Taeniopygia
birds Homo
Podarcis Anolis
python Monodelphis
python
Squamates Anolis podarcis Ornithorhynchus
Homo Homo Xenopus
Monodelphis Monodelphis protopterus
Ornithorhynchus Ornithorhynchus Anolis
Xenopus Xenopus python
protopterus protopterus podarcis
STELAR (AA) MP-EST (AA) ASTRAL (AA)
Taeniopygia
emys
Gallus
chelonoidis
Caiman
caretta
Alligator
phrynops
Chelonoidis
alligator
Emys
Caiman
Caretta
Gallus
Phrynops
Taeniopygia
Anolis Anolis
python Python
podarcis Podarcis
Homo Xenopus
Monodelphis Protopterus
Ornithorhynchus Monodelphis
Xenopus Homo
protopterus Ornithorhynchus
STELAR (DNA) ASTRAL (DNA)
MP-EST (DNA)
Figure 5: Analyses of the Amniota dataset (both DNA and AA gene trees)
using ASTRAL, MP-EST and STELAR. The branches that are not consistent with
existing biological beliefs are shown in red.
Mammalian dataset: We re-analyzed mammalian dataset from Song et al. containing
447 genes across 37 mammals [36] after removing 21 mislabeled genes (confirmed by the
authors), and two other outlier genes. ASTRAL, MP-EST and STELAR recovered the
same topology as shown in Fig. 6. The placement of tree shrews (Tupaia belangeri )
is of great importance here as previous studies found that the phylogenetic placement
of tree shrews is unstable as they can be classified as a sister group to Primates or to
Glires [36, 43, 44, 45]. However, our analyses using ASTRAL, MP-EST and STELAR
discovered a tree that has placed tree shrews as sister to Glires (see Fig. 6). This is
consistent to the tree estimated by CA-ML (reported in [36]). However, previous studies
with MP-EST, using multi-locus bootstrapping [42], on the same dataset recovered a
tree which placed tree shrews as the sister to Primates [45, 8]. We investigated the
quartet and triplet scores of these two alternative hypotheses and found that the tree
that suggests (tree shrew, Gliers) clade has higher quartet and triplet scores (25526915
and 3042547, respectively) compared to the one that suggests (tree shrew, Primates)
relationship which yields 25511503 and 3041747 quartet and triplet scores respectively.
13bioRxiv preprint first posted online Mar. 31, 2019; doi: http://dx.doi.org/10.1101/594911. The copyright holder for this preprint
(which was not peer-reviewed) is the author/funder, who has granted bioRxiv a license to display the preprint in perpetuity.
It is made available under a CC-BY-ND 4.0 International license.
Tool Triplet score Quartet score
ASTRAL 25132 83604
MP-EST 38385 83532
STELAR 38394 83604
Table 2: Triplet and quartet scores of the species trees estimated by ASTRAL,
MP-EST and STELAR on the amino acid (AA) gene trees in Amniota dataset.
Tool Triplet score Quartet score
ASTRAL 31162 97890
MP-EST 42448 97744
STELAR 42448 97744
Table 3: Triplet and quartet scores of the species trees estimated by ASTRAL,
MP-EST and STELAR on the DNA gene trees in Amniota dataset.
Therefore, our analyses strongly support the placement of tree shrews as sister to Glires.
4.4.1 Running time
We ran the experiments on a linux machine with 3.7 GiB RAM and 4 processors. Our
experiments show that STELAR and ASTRAL are substantially faster than MP-EST.
The running time of MP-EST is more sensitive to the number of species than the number
of genes, and grows rapidly as we increase the number of taxa [21]. On 37-taxon simu-
lated dataset with 200 genes (moderate ILS), both ASTRAL and STELAR took around
4 seconds whereas MP-EST (with 10 random starting points) took 3300 seconds (55 min-
utes). Running time of all these methods increased with increasing amounts of ILS. On
37-taxon, 0.5X dataset (high ILS) with 200 genes, ASTRAL took around 10 seconds,
STELAR took 15 seconds and MP-EST took 4800 seconds (80 minutes). This is because
the numbers of distinct quartets and triplets in the gene trees increase as we increase the
amount of discordance among the gene trees. When we increased the numbers of genes
from 200 to 800 in 1X model condition, the running time of ASTRAL increased from
4 seconds to 30 seconds, whereas STELAR took only 17 seconds. Therefore, STELAR
was the fastest method on 37-taxon, 800-gene dataset. MP-EST took about 55 minutes
and thus was not affected by the increased number of genes. On 11-taxon dataset, we
ran the exact versions of ASTRAL and STELAR, and yet the running time is much less
than MP-EST. Exact versions of ASTRAL and STELAR finished in less than a second
on 5 ∼ 50 genes and less than two seconds on 50 ∼ 100 genes, whereas the running times
of MP-EST range from 13 to 20 seconds. For 15-taxon dataset, MP-EST took 90 ∼ 100
seconds. ASTRAL and STELAR finished in less than 2 seconds on 100 gene dataset, and
for 1000 genes they took about 50 and 80 seconds, respectively.
5 Discussion
In this study, we presented STELAR – a method for estimating species trees from a set
of estimated gene trees which is statistically consistent under the multi-species coalescent
14bioRxiv preprint first posted online Mar. 31, 2019; doi: http://dx.doi.org/10.1101/594911. The copyright holder for this preprint
(which was not peer-reviewed) is the author/funder, who has granted bioRxiv a license to display the preprint in perpetuity.
It is made available under a CC-BY-ND 4.0 International license.
Chimpanzee
Human
Gorilla
Orangutan
Macaque Primates
Marmoset
Tarsier
Galagos
Mouse_Lemur
Mouse
Rat
Kangaroo_Rat
Guinea_Pig Glires
Squirrel
Rabbit
Pika
Tree_Shrew
Cow
Dolphin
Pig
Alpaca
Cat
Dog
Horse
Microbat
Megabat
Hedgehog
Shrew
Elephant
Hyrax
Lesser_Hedgehog_Tenrec
Armadillos
Sloth
Opossum
Wallaby
Platypus
Chicken
Figure 6: Analyses of the mammalian dataset using ASTRAL, MP-EST and
STELAR. All these methods generated the same tree topology.
15bioRxiv preprint first posted online Mar. 31, 2019; doi: http://dx.doi.org/10.1101/594911. The copyright holder for this preprint
(which was not peer-reviewed) is the author/funder, who has granted bioRxiv a license to display the preprint in perpetuity.
It is made available under a CC-BY-ND 4.0 International license.
model. We formalized the constrained triplet consensus (CTC) problem and showed that
the solution to the CTC problem is a statistically consistent estimator of the species
tree under the MSC model. STELAR is a dynamic programming solution to the CTC
problem. STELAR has an exact version (which provides the exact solution and takes
exponential amount of time) as well as an efficient polynomial time heuristic version.
We compared STELAR with ASTRAL and MP-EST (two of the most accurate and
widely used coalescent-based species tree estimation methods) on both simulated and
real biological dataset.
Our experiments on Amniota and mammalian biological dataset suggest that STE-
LAR can produce reliable trees on real biological dataset. STELAR produced more
reliable trees than ASTRAL on the Amniota dataset with AA gene trees, and achieved
the highest triplet and quartet agreement scores. On the mammalian dataset, STELAR,
MP-EST and ASTRAL returned the same tree topology. Extensive experimental studies
on simulated dataset with varying model conditions suggest that STELAR improved on
MP-EST in most of the cases and matched the accuracy of ASTRAL. Thus, within the
scope of the experiments conducted in this study, maximum triplet agreement has been
shown to be a better optimization criterion than the triplet frequency based maximum
pseudo-likelihood used in MP-EST, and as good as the maximum quartet agreement cri-
terion used in ASTRAL. We believe this study represents significant contributions, and
STELAR would be considered as a useful tool in phylogenomics.
STELAR can consistently estimate the species tree topology and is fast enough to
handle large numbers of genes and species, making it suitable for large scale phyloge-
nomic analyses. Our algorithm also allows missing sequences for some genes. However,
STELAR can be expanded in several directions. Future work will need to investigate how
the estimation of branch lengths (in coalescent unit) can be incorporated in STELAR.
STELAR, at this stage, cannot handle unrooted and non-binary gene trees. Future works
on formalizing the CTC problem for unrooted and non-binary gene trees and developing
appropriate algorithms will be of great importance.
References
[1] Sebastien Roch and Mike Steel. Likelihood-based tree reconstruction on a concate-
nation of aligned sequence data sets can be statistically inconsistent. Theoretical
population biology, 100:56–62, 2015.
[2] L S Kubatko and J H Degnan. Inconsistency of phylogenetic estimates from con-
catenated data under coalescence. Syst Biol, 56:17, 2007.
[3] Scott V Edwards, Liang Liu, and Dennis K Pearl. High-resolution species trees with-
out concatenation. Proceedings of the National Academy of Sciences, 104(14):5936–
5941, 2007.
[4] A D Leaché and B Rannala. The accuracy of species tree estimation under simula-
tion: a comparison of methods. Syst Biol, 60(2):126–137, 2011.
16bioRxiv preprint first posted online Mar. 31, 2019; doi: http://dx.doi.org/10.1101/594911. The copyright holder for this preprint
(which was not peer-reviewed) is the author/funder, who has granted bioRxiv a license to display the preprint in perpetuity.
It is made available under a CC-BY-ND 4.0 International license.
[5] Michael DeGiorgio and James H Degnan. Fast and consistent estimation of species
trees using supermatrix rooted triples. Molecular biology and evolution, 27(3):552–
569, 2009.
[6] W. P. Maddison. Gene trees in species trees. Systematic Biology, 46:523–536, 1997.
[7] Erich D Jarvis, Siavash Mirarab, Andre J Aberer, Bo Li, Peter Houde, Cai Li,
Simon YW Ho, Brant C Faircloth, Benoit Nabholz, Jason T Howard, et al. Whole-
genome analyses resolve early branches in the tree of life of modern birds. Science,
346(6215):1320–1331, 2014.
[8] Siavash Mirarab, Rezwana Reaz, Md S Bayzid, Théo Zimmermann, M Shel Swenson,
and Tandy Warnow. ASTRAL: genome-scale coalescent-based species tree estima-
tion. Bioinformatics, 30(17):i541–i548, 2014.
[9] Liang Liu, Lili Yu, and Scott V Edwards. A maximum pseudo-likelihood approach
for estimating species trees under the coalescent model. BMC Evolutinary Biology,
10:302, 2010.
[10] J Heled and A J Drummond. Bayesian inference of species trees from multilocus
data. Mol Biol Evol, 27:570–580, 2010.
[11] Liang Liu and Lili Yu. Estimating species trees from unrooted gene trees. Systematic
Biology, 60(5):661–667, 2011.
[12] B Larget, S K Kotha, C N Dewey, and C Ané. BUCKy: Gene tree/species tree
reconciliation with the Bayesian concordance analysis. Bioinf, 26(22):2910–2911,
2010.
[13] E Mossel and S Roch. Incomplete lineage sorting: consistent phylogeny estimation
from multiple loci. IEEE Comp Biol Bioinform, 7(1):166–171, 2011.
[14] L S Kubatko, B C Carstens, and L L Knowles. Stem: Species tree estimation using
maximum likelihood for gene trees under coalescence. Bioinf, 25:971–973, 2009.
[15] David Bryant, Remco Bouckaert, Joseph Felsenstein, Noah A Rosenberg, and
Arindam RoyChoudhury. Inferring species trees directly from biallelic genetic mark-
ers: bypassing gene trees in a full coalescent analysis. Molecular biology and evolu-
tion, 29(8):1917–1932, 2012.
[16] Julia Chifman and Laura Kubatko. Quartet inference from snp data under the
coalescent model. Bioinformatics, 30(23):3317–3324, 2014.
[17] Liang Liu, Lili Yu, Dennis K Pearl, and Scott V Edwards. Estimating species
phylogenies using coalescence times among sequences. Systematic biology, 58(5):468–
477, 2009.
[18] Pranjal Vachaspati and Tandy Warnow. Astrid: accurate species trees from intern-
ode distances. BMC genomics, 16(10):S3, 2015.
17bioRxiv preprint first posted online Mar. 31, 2019; doi: http://dx.doi.org/10.1101/594911. The copyright holder for this preprint
(which was not peer-reviewed) is the author/funder, who has granted bioRxiv a license to display the preprint in perpetuity.
It is made available under a CC-BY-ND 4.0 International license.
[19] Brian Tilston Smith, Michael G Harvey, Brant C Faircloth, Travis C Glenn, and
Robb T Brumfield. Target capture and massively parallel sequencing of ultracon-
served elements for comparative studies at shallow evolutionary time scales. System-
atic biology, 63(1):83–95, 2013.
[20] Md Shamsuzzoha Bayzid and Tandy Warnow. Naive binning improves phylogenomic
analyses. Bioinformatics, 29(18):2277–2284, 2013.
[21] Md Shamsuzzoha Bayzid, Tyler Hunt, and Tandy Warnow. Disk covering methods
improve phylogenomic analyses. BMC genomics, 15(6):S7, 2014.
[22] J H Degnan and N A Rosenberg. Discordance of species trees with their most likely
gene trees. PLoS Genetics, 2:762 – 768, 2006.
[23] James H Degnan. Anomalous unrooted gene trees. Systematic biology, 62(4):574–
590, 2013.
[24] J H Degnan and N A Rosenberg. Gene tree discordance, phylogenetic inference and
the multispecies coalescent. Trends Ecology Evolution, 26(6), 2009.
[25] E S Allman, J H Degnan, and J A Rhodes. Identifying the rooted species tree
from the distribution of unrooted gene trees under the coalescent. J Math Biol,
62(6):833–862, 2011.
[26] Rezwana Reaz, Md Shamsuzzoha Bayzid, and M Sohel Rahman. Accurate phy-
logenetic tree reconstruction from quartets: A heuristic approach. PLoS One,
9(8):e104008, 2014.
[27] J. H. Degnan. Anomalous unrooted gene trees. Systematic Biology, 62(4):574–590,
2013.
[28] J H Degnan and N A Rosenberg. Gene tree discordance, phylogenetic inference and
the multispecies coalescent. Trends Ecology Evolution, 26(6), 2009.
[29] M. S. Bayzid, S. Mirarab, and T. Warnow. Inferring optimal species trees under
gene duplication and loss. In Proc. of Pacific Symposium on Biocomputing (PSB),
volume 18, pages 250–261, 2013.
[30] Bang Ye Wu. Constructing the maximum consensus tree from rooted triples. Journal
of Combinatorial Optimization, 8(1):29–39, 2004.
[31] C. V. Than and L. Nakhleh. Species tree inference by minimizing deep coalescences.
PLoS Comp. Biol., 5(9), 2009.
[32] Yun Yu, Tandy Warnow, and Luay Nakhleh. Algorithms for mdc-based multi-locus
phylogeny inference: beyond rooted binary gene trees on single alleles. Journal of
Computational Biology, 18(11):1543–1559, 2011.
[33] M. S. Bayzid and T. Warnow. Gene tree parsimony for incomplete gene trees:
addressing true biological loss. Algorithms for Molecular Biology, 13:1, 2018.
18bioRxiv preprint first posted online Mar. 31, 2019; doi: http://dx.doi.org/10.1101/594911. The copyright holder for this preprint
(which was not peer-reviewed) is the author/funder, who has granted bioRxiv a license to display the preprint in perpetuity.
It is made available under a CC-BY-ND 4.0 International license.
[34] Siavash Mirarab, Md Shamsuzzoha Bayzid, Bastien Boussau, and Tandy Warnow.
Statistical binning enables an accurate coalescent-based estimation of the avian tree.
Science, 346(6215):1250463, 2014.
[35] Y Chung and C Ané. Comparing two Bayesian methods for gene tree/species tree
reconstruction: A simulation with incomplete lineage sorting and horizontal gene
transfer. Syst Biol, 60(3):261–275, 2011.
[36] Sen Song, Liang Liu, Scott V Edwards, and Shaoyuan Wu. Resolving conflict in
eutherian mammal phylogeny using phylogenomics and the multispecies coalescent
model. Proceedings of the National Academy of Sciences, 109(37):14942–14947, 2012.
[37] Md Shamsuzzoha Bayzid and Tandy Warnow. Estimating optimal species trees from
incomplete gene trees under deep coalescence. Journal of Computational Biology,
19(6):591–605, 2012.
[38] Ylenia Chiari, Vincent Cahais, Nicolas Galtier, and Frédéric Delsuc. Phylogenomic
analyses support the position of turtles as the sister group of birds and crocodiles
(archosauria). Bmc Biology, 10(1):65, 2012.
[39] Rafael Zardoya and Axel Meyer. Complete mitochondrial genome suggests diapsid
affinities of turtles. Proceedings of the National Academy of Sciences, 95(24):14226–
14231, 1998.
[40] Andrew F Hugall, Ralph Foster, and Michael SY Lee. Calibration choice, rate
smoothing, and the pattern of tetrapod diversification according to the long nuclear
gene rag-1. Systematic biology, 56(4):543–563, 2007.
[41] Naoyuki Iwabe, Yuichiro Hara, Yoshinori Kumazawa, Kaori Shibamoto, Yumi Saito,
Takashi Miyata, and Kazutaka Katoh. Sister group relationship of turtles to the
bird-crocodilian clade revealed by nuclear dna–coded proteins. Molecular Biology
and Evolution, 22(4):810–813, 2004.
[42] Tae-Kun Seo. Calculating bootstrap probabilities of phylogeny using multilocus
sequence data. Molecular biology and evolution, 25(5):960–971, 2008.
[43] B. Boussau, G. J. Szöllősi, L. Duret, M. Gouy, E. Tannier, and V. Daubin. Genome-
scale coestimation of species and gene trees. Genome Research, 23(2):323–330, 2013.
[44] Vikas Kumar, Björn M Hallström, and Axel Janke. Coalescent-based genome analy-
ses resolve the early branches of the euarchontoglires. PLoS One, 8(4):e60019, 2013.
[45] Siavash Mirarab, Md Shamsuzzoha Bayzid, and Tandy Warnow. Evaluating sum-
mary methods for multilocus species tree estimation in the presence of incomplete
lineage sorting. Systematic Biology, 65(3):366–380, 2014.
19You can also read


