10 Bedford CONFIDENTIAL OFFERING MEMORANDUM - LoopNet
←
→
Page content transcription
If your browser does not render page correctly, please read the page content below
10 Bedford
  Square
 CONFIDENTIAL OFFERING MEMORANDUM
BROCHURE
10 Bedford Square
Pittsburgh, PA 15203

    FOR SALE > 8,500 SF LOFT OFFICE BUILDING
               WITH PARKING LOT
            ASKING PRICE: $1,950,000
    INCLUDES AN ADJACENT 19 CAR PARKING LOT
   KEY FEATURES/HIGHLIGHTS                                                   CONTACT US
   > 2,800 +/- SF on three (3) levels - full basement with additional        GREGG BROUJOS
     conference room, kitchen, bathroom and file storage
                                                                             REGIONAL PRINCIPAL | PITTSBURGH
   > High ceilings, exposed brick and wood beams & columns throughout        INVESTMENT SERVICES
                                                                             412 515 8523
   > 4-stop freight elevator                                                 gregg.broujos@colliers.com
   > Original sliding metal doors throughout
   > Large windows and abundant natural light on every floor                 MICHELLE DOMEISEN SIOR, CCIM
                                                                             SENIOR VICE PRESIDENT | PITTSBURGH
   > 1st and 2nd floors are a combination of private offices and open work   INVESTMENT SERVICES
     space; third floor is wide open work space with shower facility         412 515 8544
                                                                             michelle.domeisen@colliers.com
   > Two (2) restrooms on each floor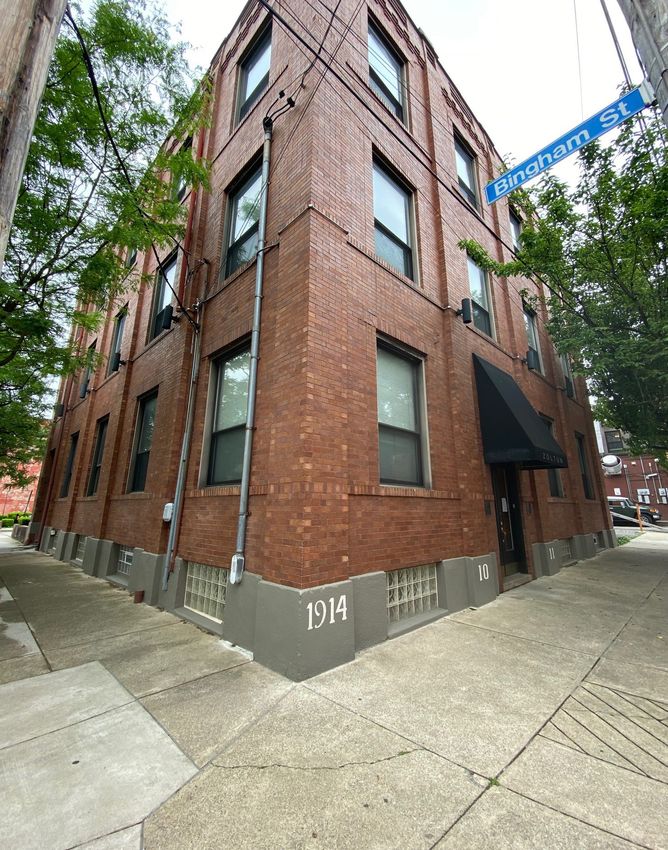
Carnegie
                                                                                                                                                                    Mellon
                                                                                                                                                                   University
                                                                                                                                                                    (CMU)
                                                                                                                      University of
                                                                                                                       Pittsburgh
                                                                                                                         (PITT)

       Pittsburgh’s CBD

      LOCATION HIGHLIGHTS
      > Prime location in the historic and charming Bedford Square area located in
        the popular South Side Flats neighborhood in the City of Pittsburgh
      > 20 Minute walk to Downtown Pittsburgh
      > Less than one (1) mile from Duquesne University
      > Less than three (3) miles from University of Pittsburgh and Carnegie Mellon
        University
      > One (1) mile from Downtown Pittsburgh
      > Minutes to Liberty Bridge entrance for access to Route 51 and I-579

       DEMOGRAPHICS

                                                                                               1 Mile            3 Miles              5 Miles        7 Miles

       Population                                                                              25,566            160,021              399,821        625,910

       Number of Households                                                                       9,717           68,681              179,737            281,914

       Est. Average Household Income (2020)                                                 $63,008              $72,202              $81,413        $81,708

       Employees                                                                             100,540             284,365              378,682        472,672

This document/email has been prepared by Colliers International for advertising and general information                    COLLIERS INTERNATIONAL
only. Colliers International makes no guarantees, representations or warranties of any kind, expressed
or implied, regarding the information including, but not limited to, warranties of content, accuracy and                   525 William Penn Place
reliability. Any interested party should undertake their own inquiries as to the accuracy of the information.
Colliers International excludes unequivocally all inferred or implied terms, conditions and warranties arising             Suite 3510
out of this document and excludes all liability for loss and damages arising there from. This publication is               Pittsburgh, PA 15219
the copyrighted property of Colliers International and /or its licensor(s). © 2016. All rights reserved. This
communication is not intended to cause or induce breach of an existing listing agreement.                                  www.colliers.com/pittsburgh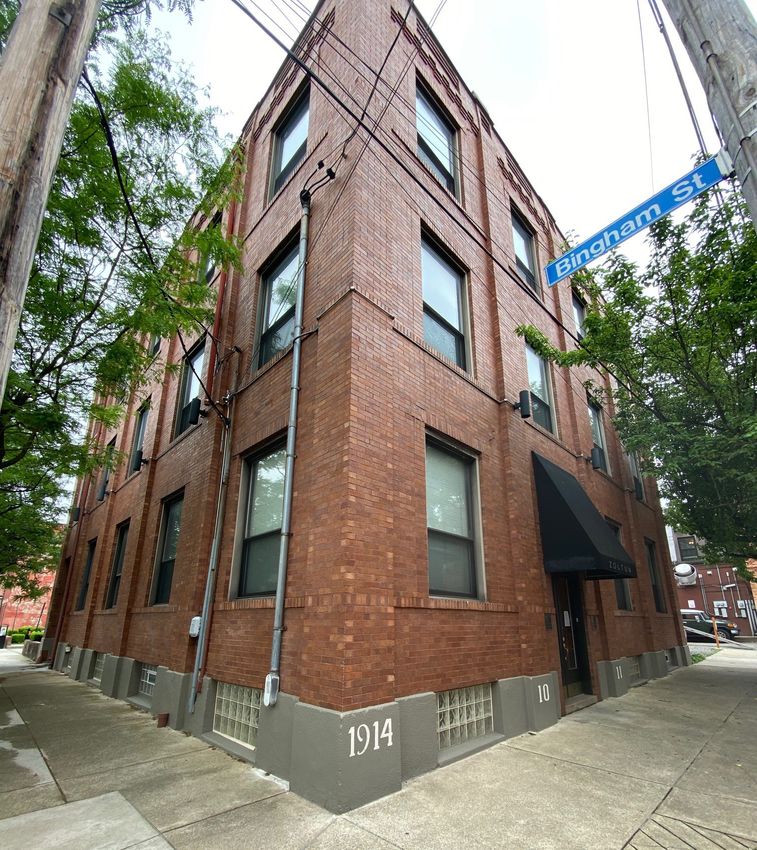
TABLE OF
CONTENTS

1   FLOOR PLANS

2   PARKING LOT SURVEY

3   PROPERTY OVERVIEW

4   PROPERTY PHOTOS

5   SOUTH SIDE OVERVIEW

6   PITTSBURGH REGIONAL OVERVIEW

7   MAPS >> RETAIL & SOUTHWESTERN PA

8   DEMOGRAPHICS
1 Floor Plans
1st Floor

2nd Floor
1 Floor Plans
3rd Floor
2Parking Lot Survey
                                              I                                                                   3-H-2?>6       I
      BLOCK J- H, LOl 22�                                                                                   D 8 V 3830 PC S S4
      D.B.\J. 10.371 PC,?>76                  I           I             I                  I                     7/28/196(}      I
             4/27 / 1��8
                                           sAlJ�� �!AX/o7i\brs                          l                JO -N J/\REMEN K D. ET    X
       NARIE H HOLSINGER
                  Ta                          IPBY 12ql PC 15D I
                                                                                                                     10
                                                                                                           J DH N H01HU1   E1  U
                                                                                                                                 J

              PPwl( LfD
             IS _§8_) ! 'DO t. -----
                                                                                 JI                                              l
-----�-------�        ----l--

                                                                                        T
                                                                                  0
                               ALL FY WA y
                                                                                           ,.

                                                              -     ���                �

                                                                                                -i,:--
                                                      >1.                  -;--

                   __Q                                        IT£AI F

                   CH,
                     ;.1/N UAlK F£NCE
                   OVER O '-!5-1/2 �  � ,/-WN LINK f_N([

                               {
                               l
                                                                                                                                     PBV

                                                               VA CANT L,i:Vu

                                   I
                                           l..J
                                                          FIRST DESCRIBED
                                   I
                                           c::::i '
                                           �CJ                     C{)II; !?.J.,N:NC                                                      ::.-1
                                           ��                   5 lDD 5{)FT OR                                                       DB V 5'
                                           � L.r{'                0 f3i ACR£S                                                            5/1
                                           � �                                                                                        NICOLI\•
                                           �
                                                                                                                                      CHARLE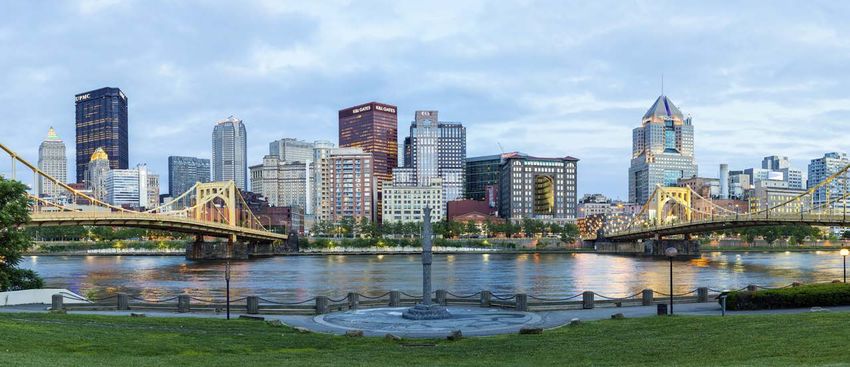
3Property Overview
ADDRESS:				                  10 Bedford Square, Pittsburgh, PA 15203

MUNICIPALITY:				City of Pittsburgh

ZONING:				                   Building: LNC – Local Neighborhood Commercial

Parking Lot: 				             NDI – Neighborhood Industrial

TAX IDENTIFICATION NUMBERS:   Building: 3-H-184 and 3-H-182

Parking Lot: 				             3-H-247

PROPERTY TAXES PER YEAR:		    $26,526.67 (face amount)

ASSESSMENT VALUE:			 3-H-184 = $1,092,000
					3-H-182 = $4,400
					3-H-247 = $57,000

HVAC UNITS:				Six (6)

NUMBER OF BATHROOMS:		        Seven (7); two on each floor and one in the basement; one of the bathrooms
					                         on the third floor has a shower stall

PARKING SPACES:			            19 – adjacent parking lot; self park

ELEVATOR:				                 Freight with four (4) stops

ROOF:					Rubber; age unknown

FLOOR SIZE:				               2,820 square feet per floor on three above-ground levels

BASEMENT:				                 Full basement with additional conference room, kitchen, lounge, file storage
					                         area, mechanical room, and dry storage

WINDOWS:				                  Double pane aluminum clad

                                                                                               601 S GRANT ST | 9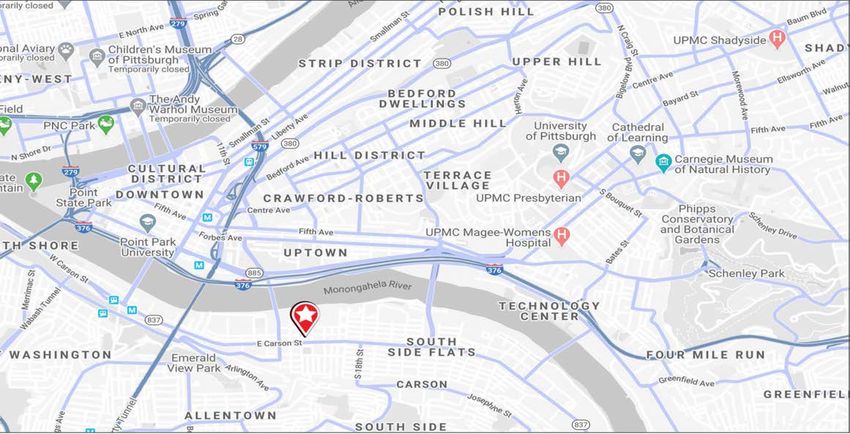
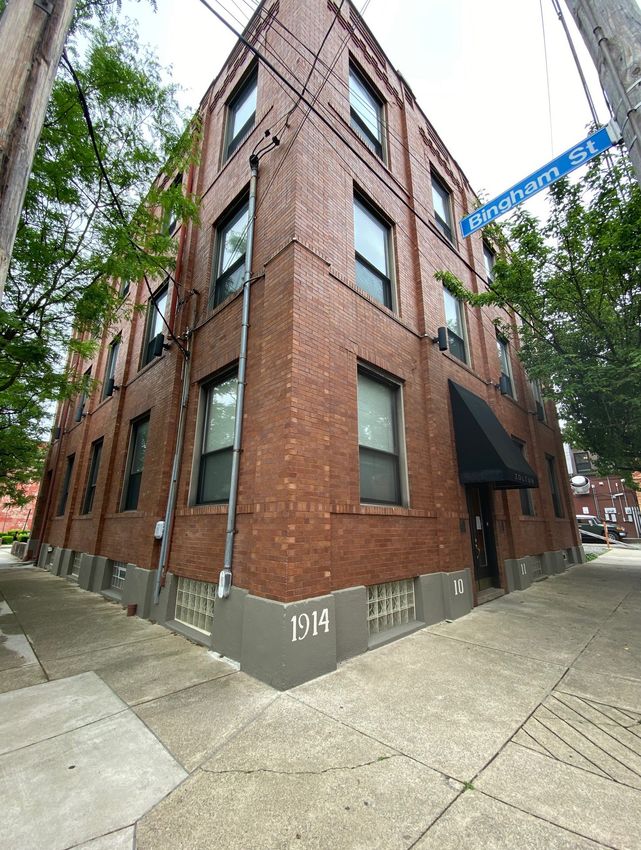
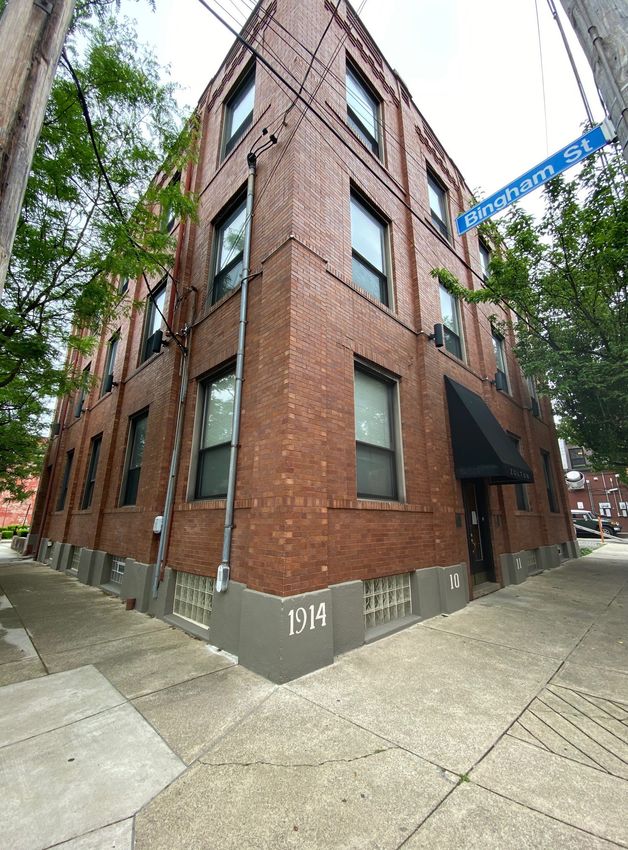
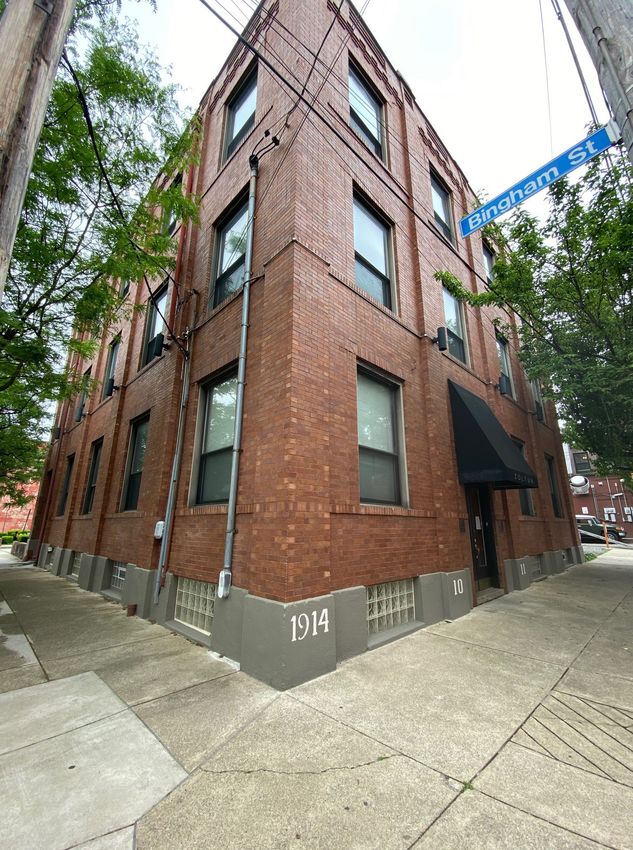
4Property Photos
4Property Photos
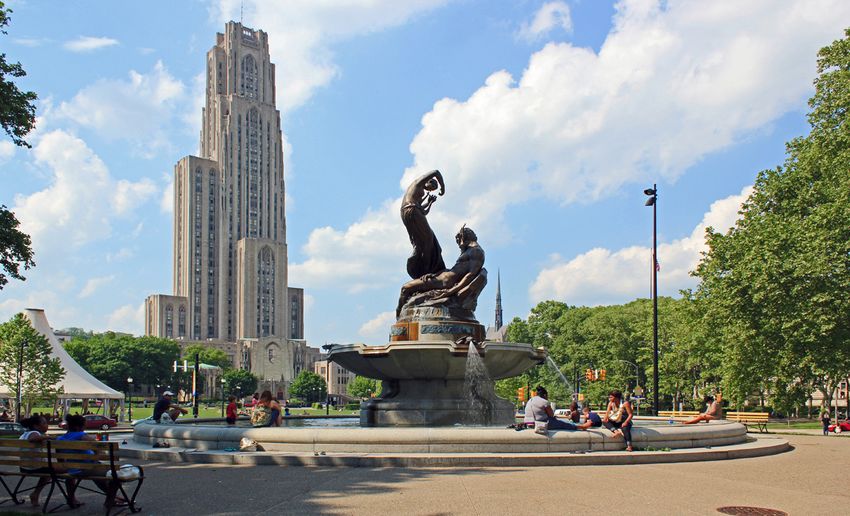
5South Side Overview
Pittsburgh's South Side neighborhood offers cultural diversity and a rich history that provides an exciting urban
feel. It is located along the Monongahela River within miles of Pittsburgh’s Central Business District and is well
connected with public transportation and is in close proximity to several major roadways.

South Side offers an array of dining, shopping and entertainment options. The dining experience can be
inexpensive and casual or if you prefer a less casual dinner there is several options for upscale dining. For your
shopping pleasure you can take advantage of the unique shops along the historic shopping district, or you could
go to South Side Works which is a very large open-air retail complex located on the river front which offers
prime shopping, dining and entertainment. The retail complex offers plenty of dining options, ample shopping
alternatives and for your entertainment it includes a movie theater.
6Pittsburgh Regional Overview
PITTSBURGH ACCOLADES
Pittsburgh has consistently ranked among the top places to live, work, and visit in the United States. A
competitive cost of doing business, an educated, skilled workforce, academic, corporate, and government
research and development, and ample energy resources are pooled in the vicinity. The Pittsburgh vicinity not
only boasts access to 50%+ of the United States buying power within 500 miles, with connectivity to those
resources through 18 commercial railroad systems, interstate highway access, and the Pittsburgh International
airport. Out of the top 40 MSA's in the United States, Pittsburgh ranked 18th in venture capital investment
dollars per capita and 5th in deals per million residents.

> Pittsburgh International Airport as one of the most innovative companies in the world, the first time an airport
  has landed among the list of industry-changing firms - Fast Company 2020

> Ranked Pittsburgh as the seventh-best city in the United States to launch a career - LinkedIn 's Economic
  Graph Team 2020

> Named Pittsburgh among the top 20 cities in the United States for people on bicycles - People for Bikes, (one
  of the nation’s leading organizations dedicated to making bicycling safer, more convenient and appealing for everyone)
  2020

> UPMC Children’s Hospital of Pittsburgh ranked No. 9 on the 2020-21 U.S. News & World Report Honor Roll
  of America’s Best Children’s Hospitals, earning high marks in cardiology and heart surgery, diabetes and
  endocrinology, gastroenterology and gastroenterology surgery and pulmonology.

> 5th best city for STEM professionals says - WalletHub 2019

> Pittsburgh is included in the 3rd largest megaregion in the world according to - Global Metro Monitor 2019

> One of the seven best cities for Gen Xers - Nature World News 2019

> Ranked sixth among the top 10 large college cities in America - WalletHub 2019

> Pittsburgh International Airport is one of the best airports in the U.S. for long layovers - Budget Travel 2019

> Pittsburgh International Airport as one of the top 10 best domestic airports - Travel+Leisure 2019
6Pittsburgh Regional Overview

> Ranked among the top three best cities in the U.S. for first-time homebuyers - Lending Tree 2019

> One of the best cities for jobs - WalletHub 2019

> Pittsburgh fourth among the 10 Most Welcoming Cities in the U.S. - Budget Travel 2019

> One of the top 20 U.S. cities to retire - U.S. News & World Report 2019

> Ranks in the top 20 big cities to live in - WalletHub 2019

> Pittsburgh a top U.S. destination for good food - Yelp 2019

> Pittsburgh made the list of 25 up-and-coming startup cities projected to grow into the hubs of the
  future - Valuer's 2019

> One of the most walkable cities in the U.S. - TravelPulse 2019

> PNC Park ranked as having the best ballpark atmosphere in the MLB - Seatgeek 2019

> Pittsburgh ranks No. 6 for best skyline views in the U.S.- Thrillist 2019

> The Monongahela Incline makes the list for the world’s coolest public transit rides - Atlas Obscura 2019

> Pittsburgh is the only U.S. city in the London issue of National Geographic Traveller’s cool cities to visit in 2019
6Pittsburgh Regional Overview

    VENTURE CAPITAL INVESTMENTS IN PITTSBURGH
     START-UPS DOUBLED IN 2019 FROM 2018 TOTAL
MARKET FUNDAMENTALS
PITTSBURGH                                                   for 2% of domestic gas supply, but this figure jumped to
Pittsburgh, an historically stable market, rebounded         nearly 18% at the end of 2015. Marcellus Shale is now
vigorously from the economic downturn of 2008.               thought to contain 500 trillion cubic feet of natural gas.
Pittsburgh’s economy has consistently out-performed          Due in part to this resource, the oil giant Shell announced
the national economy. The Downtown office market has         in 2016 that it will build a $6 billion “ethane cracker”
seen similar success. Greater Downtown, including the        plant along the Ohio River near Pittsburgh. 2015. Dubbed
CBD, is the leading submarket accounting for nearly          a “super-giant” find by energy companies, Marcellus
36% of Pittsburgh’s total office inventory and is known      Shale is now thought to contain 500 trillion cubic feet of
for achieving some of the highest rental rates. Pittsburgh   natural gas. Due in part to this resource, the oil giant
is headquarters for six Fortune 500 companies.               Shell announced in 2016 that it plans to build a $6 billion
                                                             “ethane cracker” plant along the Ohio River near
ENERGY                                                       Pittsburgh. packaging to automotive parts. The plant will
The Pittsburgh region has been a major U.S. energy hub       employ about 600 people permanently. Additionally, in
for more than a decade, and the energy, oil and gas          October of 2014 Chevron announced a $20M donation
industry has continued to be one of the area’s most          to workforce development and STEM education in the
prominent job growth sectors. The Marcellus Shale            Pittsburgh tri-state area.
formation’s ample supply of natural gas has been an
enormous factor in the region’s impact on the energy         The company chose the site because of its proximity to
industry. In 2007, the Marcellus Shale sector accounted      liquids-rich natural gas, which will create shorter and
6Pittsburgh Regional Overview more reliable supply chains than comparable facilities the types of highly trained workers used by financial firms, on the U.S. Gulf Coast. Construction of this facility will with financial employment growing over 7% since 2009. create an estimated 6,000 construction jobs and be Commonwealth Financial. Financial services is the largest the equivalent to the construction of 25 major sports contributor to the regional GDP, according to the Allegheny stadiums. Commercial operation, due to begin early in Conference. The area has begun to lure the types of highly the next decade, is slated to make 1.6 million tonnes a trained workers used by financial firms, with financial year of ethylene which is used in products ranging employment growing over 7% since 2009. from food packaging to automotive. FINANCE & BUSINESS SERVICES There are several significant financial, banking, and corporate headquarters in Pittsburgh, which was rated by Forbes as the #2 City Taking Financial Jobs from Wall Street. Most notably in the banking sectors are PNC Bank, First National Bank, and the Bank of New York Mellon. Five Pittsburgh-based banks made the list of Bank Director’s top U.S. Banks, including PNC Bank, First National Bank, and First Commonwealth Financial. Financial services is the largest contributor to the regional GDP, according to the Allegheny Conference. The area has begun to lure
6Pittsburgh Regional Overview
HEALTHCARE & LIFE SCIENCES
With a total annual payroll of $6.8 billion and 106,000
employees, health services is by far the largest industry
subcluster in the Pittsburgh area. Other industries that
comprise the life sciences include bioresearch
establishments, pharmaceutical companies, and medical
equipment and supply manufacturers. According to the
Pittsburgh Regional Alliance, in the healthcare and life
sciences sector there are over 132,000 people employed
in 5,400 firms with 114 expansions and relocations since
2007. There is a $700M+ annual investment in life
sciences research and development in the Pittsburgh          insurance, dental insurance, vision care and
area, and over 4,700 healthcare-related degrees              reinsurance. Highmark and its affiliates operate health
annually.                                                    insurance plans in Pennsylvania,

Two of the most prominent players in Pittsburgh’s            Delaware and West Virginia that serve 5.2 million
healthcare industry are UPMC and Highmark. UPMC is           members and employ approximately 18,000 people.
the number one hospital system in Pennsylvania, as well      Highmark is among the largest health insurers in the
as the largest non-governmental employer, with over          United States and is the fourth largest Blue Cross and
65,000 employees. A nonprofit that melds an unwavering       Blue Shield-affiliated company. Highmark is an
community mission with entrepreneurial business              independent licensee of the Blue Cross and Blue Shield
models, UPMC is also a recognized innovator in medical       Association, an association of independent Blue Cross
information in the United States through its business in     and Blue Shield companies. 2015 consolidated
health insurance, dental insurance, vision care and          revenues for the organization were $17.7 billion. For 75
insurance. UPMC operates more than 25 academic,              years, Highmark has helped build healthier, stronger
community, and specialty hospitals, 600 doctors’ offices     communities, including the greater community of
and outpatient sites, employs 3,600 physicians, and          Pittsburgh which has benefited immensely from
offers an array of rehabilitation, retirement, and long-     Highmark's presence.
term care facilities. It is currently ranked No. 12 in the
nation on the U.S. News & World Report Honor Roll of         The Pittsburgh Life Sciences Greenhouse is an
America’s Best Hospitals – with 15 adult specialties         investment firm that specifically provides resources
ranked.                                                      and tools to entrepreneurial life sciences enterprises
Highmark Inc. and its affiliates operate health insurance    in Pittsburgh to advanced research and patient care.
technology. Highmark is a national, diversified health       Since PLSG began operations in 2002, it has assisted
care partner based in Pittsburgh that serves members         more than 435 life science companies and has affected
across the United States through its businesses in health    more than 10,000 jobs in the greater Pittsburgh area.
                                                             PLSG has provided 34 companies with office or
                                                             laboratory space, and 14 have been relocated to
                                                             Pittsburgh from outside of the region. PLSG has
                                                             invested over $20 million in 77 companies, which has
                                                             leveraged over $1.5 billion in additional capital to the
                                                             region.
6Pittsburgh Regional Overview
TECHNOLOGY & ROBOTICS and rich pipeline of world-class talent has allowed Google
Outside of Silicon Valley, Pittsburgh has the second to continue to grow from two engineers to over 300 in the
largest technology and robotics sector in the United Pittsburgh area.
States. According to the Pittsburgh Technology Uber has also made significant investments in Pittsburgh,
Council, technology companies are responsible for particularly with its self-driving robotics car program.
roughly 23% of the area's workforce. These Pittsburgh was chosen as the pilot location for the driverless
companies account for about 34% of all wages in the car program of Uber, who has hired over 700 employees in
region with a payroll of $20.7 billion annually. the city, including more than 40 engineers from Carnegie
According to the Pittsburgh Regional Alliance, there Mellon University's National Robotics Engineering Center.
are over 28,000 tech employees in Pittsburgh spread
throughout 1,500 firms. There has been $1.8B in
tech related venture capital investment and $1.1B
investment in university math and computer science
since 2005. Pittsburgh boasts 2,600 IT degree
graduates annually, making the region #2 in U.S. for
IT degrees.
There have been several significant technology
investments in the Pittsburgh area, including ANSYS,
Apple, Google, IBM, Intel Research Pittsburgh, Oculus
(Facebook), and Uber.
Google's 250,000 SF east end office, built from the
existing Bakery Square building with renovations
complete in 2015, is of particular impact to the
Pittsburgh technology scene. Google has been
building an engineering presence in Pittsburgh since
2005. The combination of a strong tech ecosystem
601 S GRANT ST | 186Pittsburgh Regional Overview
ADVANCED MANUFACTURING industry, and a blossoming array of food and dining options
Manufacturing has always been a vital asset to the position the Steel City for success.
Pittsburgh region’s economy. For more than 150 Pittsburgh has an exciting sports scene, with three major
years, the region has benefited from a skilled sports franchises: the Pittsburgh Steelers in football, the
workforce, excellent transportation infrastructure, Pittsburgh Pirates in baseball, and the Pittsburgh Penguins
and an extensive inventory of industrial sites and in hockey. Strong fan bases not only throughout the region,
buildings. Today, advanced manufacturing powers but the country, contribute to sports tourism being the
world-class strengths in the growing fields of additive second largest source of business for Pittsburgh.
manufacturing, engineering, information technology
and robotics. Global manufacturing firms as well as The largest source of tourism business for Pittsburgh is
smaller precision tooling and machining companies conventions. Located in Downtown Pittsburgh, the David
are both meeting worldwide demand for a vast L. Lawrence Convention Center. Pittsburgh also offers
spectrum of goods, including materials, parts and countless options for enjoying the outdoors. The Steel City
components for some of the most critical industries. is also a green city – not just because of its environmentally
Much of the modern world was built with Pittsburgh- friendly buildings and city programs, but because of its
made steel and specialty metals – two historic parks. Pittsburgh has five city parks totaling almost 2,000
commodities that put the region on the global map. acres of city land, not counting the rivers and state parks
While grounded in a rich history, manufacturing also within city limits. The Pittsburgh area is home to some
today is focused on using its core strengths to further of the most diverse landscape in the United States.
future emerging opportunities. Pittsburgh's parks offer hiking, biking, hunting, fishing,
horseback riding, and canoeing to their visitors.
Two additional attractions for the City of Pittsburgh
are Tourism and Educational Institutions.
TOURISIM
Pittsburgh has become a destination city for tourists
of all ages looking for a variety of activities. A total
of $7.8 billion in tourism revenue flowed into the
Pittsburgh region in 2014, and more than 40,250
jobs in Allegheny County are directly supported by
this industry. A thriving and vibrant tourism sphere
based on conventions, outdoor activities, the sports
601 S GRANT ST | 196Pittsburgh Regional Overview EDUCATIONAL INSTITUTIONS the 2016 Wall Street Journal/Times Higher Education Part of Pittsburgh’s allure for a variety of industries College Rankings. PITT is also included in the Princeton are its two premier educational institutions: the Review’s 2017 listing of The Best 381 Colleges, which University of Pittsburgh and Carnegie Mellon features the top 15 percent of the nation’s four-year University. University of Pittsburgh, affectionately colleges. known as “PITT”, was rated the 47th best university in the world by U.S. News & World Report, PITT ranks in Pittsburgh is also home to Carnegie Mellon University, the very top cluster of U.S. public research universities, a prestigious private global research university that from research achievements to the quality of its stands among the world’s most renowned educational academic programs. University of Pittsburgh alumni institutions. With cutting-edge brain science, path- have pioneered magnetic resonance imaging and breaking performances, innovative start-ups, television, won Nobels and Pulitzers, led corporations driverless cars, big data, big ambitions, Nobel and and universities, served in government and the Turing prizes, hands-on learning, and a whole lot of military, conquered Hollywood and The New York robots, Carnegie Mellon is at the forefront of innovation. Times bestsellers list, and won Super Bowls and NBA Carnegie Mellon ranked #1 of America’s Best Graduate championships. Additionally, PITT enjoys a significant Programs in Computer Science according to U.S. number of accolades: the university ranks ninth News and World Report, and the #22 University in the nationally in federal science and engineering funding, World by Times Higher Education. according to a report from the National Science Foundation, and ranks fifth among U.S. universities in Carnegie Mellon and the University of Pittsburgh have terms of the competitive grants awarded to members combined efforts and collaborated to now collectively of its faculty by the National Institutes of Health. PITT bring in over $1.3 billion in annual research and is among the top universities in the world and is the development funding to the Pittsburgh area. best public university in the Northeast, according to
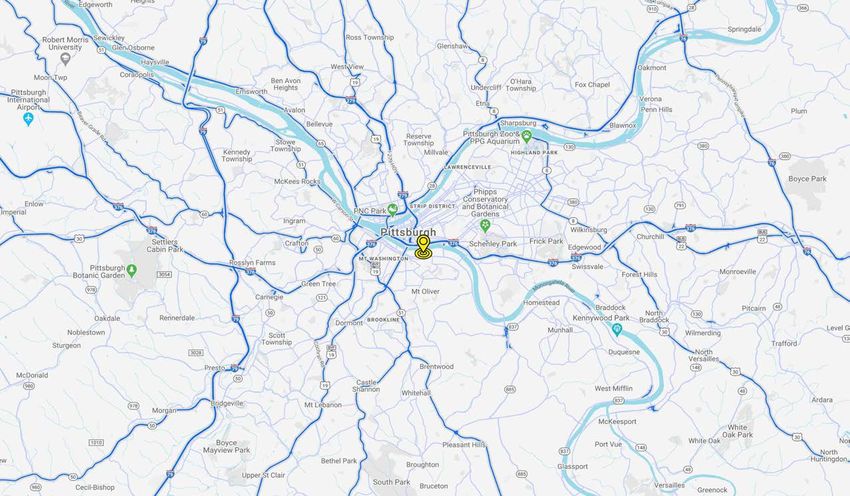
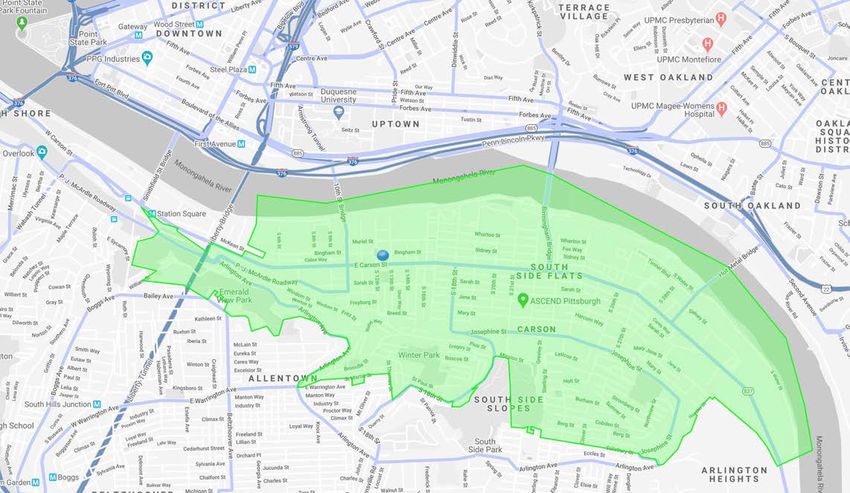
7 Maps >>Retail
7 Maps >> Southwestern PA
8Demographics
                                                  1 MILE      3 MILES     7 MILES      10 MILES
2020 Estimated Population                          25,422      158,628      391,713      611,900
2025 Projected Population                           26,117      161,284    391,880       611,829
2010 Census Population                             25,566      160,021     399,821       625,910
2000 Census Population                             26,370       171,672    431,297       675,974
Projected Annual Growth 2020 to 2025                 0.5%         0.3%          -%            -%
Historical Annual Growth 2000 to 2020               -0.2%        -0.4%       -0.5%        -0.5%
2020 Estimated Households                           10,216      73,190       186,117    290,812
2025 Projected Households                           10,440      73,779     184,305      287,944
2010 Census Households                                9,717     69,681      179,737      281,914
2000 Census Households                              10,275      72,641      187,618     293,102
Projected Annual Growth 2020 to 2025                 0.4%        0.2%         -0.2%       -0.2%
Historical Annual Growth 2000 to 2020                   -%          -%           -%          -%
2020 Est. Population Under 10 Years                  6.7%        8.4%         9.5%          9.9%
2020 Est. Population 10 to 19 Years                 14.5%        12.1%      10.8%         10.7%
2020 Est. Population 20 to 29 Years                 26.8%       22.6%       18.6%         16.2%
2020 Est. Population 30 to 44 Years                 17.2%       18.8%       20.4%         20.2%
2020 Est. Population 45 to 59 Years                 13.8%       15.4%       16.6%          17.4%
2020 Est. Population 60 to 74 Years                 12.4%       14.6%        16.1%         17.2%
2020 Est. Population 75 Years or Over                8.5%         8.1%       8.0%           8.4%
2020 Est. Median Age                                 30.5         33.9        36.5           38.4
2020 Estimated Male Population                      50.6%       49.4%       48.7%         48.2%
2020 Estimated Female Population                    49.4%       50.6%       51.3%         51.8%
2020 Estimated Never Married                        67.5%       56.7%       47.3%         42.7%
2020 Estimated Now Married                           15,7%      24.7%       33.3%         36.9%
2020 Estimated Separated or Divorced                 13.3%       13.3%      13.6%          13.9%
2020 Estimated Widowed                                3.5%        5.2%       5.8%           6.5%
2020 Est. HH Income $200,000 or More                   4.1%       5.0%        5.6%          5.6%
2020 Est. HH Income $150,000 to $199,999              4.6%        4.4%         5.3%          5.3%
2020 Est. HH Income $100,000 to $149,999              11.8%       11.6%      13.4%         13.8%
2020 Est. HH Income $75,000 to $99,999                 8.3%        9.6%      11.0%          11.4%
2020 Est. HH Income $50,000 to $74,999               15.6%       15.6%       16.6%          17.1%
2020 Est. HH Income $35,000 to $49,999               12.5%       12.5%       12.4%         12.8%
2020 Est. HH Income $25,000 to $34,999                8.6%         9.8%        9.5%          9.3%
2020 Est. HH Income $15,000 to $24,999               14.2%       12.5%        11.4%          11.1%
2020 Est. HH Income Under $15,000                   20.2%         19.1%      14.7%         13.6%
2020 Est. Average Household Income                $63,008     $ 72,202     $ 81,413     $ 81,708
2020 Est. Median Household Income                 $ 47,012     $ 49,186   $ 56,643      $ 58,333
2020 Est. Per Capita Income                       $ 28,027    $ $34,161    $ 39,197     $ 39,204
2020 Estimated Total Businesses                     2,930      13,863       23,556        32,577
2020 Estimated Total Employees                    100,540     284,365      378,682       472,672

2020 Estimated White                                67.8%       66.7%       70.7%          72.5%
2020 Estimated Black                                25.4%       23.0%       19.3%           19.1%
2020 Estimated Asian or Pacific Islander             3.0%        6.2%        6.2%           4.9%
2020 Estimated American Indian or Alaska Native      0.2%        0.2%        0.2%           0.2%
2020 Estimated Other Races                           3.5%        3.9%        3.7%           3.3%
8Demographics
1 MILE 3 MILES 7 MILES 10 MILES
2020 Estimated Hispanic Population 840 5,279 12,029 16,784
2020 Estimated Hispanic Population 3.3% 3.3% 3.1% 2.7%
2025 Projected Hispanic Population 3.3% 3.3% 3.0% 2.8%
2010 Hispanic Population 2.2% 2.3% 2.1% 1.8%
2020 Est. Adult Population (25 Years or Over) 15,941 105,743 276,728 439,581
2020 Est. Elementary (Grade Level 0 - 8) 1.9% 1.7% 1.6% 1.5%
2020 Est. Some High School (Grade Level 9 to 11) 5.9% 5.0% 4.3% 4.2%
2020 Est. High School Graduate 30.6% 27.0% 25.6% 26.8%
2020 Est. Some College 16.8% 16.3% 15.6% 16.3%
2020 Est. Associate Degree Only 8.3% 8.9% 8.9% 9.6%
2020 Est. Bachelor Degree Only 20.8% 22.7% 24.0% 23.6%
2020 Est. Graduate Degree 15.7% 18.4% 19.9% 18.1%
2020 Est. Total Housing Units 11,763 82,739 205,624 319,841
2020 Est. Owner-Occupied 31.4% 38.0% 45.2% 50.1%
2020 Est. Renter-Occupied 55.5% 50.4% 45.3% 40.8%
2020 Est. Vacant Housing 13.2% 11.5% 9.5% 9.1%
2020 Homes Built 2010 or Later 4.1% 3.1% 2.7% 2.4%
2020 Homes Built 2000 to 2009 4.8% 2.9% 2.4% 2.6%
2020 Homes Built 1990 to 1999 4.9% 4.4% 3.8% 3.9%
2020 Homes Built 1980 to 1989 4.1% 4.5% 4.2% 4.8%
2020 Homes Built 1970 to 1979 6.0% 7.4% 7.5% 7.9%
2020 Homes Built 1960 to 1969 7.3% 8.2% 9.2% 10.1%
2020 Homes Built 1950 to 1959 6.4% 11.0% 14.2% 16.6%
2020 Homes Built Before 1949 49.2% 47.0% 46.5% 42.7%
2020 Home Value $1,000,000 or More 0.2% 0.6% 0.5% 0.4%
2020 Home Value $500,000 to $999,999 4.4% 5.1% 5.8% 5.0%
2020 Home Value $400,000 to $499,999 3.8% 2.8% 3.4% 3.2%
2020 Home Value $300,000 to $399,999 9.6% 6.4% 7.0% 6.6%
2020 Home Value $200,000 to $299,999 21.8% 14.3% 16.3% 17.0%
2020 Home Value $150,000 to $199,999 13.0% 14.1% 17.0% 18.0%
2020 Home Value $100,000 to $149,999 12.7% 18.2% 19.7% 21.3%
2020 Home Value $50,000 to $99,999 21.6% 27.3% 22.1% 21.3%
2020 Home Value $25,000 to $49,999 9.4% 7.3% 5.5% 5.3%
2020 Home Value Under $25,000 7.0% 3.8% 2.9% 3.0%
2020 Median Home Value $146,771 $147,132 $168,793 $163,152
2020 Median Rent $847 $825 $806 $776
2020 Est. Labor Population Age 16 Years or Older 22,763 138,348 334,351 517,635
2020 Est. Civilian Employed 53.1% 58.7% 61.8% 62.0%
2020 Est. Civilian Unemployed 2.9% 3.0% 2.6% 2.6%
2020 Est. in Armed Forces -% -% -% -%
2020 Est. not in Labor Force 44% 38.2% 35.6% 35.4%
2020 Est. Labor Force Males 50.6% 49.1% 48.2% 47.6%
2020 Est. Labor Force Females 49.4% 50.9% 51.8% 52.4%8Demographics
1 MILE 3 MILES 7 MILES 10 MILES
2020 Occupation: Population Age 16 Years or Older 12,091 81,279 206,664 320,753
2020 Mgmt., Business, & Financial Operations 17.0% 15.6% 16.2% 16.3%
2020 Professional, Related 30.2% 30.5% 31.6% 30.0%
2020 Service 21.4% 20.1% 18.0% 17.8%
2020 Sales, Office 20.2% 20.0% 20.2% 20.0%
2020 Farming, Fishing, Forestry -% -% 0.1% 0.1%
2020 Construction, Extraction, Maintenance 3.1% 4.8% 4.9% 5.3%
2020 Production, Transport, Material Moving 8.0% 9.0% 9.0% 9.5%
2020 White Collar Workers 67.5% 66.1% 68.0% 67.2%
2020 Blue Collar Workers 32.5% 33.9% 32.0% 32.8%
2020 Drive to Work Alone 56.9% 58.3% 62.4% 65.3%
2020 Drive to Work in Carpool 9.1% 8.7% 9.1% 9.1%
2020 Travel to Work by Public Transportation 14.0% 13.6% 13.9% 12.7%
2020 Drive to Work on Motorcycle 0.1% 0.1% -% -%
2020 Walk or Bicycle to Work 13.2% 13.0% 8.5% 6.7%
2020 Other Means 0.7% 0.4% 0.4% 0.5%
2020 Work at Home 6.1% 5.8% 5.5% 5.6%
2020 Travel to Work in 14 Minutes or Less 25.8% 23.8% 21.7% 20.9%
2020 Travel to Work in 15 to 29 Minutes 36.3% 41.2% 40.9% 39.7%
2020 Travel to Work in 30 to 59 Minutes 24.2% 25.9% 30.8% 32.8%
2020 Travel to Work in 60 Minutes or More 4.8% 5.2% 5.3% 5.7%
2020 Average Travel Time to Work 19.7 20.8 22.6 23.6
2020 Est. Total Household Expenditure $519.02 M $4.06 B $11.26 B $17.64 B
2020 Est. Apparel $18.2 M $142.3 M $395.2 M $618.13 M
2020 Est. Contributions, Gifts $28.78 M $228.11 M $639.25 M $1 B
2020 Est. Education, Reading $16.63 M $130.67 M $362.12 M $563.24 M
2020 Est. Entertainment $28.56 M $224.52 M $628.1 M $986.39 M
2020 Est. Food, Beverages, Tobacco $80.7 M $628.33 M $1.74 B $2.72 B
2020 Est. Furnishings, Equipment $17.78 M $139.68 M $390.64 M $613.53 M
2020 Est. Health Care, Insurance $47.33 M $370.99 M $1.03 B $1.62 B
2020 Est. Household Operations, Shelter, Utilities $172.08 M $1.34 B $3.69 B $5.77 B
2020 Est. Miscellaneous Expenses $9.83 M $76.96 M $213.87 M $335.36 M
2020 Est. Personal Care $6.98 M $54.52 M $151.33 M $237.11 M
2020 Est. Transportation $92.17 M $721.84 M $2.02 B $3.17 B10 Bedford
Square CONFIDENTIAL OFFERING MEMORANDUM
INVESTMENT CONTACT:
Gregg Broujos Michelle Domeisen SIOR, CCIM COLLIERS INTERNATIONAL | PITTSBURGH
Regional Principal | Pittsburgh 525 WILLIAM PENN PLACE
Senior Vice President | Pittsburgh
SUITE 3510
Investment Services Investment Services PITTSBURGH, PA 15219
DIRECT +1 412 515 8523 DIRECT +1 412 515 8544 412 321 4200
MOBILE +1 412 512 1611 colliers.com/pittsburgh
MOBILE +1 412
EMAIL gregg.broujos@colliers.com EMAIL michelle.domeisen@colliers.You can also read