CORONAVIRUS AND TEMPERATURE - POLICY BRIEF PB 20 - Policy Center for the New South
←
→
Page content transcription
If your browser does not render page correctly, please read the page content below

POLICY BRIEF
                       PB 20 - 21
                     March 2020

CORONAVIRUS
    AND
TEMPERATURE
Note: the data and analysis in this brief will be updated as the
                      pandemic evolves

                              By

                  Mahmoud Arbouch
                          &
                     Uri Dadush
Policy Center for the New South                                                                                       POLICY BRIEF

                Coronavirus and Temperature
                                                                                           Mahmoud Arbouch & Uri Dadush

                The COVID-19 disease, caused by the novel coronavirus, is the most serious health crisis
                since the Spanish flu of 1918, which is estimated to have killed between 50 million and
                100 million people worldwide. By the latest count (March 29), the disease had spread to
                over 177 countries, with more than 630,000 cases reported and 30,000 recorded deaths.
                These numbers are increasing exponentially at present and the cases and deaths
                reported are both believed to be undercounted. Deaths are strongly concentrated in
                the older population (aged 65 and over) and among those with serious pre-existing
                conditions, according to a study by Chinese researchers (Liu et al, 2020) and extensive
                epidemiological data from South Korea and Italy.1

                Although COVID-19 is now officially a pandemic, its spread across the world remains
                very uneven, with China reporting 59 cases per million, and Italy—the epicenter of the
                crisis at time of writing—over 1530 cases per million, while several countries with warmer
                climates, such as the Philippines, report fewer than 10 cases per million.

                This uneven distribution has led to both fear and hope. Fear, because the disease might
                still spread virulently to Africa and other poor nations, where very few tests have been
                conducted and where medical systems are least equipped to cope. Hope, because the
                slower spread of the virus in hot climates might be an important signal that the disease
                will ease with the coming of spring and summer in the hardest-hit temperate zones. This
                has been the case with other strains of coronavirus in the past, such as those that are at
                the root of ordinary flu.

                Though written in the ‘fog of war’, this note attempts to evaluate the importance of
                temperature in accounting for the spread of the virus. We attempt this despite the fact
                that reported cases are a very imperfect measure of the spread of the virus, mainly
                because of major differences in the frequency of tests. For example, based on the limited
                information available about testing, poor countries, which tend to be in warmer climates,
                test less and almost certainly tend to report fewer cases for that reason.

                Still, after controlling for income and other factors that might influence the spread of the
                virus, our analysis suggests that temperature does play an important role in determining
                the extent of the spread. Our best guess, based on various regression specifications, is
                that a 1% increase in temperature from average levels (50 degrees Fahrenheit/10 degrees
                Celsius) could reduce the number of cases per million people by 0.5% (+/- 0.2%). We
                also find evidence that the incidence of disease is lower in very cold temperatures.

                Our analysis is preliminary and needs to be confirmed by studies based on more
                complete data. Most needed are random tests of the population to ascertain the true rate
                of infections, which we expect, or rather hope, will become available in the near future. If
                confirmed, the policy implications of our results would be significant. In the final section,
                we briefly discuss what the policy implications might be.

                1       For Italy, see https://lab.gedidigital.it/gedi-visual/2020/coronavirus-i-contagi-in-italia/

www.policycenter.ma                                                                                                            2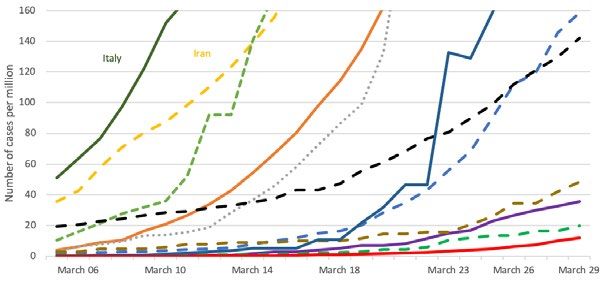
Policy Center for the New South                                                                        POLICY BRIEF

                Spread of the Virus
                To date, the main epicenters of COVID-19, the Hubei region of China, the Lombardy
                region of Italy, the city of Madrid, the city of New York, the town of Mashhad in Iran, and
                the city of Mulhouse in France, are all in temperate zones. Figure 1 shows that warmer
                regions appear to have been less affected.

                Figure 1: Cases/million vs Temperature

                Source: WHO and Weatherbase.

                For example, Italy’s northern regions have been far harder hit than the warmer regions
                in the middle, while the regions in the south have been least hit.2 A study by Chinese
                researchers, which has not been peer-reviewed, finds that the rate of contagion (R) in
                100 Chinese cities was significantly affected by heat and humidity in the period prior
                to interventions by government to limit the spread, even after controlling for population
                density and GDP per capita as a proxy for medical preparedness (Wang et al, 2020).
                Applying ecological niche models, Araujo and Naimi (2020) estimated with 95%
                confidence that the interquartile temperature range for coronavirus infection is between
                2 and 9.5 degrees Celsius. Bukhari and Jamil (2020) of MIT concluded that up to March
                22, 90% of coronavirus transmissions had occurred within a temperature range of 3 to 17
                degrees Celsius, and countries with warmer climates have seen less rapid transmission
                (Figure 2).

                2       https://lab.gedidigital.it/gedi-visual/2020/coronavirus-i-contagi-in-italia/

www.policycenter.ma                                                                                             3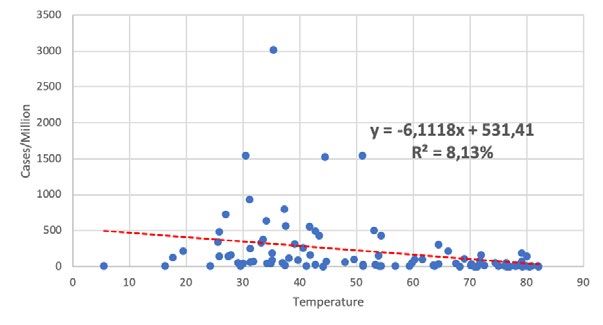
Policy Center for the New South                                                                          POLICY BRIEF

                Figure 2: Growth Curve of Number of Cases Per Million

                                                                                                   USA

                                                            Norway

                                                             France               Germany
                                                                                                      Australia

                                                                                                                  UAE           S. Arabia
                                                                      Singapore
                                                                                                                  Thailand
                                                                                                                             Morocco

                Source: WHO. Note: The y-axis has been capped at 160 cases.

                Similarly to influenza, the novel coronavirus might be inhibited from spreading by higher
                temperatures and increased humidity because droplets from coughs or sneezing
                travel less far, people spend more time outside in warmer climates, and they are less
                susceptible to being infected. Experts, however, remain divided on whether COVID-19
                will follow this path, with many remaining agnostic or circumspect3.

                Incidence of Infection and Testing
                How should we measure the spread of the virus? Ideally, this would be done by testing the
                whole population and identifying positive cases. Tests are quite accurate but not perfect,
                with both false negatives and false positives4. However, testing capacity is severely
                limited at present and testing everyone is impossible in a single country of any size, let
                alone throughout the world. The next best would be to conduct tests on sufficiently large
                and representative random samples of the population of each country. To our knowledge
                no such random testing exercises has been attempted. Instead, in view of the cost and
                shortage of testing equipment (including testing kits, laboratory capacity, and protective
                equipment for those conducting the test), tests tend to be carried out only on selected
                individuals, nearly always those that already show advanced symptoms of the disease,
                including high fever and difficulty breathing, and those who have been directly exposed
                to it, including medical workers or close family and acquaintances of confirmed cases.
                Table 1 shows the very large disparity in the frequency of tests in different countries,
                ranging from about 10,000/million in Bahrain and Norway, to 10 per million in Philippines
                and India. There is a statistically very weak negative relationship between the frequency
                of tests and the share of those found positive for the virus; less testing is weakly
                associated with a higher number of positive tests. Countries that are least capable or
                willing to test tend to reserve tests for those showing the most advanced symptoms.
                Nevertheless, countries that test more frequently tend to report more positive cases in

                3        uch as Brittany Kmush, a public health expert at New York’s Syracuse University, and David Cennimo,
                        S
                        from Rutgers New Jersey Medical School.
                4       https://www.medicinenet.com/script/main/art.asp?articlekey=228250.

www.policycenter.ma                                                                                                      4
Policy Center for the New South                                                                              POLICY BRIEF

                absolute terms. As Figure 3 shows, there is a statistically significant positive relationship
                between frequency of testing and per-capita income.

                Figure 3: Number of Tests/Million vs Income Per Capita

                Source: European CDC and WDI data.

                Poor countries tend to test far less than rich countries. But that is not always the case. For
                example, frequency of tests in the United States, the richest country in the sample, has
                been far less than in Slovenia or China.

                Table 1: Number of Tests Per Million and Share of Positives by Country5 (Data from
                March 20)6

                                                      Number of tests/million                    Share of positive tests
                 Iceland                              25988.9                                    4.5%
                 Bahrain                              11880.0                                    1.5%
                 Norway                               8229.6                                     4.0%
                 South Korea                          6132.7                                     2.8%
                 Slovenia                             4769.3                                     2.9%
                 Italy                                3423.5                                     22.7%
                 Qatar                                3019.8                                     5.2%
                 Australia                            3016.0                                     1.2%
                 Germany                              2013.8                                     2.3%
                 Estonia                              1895.7                                     11.3%
                 Denmark                              1850.8                                     11.7%

                5       Testing data was only available for 50 countries.
                6       The most recent data, with sources indicated is available on the WorldinData site https://ourworldindata.
                         org/coronavirus-testing-source-data.

www.policycenter.ma                                                                                                       5
Policy Center for the New South POLICY BRIEF
Austria 1764.8 17.0%
Belarus 1686.8 0.2%
Latvia 1663.6 3.5%
Belgium 1607.4 8.1%
Canada 1571.0 1.5%
Sweden 1404.3 7.4%
Ireland 1359.8 3.4%
Israel 1222.9 2.8%
Czechia 1093.5 7.8%
Russia 993.4 0.1%
Iran 978.0 14.2%
United Kingdom 971.9 4.1%
Spain 642.1 37.3%
France 548.6 12.2%
Finland 543.7 12.0%
Palestine 498.6 1.5%
Slovakia 497.0 5.1%
Romania 425.4 3.7%
Lithuania 413.7 6.0%
Panama 348.3 4.7%
Poland 344.2 3.3%
Croatia 309.1 6.4%
Hungary 307.8 2.8%
Armenia 275.4 6.4%
China 229.8 24.1%
Costa Rica 207.8 4.8%
Vietnam 163.7 0.6%
New Zealand 119.5 1.9%
Japan 117.8 5.9%
United States 115.4 7.0%
South Africa 111.4 3.2%
Thailand 102.0 2.1%
Colombia 82.6 3.5%
Morocco 13.8 14.9%
United Arab Emirates 13.0 78.4%
Philippines 11.9 18.1%
India 10.7 1.3%
Pakistan 9.3 12.2%
Indonesia 7.6 18.2%
Ukraine 7.1 8.2%
Source: Worldometers.
www.policycenter.ma 6Policy Center for the New South POLICY BRIEF
The scarcity of tests also means that asymptomatic individuals who are carriers of the
virus (and may also be infectious), and even some of those who are symptomatic but at
a less-advanced stage of the disease, remain unidentified. How big might the group of
asymptomatic infected individuals be? It is impossible to give a general answer, but one
indication comes from the town of Vò in the Veneto region, an epicenter of the disease,
where tests carried out in February covered the total population of 3300 people. The tests
identified 3% of individuals as having COVID-19, about half of whom were asymptomatic.
If this is any guide, in a context in which the epidemic is quite advanced and where tests
are relatively frequent (as in Italy or Korea, for example), one should double the number of
positive individuals to arrive at a more reliable figure of total infections. However, studies
that use epidemiological models based on recent experience (such as with the Diamond
Princess cruise ship7) suggest much higher rates of contagion and of asymptomatic or
weakly symptomatic infected individuals (Mizomoto et al, 2020).
Although data on reported cases, drawn from the World Health Organization’s Situation
Report of March 29, is far from ideal to measure the real spread of the virus in the
whole population, it most likely provides a fair representation of the prevalence of cases
of people who are ill and whose symptoms are already advanced8. This is the part of
the population that threatens to overwhelm the medical system and requires the most
pressing attention.
Accounting for the Spread of the Virus
To identify the importance of temperature in affecting the spread of the virus, we need
first to control for other factors. We hypothesize that (at least) five other factors are
important: per-capita income, which affects the availability of tests and stands for various
institutional and ‘openness’ factors; the intensity of people exchanges with China, the
initial epicenter of the crisis; the demographic profile of the population, notably the share
of older people who are most prone to become infected; the preparedness of the medical
system to anticipate and prevent epidemics; and density of population. Other factors
that might clearly play a role, such as humidity, are not considered here, in part because
they vary greatly across national territories in even the smaller countries.
a. Bivariate Relationships
We discuss the effect of each factor briefly in turn, before turning to a multivariate analysis
in the next section.
Temperature
As already shown, there is a strong presumption that temperature affects the spread of
the virus. Table 2 shows the 95 countries in our sample sorted by temperature quintile9,
7 n the Diamond Princess cruise ship, which reported over 700 positive cases and was held up in Okinawa,
O
Japan, about a third of the positive cases were asymptomatic, according to press reports.
8 This may not be true in cases, such as Wuhan and Bergamo, where hospitals became overwhelmed
and many patients with severe symptoms could not be admitted, and many, including the dead, were not
tested or counted as victims of the virus.
9 Although the outbreak has reached more than 177 countries, we excluded countries with small populations
(less than 1 million people) and also countries reporting very few contamination cases (less than 20 cases),
from our analysis to avoid biasing the results with outliers. Many of the excluded countries are in Africa, and
have warmer climates.
www.policycenter.ma 7Policy Center for the New South POLICY BRIEF
based on historical temperatures in January, February, and March. Countries in the
second-coldest quintile10, those in temperate zones, reported the largest number of
cases, 400 per million inhabitants. Warmer quintiles have reported fewer cases, falling
off to 30 cases per million in the warmest countries. However, very cold countries have
reported significantly fewer cases than those in the second quartile, 280 per million.
The standard deviation of cases/million within each quintile is very high, highlighting the
importance of third factors.
Table 2: Reported Infections Per Million and Temperature
Temperature Mean of temperature Mean of infections/ Standard deviation
quintile per quintile (F.) millions of infections/million
5th 78.7 30.2 51.5
4th 67.4 71.3 80.0
3rd 50.1 287.0 476.6
2nd 37.2 404.1 673.5
1st 25.6 281.7 397.0
Source: WHO data.
The distribution by quintiles suggests that the effect of temperature on cases per million
is not linear. This is also shown in Figure 1, which could be visually interpreted as bell-
shaped. The conjecture that very cold temperatures (and very hot temperatures) reduce the
propensity of the coronavirus to thrive and spread is also consistent with the temperature
ranges reported in the previously cited studies by Wang et al (2020) and by Araujo and
Naimi (2020). Both studies place the ‘sweet spot’ for propagation of the virus near 10°C/50°F.
Income Per Capita
Table 3 shows a positive relationship between reported cases and income quintiles.
This might reflect frequency of testing, and a host of other factors. For example, richer
countries tend to be more open, to receive more tourists, including Chinese tourists,
and to have older populations than poorer countries. As with temperature, the standard
deviation of cases/million within each income quintile is high.
Table 3: Reported Infections Per Million and Income Per Capita
Income per Mean of income per Mean of Standard deviation of
capita quintile capita per quintile infections/million infections/million
5th 68315.9 565.9 703.5
4th 38863.4 368.0 445.6
3rd 24266.9 85.6 101.0
2nd 14557.8 37.9 36.5
1st 6050.8 16.9 34.0
Source: WHO and WDI data.
10 ur temperature data source (http://www.weatherbase.com/), computes the averages using the
O
temperatures by cities during several past years (from 20 to 90 years).
www.policycenter.ma 8Policy Center for the New South POLICY BRIEF
People exchanges with China
Data on Chinese visitors by country was not available to us. As a proxy, we used 2018
trade (exports plus imports) with China per capita. Here again, we found a quite strong
increasing relationship, although not monotonically, of infections across quintiles.
Infections are highest in countries where trade with China is on average $1300 per
capita, and lowest where trade is 10 cents per capita.
Table 4: Reported Infections Per Million and Exchanges With China
Mean of trade/ Mean of
Trade/population Standard deviation
population per infections/
quintile of infections/million
quintile million
5th 4.4 326.1 371.7
4th 1.3 476.1 727.8
3rd 0.7 165.2 357.6
2nd 0.3 71.4 99.5
1st 0.1 35.4 63.7
Source: WHO, CNUCED and WDI data.
Demographic Profile
Older people tend to suffer worse from COVID-19, and the vast majority of fatalities are
in this group (Liu et al, 2020). Countries with a high share of people over 65 tend to have
more infections, but the relationship is not quite monotonic, and the standard deviations
within quintiles are very large.
Table 5: Infections/Million Per Quintile of Population Over 65
Population aged Mean of population Mean of Standard deviation of
over 65 quintile aged over 65 (%) per infections/ infections/million
quintile million
5th 20.8 421.2 437.5
4th 16.6 292.0 413.9
3rd 11.3 264.8 678.8
2nd 6.6 54.5 103.1
1st 3.1 79.3 79.3
Source: WHO and WDI data.
Medical Preparedness
An indicator of medical preparedness to anticipate and deal with epidemics is given by
the Global Health Security Index (GHS index), provided by the WHO for 195 countries.
The bilateral relationship between medical preparedness and infections is weak, with
the most-prepared countries, according to the index, reporting the largest number of
infections. This counterintuitive result might be due to various factors, including that the
most-prepared countries tend to be the richer countries and those that carry out more
tests.
www.policycenter.ma 9Policy Center for the New South POLICY BRIEF
Table 6: Infections/Million Per Quintile of Medical Preparedness Score
Medical Mean of medical Mean of infections/ Standard deviation
preparedness preparedness million of infections/
score quintile score per quintile million
5th 69.9 470.5 438.1
4th 56.9 255.5 395.4
3rd 49.0 85.6 102.6
2nd 42.0 232.3 678.3
1st 33.7 30.3 97.7
Source: WHO, GHS index and WDI data.
Population Density
There is also a positive relationship between population density and cases per million,
but it is not monotonic and exhibits large standard deviations within quintiles.
Table 7: Infections/Million Per Quintile of Population Density (people per km2 of
land area):
Pop density Mean of pop Mean of Standard deviation of
quintile density per infections/ infections/million
quintile millions
5th 896.4 352.8 688.3
4th 146.7 279.4 474.5
3rd 93.6 196.2 389.5
2nd 60.3 106.0 152.4
1st 17.8 139.8 189.6
Source: WHO, and WDI data.
Multivariate Analysis
The bivariate analysis suggests that it is not just high temperature that retards transmission
but also very low temperatures. Previous studies, cited above, also suggest that the
‘sweet spot’ for transmission lies somewhere near 50°F/ 10°C. That level also happens
to be the average temperature in our sample of 95 countries, which excludes many
small countries and countries that report very few cases – mainly African countries.
Accordingly, in our multivariate analysis, we tested the effect of both temperature and
the absolute deviation of temperature from the ‘sweet spot’ on cases of infection per
million people. With all variables expressed in logarithms, we tested specifications
with various combinations of the control variables. It turns out that, among the control
variables, income per capita is the most significant, and also has the largest effect on
cases per million. As Table 8 shows, income per capita is strongly positively correlated
with other control variables, namely trade with China, population aged over 65, and
medical preparedness, suggesting that it may be picking up their effects as well.
www.policycenter.ma 10Policy Center for the New South POLICY BRIEF
Table 8: Per-Capita Income Correlations With the Other Variables
INCOMEP TEMPERA TRADEPO AGEDP MEDICAL POPDENS
C T P OP PR IT
INCOMEP
1 -0.26 0.67 0.32 0.47 0.31
C
Regression of cases per million on all the independent variables yields a low level of
significance of all the variables except per-capita income and temperature.
Below we report on two ‘preferred’ regressions. Both include temperature as absolute
deviation from 50°F, which results highly significant, and more significant than the level
of temperature. The first regression includes all the control variables except population
density, which was not significant, and also excludes per-capita income on account
of collinearity. The second regression includes per-capita income as the sole control
variable. The full regression results are in the Appendix.
The first regression:
Infections=-3,47-0,47*Temperature +0,39*Trade+1,83*Medprep+0,77*Agedpop
The second regression:
Infections= -11,17 -0,34*Temperature +1,60*Income PC
In the first regression, all variables are highly significant. The coefficient of temperature
deviation from 50°F is -0.47, to be interpreted as follows: for a 1% increase (decrease) in
temperature above (below) 50°F, the number of cases per million increases (decreases)
by 0.47%. All other variables are of the expected sign except for medical preparedness
which has a positive coefficient, perhaps because the more-prepared countries test
more.
In the second regression, the coefficient on temperature deviation is similar to the first
regression: -0.34 and highly significant. The effect of per-capita income on cases per
million is extremely significant, with a 1% increase in income per capita associated with
a 1.6% increase in cases per million.
These outcomes are little changed from regressions carried out a week ago and ten
days ago, when global infections were less than half of what they were on March 29.
Still, there remains plenty of doubt about the robustness and interpretation of these
results, especially in the light of the strong association between per-capita income and
greater frequency of testing, and the rapid evolution of the situation. As more testing
capacity and test results become available in poorer and typically warmer countries,
the accuracy of our estimates should improve. That said, the evidence that temperature
plays a significant role is we believe quite strong.
www.policycenter.ma 11Policy Center for the New South POLICY BRIEF
Possible Policy Implications
The inadequacy of our measure of disease spread, the disparities in testing, and the
newness and rapid evolution of the pandemic do not permit us to draw strong policy
conclusions at this stage.
Even so, based on our evidence and on previous studies, we can say with some
confidence that COVID-19 spreads less readily in warmer climates. COVID-19 also
appears to spread less readily in very cold climates.
If our findings are confirmed by more complete data, the disease may turn out to be
a less disruptive and costly epidemic in countries where the climate is warmer. The
fact that the virus appears to spread less rapidly in warmer climates today does not
automatically mean that there will be significant slowing of the disease in the temperate
regions of the Northern hemisphere as the weather warms. Still, if our cross-section
results could be extrapolated to the evolution of the disease over time, they would suggest
that the summer months will bring relief in the Northern hemisphere, while countries in
the Southern hemisphere, including those in Africa, Latin America and East Asia, might
actually see increased numbers of infections.
For example, if our quantification can be applied in Italy, where the temperature is about
85°F in August, then cases per million will decline by 35%, all other things being equal. As
things stand, extrapolations based on epidemiological models suggest that the number
of new infections (the flow) in Italy is close to the peak and will decline very sharply over
the next month or so, and that the total number of people infected (the stock) will decline
to very low numbers by the summer.
Other factors included in the regression suggest that the epidemic will be less disruptive
and costly in poorer countries, despite their low medical preparedness, than in richer
countries. This is because, not only of their typically warmer climates, but also their
relatively young populations, lower population density in most cases, and the relatively
low intensity of their people exchanges with China, and with the rest of the world.
If, as we believe based on the results reported by us and others, COVID-19 also spreads
less readily in very cold climates, the coming of summer might mean greater spread of
infections in regions such as Scandinavia, Northern Russia and Canada.
If confirmed by more comprehensive studies, as more data becomes available and the
epidemic evolves, our preliminary analysis suggests that the probability of containing
the disease in the temperate regions that are currently most affected, is greater than is
generally believed.
While every country needs to adopt strong measures to contain the spread of the disease,
poor countries in warm climates might not need to adopt extreme measures, such as
prolonged lockdowns, which would have a disastrous effect on economies ill-positioned
to cope.
Morocco, for example, where the number of infections is still small, has average historical
temperatures of 75°F in April and 82°F in May, far above the coronavirus ‘sweet spot’.
www.policycenter.ma 12Policy Center for the New South POLICY BRIEF
It is too soon to be sure, but, helped by warm weather, measures such as stopping
travel from the most-affected zones, moderate social distancing, extensive testing and
isolation of those infected and at high risk of infection, and isolation of older people that
are most vulnerable, could be enough to avoid a spread of infections that overwhelms
the medical system.
References
• Araujo.M, Naimi.B, “Spread of SARS-CoV-2 Coronavirus likely to be constrained by
climate” https://www.medrxiv.org/content/10.1101/2020.03.12.20034728v1 March
12, 2020
• Bukhari.Q, Jameel.Y, “Warmer climates will slow coronavirus spread, but won’t stop
it” https://theprint.in/science/warmer-climates-wont-stop-coronavirus-spread-but-
will-slow-it-new-study-suggests/385911/, March 22, 2020
• Griffiths.J, CNN “Will warmer weather help fight the coronavirus? Singapore and
Australia suggest maybe not” https://edition.cnn.com/2020/03/12/asia/coronavirus-
flu-weather-temperature-intl-hnk/index.html
• Liu.Z, Bing.X, Za Zhi.X, “The Epidemiological Characteristics of an Outbreak of 2019
Novel Coronavirus Diseases (COVID-19) in China” https://pubmed.ncbi.nlm.nih.
gov/32064853-the-epidemiological-characteristics-of-an-outbreak-of-2019-novel-
coronavirus-diseases-covid-19-in-china/, 2020
• McCarthy.S, “Coronavirus ‘highly sensitive’ to high temperatures, but don’t bank
on summer killing it off, studies say”https://www.scmp.com/news/china/science/
article/3074131/coronavirus-highly-sensitive-high-temperatures-dont-bank-summer
• Mizomoto,K., Kagaya, K., Chowell, G. “Early epidemiological assessment of the
transmission potential and virulenceof coronavirus disease 2019 (Covid-19) in Wuhan
City, China;Januar-February 2020”
• The Novel Coronavirus Pneumonia Emergency Response Epidemiology Team.
“Vital Surveillances: The Epidemiological Characteristics of an Outbreak of 2019
Novel Coronavirus Diseases (COVID-19)” http://weekly.chinacdc.cn/en/article/id/
e53946e2-c6c4-41e9-9a9b-fea8db1a8f51 — China, 2020
• Wang.J, Tang.K, Feng.K, and Lv.W, “High Temperature and High Humidity Reduce
the Transmission of COVID-19” https://papers.ssrn.com/sol3/papers.cfm?abstract_
id=3551767 March 9,2020
www.policycenter.ma 13Policy Center for the New South POLICY BRIEF
Appendix: Preferred Regressions
The first regression:
Infections=-3,47-0,47*Temperature +0,39*Trade+1,83*Medprep+0,77*Agedpop
Dependent Variable:
LOGINFECTIONS
Method: Least Squares
Date: 03/30/20 Time:
18:40
Sample: 1 95
Included observations: 95
Variable Coefficient Std. Error t-Statistic Prob.
C -3.474742 2.724827 -1.275216 0.2055
LOGDEVTEMP -0.470201 0.165153 -2.847067 0.0055
LOGTRADE 0.399914 0.110240 3.627671 0.0005
LOGMEDPREP 1.837952 0.775543 2.369891 0.0199
LOGAGED 0.779706 0.247126 3.155100 0.0022
R-squared 0.518092 Mean 3.944345
dependent
var
Adjusted R-squared 0.496674 S.D. 1.909240
dependent
var
S.E. of regression 1.354519 Akaike 3.495967
info criterion
Sum squared resid 165.1251 Schwarz 3.630381
criterion
Log likelihood -161.0584 Hannan- 3.550280
Quinn criter.
F-statistic 24.18940 Durbin- 2.266505
Watson stat
Prob(F-statistic) 0.000000
www.policycenter.ma 14Policy Center for the New South POLICY BRIEF
The second regression:
Infections= -11,17 -0,34*Temperature +1,60*Income PC
Dependent Variable:
LOGINFECTIONS
Method: Least Squares
Date: 03/30/20 Time:
18:42
Sample: 1 95
Included observations: 95
Variable Coefficient Std. Error t-Statistic Prob.
C -11.17638 1.461940 -7.644899 0.0000
LOGDEVTEMP -0.346915 0.144184 -2.406062 0.0181
LOGINCOMEPC 1.605709 0.138326 11.60814 0.0000
R-squared 0.612047 Mean 3.944345
dependent
var
Adjusted R-squared 0.603614 S.D. 1.909240
dependent
var
S.E. of regression 1.202043 Akaike 3.236991
info criterion
Sum squared resid 132.9314 Schwarz 3.317640
criterion
Log likelihood -150.7571 Hannan- 3.269579
Quinn criter.
F-statistic 72.57116 Durbin- 2.267647
Watson stat
Prob(F-statistic) 0.000000
www.policycenter.ma 15Policy Center for the New South POLICY BRIEF
About the Authors
Uri Dadush
Uri Dadush is a Senior Fellow at the Policy Center for the New South, previously known as OCP Policy Center
in Rabat, Morocco and a non-resident scholar at Bruegel. He is based in Washington, DC, and is Principal of
Economic Policy International, LLC, providing consulting services to the World Bank and to other international
organizations as well as corporations. He teaches courses on globalization and on international trade
policy at the OCP Policy School and at the School of Public Policy at the University of Maryland. He was
previously Director of the International Economics Program at Carnegie and, at the World Bank, Director of
the International Trade, Economic Policy, and Development Prospects Departments. In the private sector,
where he was President of the Economist Intelligence Unit, Group Vice President of Data Resources, Inc.,
and a consultant with Mc Kinsey and Co.
Mahmoud Arbouch
Mahmoud ARBOUCH is a Research Assistant at the Policy Center for the New South. He is a graduate
engineer from the National Institute of Statistics and Applied Economics (INSEA). He is currently working
on topics related to infrastructure development and financing in Sub-Saharan Africa. He previously worked
on the economic aspects of migration, the middle class development in the world and in Morocco, as well
as some sectoral policies in Morocco. Mahmoud is also interested in macroeconomic policies and long
term development. Before joining the economic research team at the Policy Center for the New South, his
research focused on monetary policy at Bank Al-Maghrib (Central Bank of Morocco).
About Policy Center for the New South
Policy Center for the New South, formerly OCP Policy Center, is a Moroccan policy-oriented think tank based
in Rabat, Morocco, striving to promote knowledge sharing and to contribute to an enriched reflection on
key economic and international relations issues. By offering a southern perspective on major regional and
global strategic challenges facing developing and emerging countries, the Policy Center for the New South
aims to provide a meaningful policy-making contribution through its four research programs: Agriculture,
Environment and Food Security, Economic and Social Development, Commodity Economics and Finance,
Geopolitics and International Relations.
The views expressed in this publication are the views of the author.
Policy Center for the New South
Suncity Complex, Building C, Av. Addolb, Albortokal Street,
Hay Riad, Rabat, Maroc.
Email : contact@policycenter.ma
Phone : +212 (0) 537 54 04 04 / Fax : +212 (0) 537 71 31 54
Website : www.policycenter.ma
www.policycenter.ma 16You can also read