Genetic Characterization of Rainfed Durum Wheat Genotypes Based On Functional Markers Associated With Grain Quality Proteins
←
→
Page content transcription
If your browser does not render page correctly, please read the page content below
Genetic Characterization of Rainfed Durum Wheat Genotypes Based On
Functional Markers Associated With Grain Quality Proteins
Zahra Moradi Kheibary ( zahra.moradi64@yahoo.com )
Islamic Azad University Science and Research Branch https://orcid.org/0000-0001-7879-7855
Reza Azizinezhad
Islamic Azad University Science and Research Branch
Ali Mehras Mehrabi
Islamic Azad University Science and Research Branch
Mahmood Khosrowshahli
Islamic Azad University Science and Research Branch
Alireza Etminan
Islamic Azad University Kermanshah Branch Young Researchers Club
Research Article
Keywords: Durum wheat, Functional marker, Genetic variability, HMWGs, LMWGs
Posted Date: August 4th, 2021
DOI: https://doi.org/10.21203/rs.3.rs-675853/v1
License: This work is licensed under a Creative Commons Attribution 4.0 International License. Read Full License
Page 1/12Abstract
Analysis of genetic diversity provides helpful information necessary to develop the breeding and conservation strategies of crops. In this study, the genetic
diversity and population structure of 90 durum wheat genotypes maintained at Sararud Dryland Agricultural Research Institute, Kermanshah, Iran, were
evaluated by using 23 gene-specific markers (functional markers, FMs) encoding high and low molecular weight glutenin and gliadin alleles. Results showed
that 12 out of the 23 FMs used were polymorphic and amplified 52 polymorphic loci. Primer Ax2 ⃰ had the highest discriminatory power. The population
structure analysis classified the durum wheat collection into four populations. On average, population 4, consisting of 8 genotypes, had the highest allele
number as well as genetic variation. Analysis of molecular variance indicated that 82% of the total variation was distributed among populations. The diversity
among populations and gene flow were 0.14 and 3.03, respectively. The Jaccard distance coefficient revealed that genetic dissimilarities ranged from 0.031
between G62 and G65 to 0.725 between G36 and G51. Neighbor-joining method clustered individuals into six main groups. Results showed a remarkable level
of genetic diversity among studied durum wheat genotypes which can be of interest for future breeding programs.
Introduction
Durum wheat (Triticum turgidum L. subsp. durum, 2n = 4x = 28; AABB) is the only tetraploid species of commercial wheat cultivated over almost 17 million ha
of the Mediterranean basin and other semi-arid areas globally, with 38.1 million t (Aslan-parviz et al. 2020; Etminan et al. 2018; Xynias et al. 2020). This plant
is the primary source of semolina, often used in food products such as pasta, couscous, bulgur, various bread, and other local products (El Haddad et al. 2021;
Magallanes-López et al. 2017).
Genetic variation is an essential component of plant genetics, breeding, conservation, and evolution programs that provides a basis for selecting superior
parent compounds and predicting offspring performance (Fattah and Tayib 2020). The study of genetic variation leads to discovering new alleles or genes in
the population under investigation and thus maximizes the efficiency of breeding programs (Alemu et al. 2020). So far, numerous breeding programs have
been designed and implemented to study and measure genetic variation in durum wheat germplasm (Aslan-parviz et al. 2020). Molecular markers are among
the tools that have been successfully used to dissect many plant populations' genetic architecture and structure (Fayaz et al. 2019). During the past decades,
the use of molecular markers at the gene level, such as SSR, RFLP, RAPD, AFLP, DArT, etc., has become common in wheat genetic analysis (Kumar et al. 2021).
However, these markers are neutral, which can be somewhat distant from the genes, and are often relevant to a particular population or parents (Kage et al.
2016). Another class of DNA molecular markers is called gene-specific or functional molecular markers (FMs), based on polymorphisms within genes and are
therefore directly related to the desired trait allele. Hence, it has been suggested that FMs are preferable to random markers, especially in marker-assisted
selection projects (Li et al. 2020).
After yield, quality is one of the most critical aspects of wheat breeding programs. The quality of wheat-based food products is determined by the grain quality
characteristics (Magallanes-López et al. 2017), including high protein content, high gluten strength, and the tenacity, strength, and extensibility of dough
(Regina and Guzmán 2020). The genetic control of these properties depends mainly on the structure of glutenin and gliadin proteins. Glutenins are divided
into two subunits of High Molecular Weight (HMWGs) and Low Molecular Weight subunits (LMWGs). In durum wheat, HMWGs are encoded by Glu-A1 and
Glu-B1 loci on the long arms of the group-1 homoeologous chromosomes, whereas LMWGs are encoded by Glu-A3, GluB3, and Glu-B2 genes on the short
arms of group-1 homoeologous chromosomes (Chegdali et al. 2020). The majority of γ-gliadin and ω-gliadin genes are encoded by the Gli-1 loci on the short
arm of chromosome 1, whereas the α-gliadins encoded on the group-6 chromosomes (Hsia and Anderson 2001).
In Iran, the production and consumption of pasta are widespread. However, due to a shortage of durum semolina, bread wheat flour is often used in pasta
production resulting in technological difficulties and reduced quality (Irani 2000). Therefore, several projects were started to select suitable and high-quality
durum wheat genotypes. Due to different alleles, it seems possible to study genetic diversity based on specific markers related to grain proteins responsible for
quality. In this regard, this research aimed to investigate the genetic variation and population structure of a set of durum wheat genotypes using functional
markers associated with grain quality proteins.
Materials And Methods
Plant materials and DNA extraction
In this study, 90 durum wheat genotypes provided by Sararud Rainfed Research Center, Kermanshah, Iran, were used (Table 1). All genotypes were rainfed and
showed good performance in various experiments. Molecular experiments and genotyping of samples were performed at the Islamic Azad University of
Kermanshah. For this purpose, three seeds of each genotype were planted in the greenhouse, and the genomic DNA was extracted by the CTAB method from
plant leaves at the five-leaf stage (Murray and Thompson 1980). The DNA quality of the samples was then examined using 1% agarose gel.
Page 2/12Table 1
Specifications of 90 durum wheat geno
Genotype Pedigree
G1 MÂALI/10/ALTAR 84/CMH82A.1062//ALTAR 84/3/YAZI_10/4/SNITAN/9/USDA595/3/D67.3/RABI//CRA/4/ALO/5/HUI/YAV_1/6/ARDENTE/7/H
G2 MOHAWK/4/DUKEM_1//PATKA_7/YAZI_1/3/PATKA_7/YAZI_1/6/PLATA_6/GREEN_17/3/CHEN/AUK//BISU*2/5/PLATA_3//CREX/ALLA/3/SOM
G3 GUAYACAN INIA/2*SNITAN/3/SOMAT_3/GREEN_22//2*RASCON_37/2*TARRO_2
G4 ALTAR 84/STINT//SILVER_45/3/GUANAY/4/GREEN_14//YAV_10/AUK/5/SOMAT_4/INTER_8/6/SOMAT_3/GREEN_22//2*RASCON_37/2*TARRO
G5 PLATA_7/ILBOR_1//SOMAT_3/3/CABECA_2/PATKA_4//BEHRANG/10/1A.1D 5 + 1–06/2*WB881//1A.1D 5 + 1–06/3*MOJO/3/SOOTY_9/RASCO
G6 CBC 509 CHILE/6/ECO/CMH76A.722//BIT/3/ALTAR
84/4/AJAIA_2/5/KJOVE_1/7/AJAIA_12/F3LOCAL(SEL.ETHIO.135.85)//PLATA_13/8/SOOTY_9/RASCON_37//WODUCK/CHAM_3/9/SOOTY_9/R
12Y-1M-06Y-0B
G7 CBC 509 CHILE/6/ECO/CMH76A.722//BIT/3/ALTAR
84/4/AJAIA_2/5/KJOVE_1/7/AJAIA_12/F3LOCAL(SEL.ETHIO.135.85)//PLATA_13/8/SOOTY_9/RASCON_37//WODUCK/CHAM_3/9/SOOTY_9/R
18Y-1M-06Y-0B
G8 GUAYACAN INIA/GUANAY//PORRON_4/BEJAH_7/7/CAMAYO//HYDRANASSA30/SILVER_5/3/SOOTY_9/RASCON_37/5/DUKEM_15/3/BISU_1/P
84/ALD/4/POD_11/YAZI_1/5/VANRRI
G9 CNDO/VEE//PLATA_8/3/6*PLATA_11/6/PLATA_8/4/GARZA/AFN//CRA/3/GTA/5/RASCON/9/USDA595/3/D67.3/RABI//CRA/4/ALO/5/HUI/YAV
G10 RANCO//CIT71/CII/3/COMDK/4/TCHO//SHWA/MALD/3/CREX/5/SNITAN/6/YAZI_1/AKAKI_4//SOMAT_3/3/AUK/GUIL//GREEN/9/CBC 509 CH
84/4/AJAIA_2/5/KJOVE_1/7/AJAIA_12/F3LOCAL(SEL.ETHIO.135.85)//PLATA_13/8/SOOTY_9/RASCON_37//WODUCK/CHA
G11 CIRNO C 2008
G12 CBC 509 CHILE/5/2*AJAIA_16//HORA/JRO/3/GAN/4/ZAR/6/AJAIA_12/F3LOCAL(SEL.ETHIO.135.85)//PLATA_13/4/CHEN_1/TEZ/3/GUIL//CIT
G13 CBC 509 CHILE/6/ECO/CMH76A.722//BIT/3/ALTAR 84/4/AJAIA_2/5/KJOVE_1/7/AJAIA_12/F3LOCAL(SEL.ETHIO.135.85)//PLATA_13/8/SOOT
D/5/AVO/HUI/7/PLATA_13/8/THKNEE_11
G14 GEN/4/D68.1.93A.1A//RUFF/FGO/3/MTL_5/5/TARRO_1/2*YUAN_1//AJAIA_13/YAZI/3/SOMAT_3/PHAX_1//TILO_1/LOTUS_4/4/CANELO_8//S
G15 CBC 509 CHILE/6/ECO/CMH76A.722//BIT/3/ALTAR 84/4/AJAIA_2/5/KJOVE_1/7/AJAIA_12/F3LOCAL(SEL.ETHIO.135.85)//PLATA_13/8/SOOT
0BINIA/3/DUKEM_12/2*RASCON_21
G16 CBC 509 CHILE/6/ECO/CMH76A.722//BIT/3/ALTAR 84/4/AJAIA_2/5/KJOVE_1/7/AJAIA_12/F3LOCAL(SEL.ETHIO.135.85)//PLATA_13/8/SOOT
0BINIA/3/DUKEM_12/2*RASCON_21
G17 CBC 514 CHILE/3/AUK/GUIL//GREEN/10/CHEN_1/TEZ/3/GUIL//CIT71/CII/4/SORA/PLATA_12/5/STOT//ALTAR 84/ALD/9/USDA595/3/D67.3/
G18 GUAYACAN INIA/2*SNITAN/5/CMH85.797//CADO/BOOMER_33/4/ARMENT//SRN_3/NIGRIS_4/3/CANELO_9.1
G19 PLATA_7/ILBOR_1//SOMAT_3/3/CABECA_2/PATKA_4//BEHRANG/10/1A.1D 5 + 1–06/2*WB881//1A.1D 5 + 1–06/3*MOJO/3/SOOTY_9/RASCO
G20 GUAYACAN INIA/POMA_2//SNITAN/4/D86135/ACO89//PORRON_4/3/SNITAN/5/CAMAYO/GUANAY/4/ARMENT//SRN_3/NIGRIS_4/3/CANELO_
84/4/AJAIA_2/5/KJOVE_1/7/AJAIA_12/F3LOCAL(SEL.ETHIO.135.85)//PLATA_13/8/SOOTY_9/RASCON_
G21 CAMAYO/2*KUCUK/3/SOOTY_9/RASCON_37//GUAYACAN INIA/5/TARRO_1/2*YUAN_1//AJAIA_13/YAZI/3/SOMAT_3/PHAX_1//TILO_1/LOTUS
G22 AINZEN_1//PLATA_6/GREEN_17/5/TATLER_1/TARRO_1/3/CANELO_8//SORA/2*PLATA_12/4/ARMENT//SRN_3/NIGRIS_4/3/CANELO_9.1
G23 DACK/KIWI//OSTE/3/CHEN84_1/4/MEXI75/5/NIGRIS_4/6/CANELO_8//SORA/2*PLATA_12/7/SOMAT_4/INTER_8/8/GEDIZ/FGO//GTA/3/SRN_
G24 SELIM/6/AJAIA_12/F3LOCAL(SEL.ETHIO.135.85)//PLATA_13/3/SOMBRA_20/4/SNITAN/5/SOMAT_4/INTER_8/7/NASR 99/4/BCRIS/BICUM//L
G25 SELIM/3/CF4-JS 21//TECA96/TILO_1/4/SORA/2*PLATA_12//SRN_3/NIGRIS_4
G26 ARMENT//SRN_3/NIGRIS_4/3/CANELO_9.1/4/TOSKA_26/RASCON_37//SNITAN/5/PLAYERO
G27 WID22241/4/ARMENT//SRN_3/NIGRIS_4/3/CANELO_9.1/5/TARRO_1/2*YUAN_1//AJAIA_13/YAZI/3/SOMAT_4/INTER_8/4/ARMENT//SRN_3/N
G28 ALAMO:DR/4/ARMENT//SRN_3/NIGRIS_4/3/CANELO_9.1/5/PLATA_6/GREEN_17//SNITAN/4/YAZI_1/AKAKI_4//SOMAT_3/3/AUK/GUIL//GREE
G29 E90040/MFOWL_13//LOTAIL_6/3/PROZANA/ARLIN//MUSK_6/9/USDA595/3/D67.3/RABI//CRA/4/ALO/5/HUI/YAV_1/6/ARDENTE/7/HUI/YAV7
G30 ALTAR
84/STINT//SILVER_45/3/GUANAY/4/GREEN_14//YAV_10/AUK/10/CMH79.959/CHEN//SOOTY_9/RASCON_37/9/USDA595/3/D67.3/RABI//CR
G31 ZENIT/5/SORA/2*PLATA_12//RASCON_37/4/ARMENT//SRN_3/NIGRIS_4/3/CANELO_9.1/6/MINIMUS_4/GRO_2/3/PROZANA/ARLIN//MUSK_6
G32 SIMETO/3/SORA/2*PLATA_12//SRN_3/NIGRIS_4/5/TOSKA_26/RASCON_37//SNITAN/4/ARMENT//SRN_3/NIGRIS_4/3/CANELO_9.1
G33 P91.272.3.1/3*MEXI75//2*JUPARE C 2001/5/ARTICO/AJAIA_3//HUALITA/3/FULVOUS_1/MFOWL_13/4/TECA96/TILO_1/6/RISSA/GAN//POHO
G34 P91.272.3.1/3*MEXI75//2*JUPARE C 2001/5/ARTICO/AJAIA_3//HUALITA/3/FULVOUS_1/MFOWL_13/4/TECA96/TILO_1/6/RISSA/GAN//POHO
G35 ALTAR
84/STINT//SILVER_45/3/GUANAY/4/GREEN_14//YAV_10/AUK/10/CMH79.959/CHEN//SOOTY_9/RASCON_37/9/USDA595/3/D67.3/RABI//CR
G36 ARMENT//SRN_3/NIGRIS_4/3/CANELO_9.1/4/STOT//ALTAR 84/ALD/3/PATKA_7/YAZI_1/5/HUALITA
Page 3/12Genotype Pedigree
G37 ODIN_15/WITNEK_1//ISLOM_1/6/MINIMUS/COMB DUCK_2//CHAM_3/3/FICHE_6/4/MOJO/AIRON/5/SOMAT_3.1
G38 TRIDENT/3*KUCUK
G39 PLANETA/AMIC//BERGAND/TRILE/3/KNIPA
G40 ATIL/3/KNIPA/TAGUA//PLANETA/TRILE
G41 ATIL/HELLER #1 CDSS09Y00298S-099Y-043M-27Y-0M-04Y-0B
G42 ATIL/BAIRDS CDSS09Y00386S-099Y-058M-23Y-0M-04Y-0B
G43 ATIL/BAIRDS CDSS09Y00388S-099Y-047M-19Y-0M-04Y-0B
G44 ATIL/3/KNIPA/TAGUA//PLANETA/TRILE
G45 CIRNO C 2008/HELLER #1 CDSS09Y00771T-099Y-040M-10Y-0M-04Y-0B
G46 CIRNO C 2008/BAIRDS CDSS09Y00795T-099Y-024M-29Y-0M-04Y-0B
G47 CIRNO C 2008/BAIRDS CDSS09Y00449S-099Y-011M-10Y-0M-04Y-0B
G48 CIRNO C 2008/3/KNIPA/TAGUA//PLANETA/TRILE CDSS08B00149T-099Y-056M-16Y-0M-04Y-0B
G49 CIRNO C 2008/3/KNIPA/TAGUA//PLANETA/TRILE CDSS09Y00970T-099Y-063M-11Y-0M-04Y-0B
G50 CIRNO C 2008/3/KNIPA/TAGUA//PLANETA/TRILE CDSS09B00077S-099Y-014M-4Y-3M-06Y-0B
G51 CIRNO C 2008/3/KNIPA/TAGUA//PLANETA/TRILE CDSS10Y00288S-099Y-038M-17Y-1M-06Y-0B
G52 ATIL*2/HELLER #1 CDSS10Y00291S-099Y-044M-5Y-2M-06Y-0B
G53 ATIL*2/BAIRDS CDSS10Y00491T-099Y-040M-7Y-1M-06Y-0B
G54 ATIL*2/DUNKER CDSS10Y00493T-099Y-035M-9Y-4M-06Y-0B
G55 ATIL*2/3/KNIPA/TAGUA//PLANETA/TRILE CDSS10Y00500T-099Y-028M-1Y-4M-06Y-0B
G56 ATIL*2/3/KNIPA/TAGUA//PLANETA/TRILE CDSS10Y00504T-099Y-037M-5Y-2M-06Y-0B
G57 ATIL*2/3/KNIPA/TAGUA//PLANETA/TRILE CDSS10Y00517T-099Y-055M-13Y-4M-06Y-0B
G58 CIRNO C 2008*2/HELLER #1 CDSS09B00261T-099Y-046M-7Y-2M-06Y-0B
G59 CIRNO C 2008*2/HELLER #1 CDSS09B00268T-099Y-050M-3Y-4M-06Y-0B
G60 CIRNO C 2008*2/BAIRDS CDSS09B00347T-099Y-033M-13Y-3M-06Y-0B
G61 CIRNO C 2008*2/BAIRDS CDSS10Y00539T-099Y-025M-29Y-1M-06Y-0B
G62 CIRNO C 2008*2/BAIRDS CDSS10Y00550T-099Y-014M-7Y-3M-06Y-0B
G63 CIRNO C 2008*2/BAIRDS CDSS10Y00550T-099Y-014M-8Y-3M-06Y-0B
G64 CIRNO C 2008*2/BAIRDS CDSS10Y00553T-099Y-068M-8Y-3M-06Y-0B
G65 CIRNO C 2008*2/BAIRDS CDSS10Y00556T-099Y-031M-16Y-2M-06Y-0B
G66 CIRNO C 2008*2/BAIRDS CDSS09B00483D-099Y-032M-2Y-1M-06Y-0B
G67 CIRNO C 2008*2/BAIRDS CDSS09B00490D-099Y-032M-11Y-3M-06Y-0B
G68 CIRNO C 2008*2/BAIRDS CDSS10Y00572T-099Y-030M-13Y-1M-06Y-0B
G69 CIRNO C 2008*2/BAIRDS CDSS10Y00573T-099Y-056M-4Y-4M-06Y-0B
G70 CIRNO C 2008*2/BAIRDS CDSS09B00128S-099Y-057M-1Y-1M-06Y-0B
G71 CIRNO C 2008*2/DUNKER CDSS09B00150S-099Y-023M-4Y-1M-06Y-0B
G72 CIRNO C 2008*2/DUNKER CDSS10Y00017S-099Y-034M-7Y-1M-06Y-0B
G73 CIRNO C 2008*2/DUNKER CMSS08B01003S-099B-099Y-22B-0Y
G74 CIRNO C 2008*2/DUNKER CDSS07Y00746T-099Y-099M-5Y-3M-04Y-0B
G75 CIRNO C 2008*2/DUNKER CDSS07Y00079S-099Y-099M-4Y-2M-04Y-0B
G76 CIRNO C 2008*2/DUNKER CDSS06B00053S-099Y-099M-12Y-2B-04Y-0B
G77 CIRNO C 2008*2/DUNKER CDSS08Y00401S-099Y-028M-9Y-4M-0Y
G78 CIRNO C 2008*2/DUNKER CDSS09Y00029S-099Y-020M-9Y-0M-04Y-0B
G79 CIRNO C 2008*2/3/KNIPA/TAGUA//PLANETA/TRILE CDSS09Y00241S-099Y-022M-10Y-0M-04Y-0B
Page 4/12Genotype Pedigree
G80 CIRNO C 2008*2/3/KNIPA/TAGUA//PLANETA/TRILE CDSS09Y00286S-099Y-026M-24Y-0M-04Y-0B
G81 CIRNO C 2008*2/3/KNIPA/TAGUA//PLANETA/TRILE CDSS09Y00762T-099Y-024M-20Y-0M-04Y-0B
G82 CIRNO C 2008*2/3/KNIPA/TAGUA//PLANETA/TRILE CDSS09Y00771T-099Y-040M-3Y-0M-04Y-0B
G83 CIRNO C 2008*2/3/KNIPA/TAGUA//PLANETA/TRILE CDSS10Y00498T-099Y-018M-12Y-1M-06Y-0B
G84 CIRNO C 2008*2/3/KNIPA/TAGUA//PLANETA/TRILE CDSS10Y00498T-099Y-018M-18Y-1M-06Y-0B
G85 PLATINUM*2/3/KNIPA/TAGUA//PLANETA/TRILE
G86 Dehdasht/IC-142070 IRD2010-11-003-OMAR-OMAR-OSAR-OSAR-OSAR-1SAR
G87 Saji
G88 Zahab
G89 SRN-1/KILL//2*FOLTA-1
G90 Imren
Genotyping assays
In this study, a set of 23 gene-specific primers encoding alleles gliadin, HMWGS, and LMWGS (high and low molecular weight glutenin subunits, respectively),
made by Sinaclon Co., Tehran, Iran, were initially tested (Table 2). The polymerase chain reaction was performed using a thermocycler (Techne model TC-
5000) in a volume of 15 µl consisted of 2 µl template DNA from each sample, one µl of each primer (0.5 forward and 0.5 reverse), 4.5 µl double distilled water,
and 7.5 µl master mix. The PCR reaction was carried out as follows: an initial denaturation step at 94°C for 5 min, followed by 35 cycles of denaturation at
94°C for 30 s, primer annealing at 56°C for 30 s and primer elongation at 72°C for 1 min; the final extension at 72°C was held for 5 min. The PCR products
were electrophoresed on a 1.5% agarose gel with TBE 1X buffer, stained with Safe View, and finally photographed under UV light. Of the above 23 markers
mentioned, only 12 were polymorphic. Therefore, the experiment was continued based on the 12 markers (Table 2).
Table 2
Locus name and sequences of 12 gene-specific markers related to grain quality used.
Marker/gene Forward Sequences (5' → 3') Backward Sequences (5' → 3') Reference
α/β-Gliadin gli-AS_3 TCACCGCTACAACGACCAAACCATGTTT GCAACCATTTCTGCCACAACTACCAT Kawaura et al. (2006)
gli-AS_4 CCTAGGCCTATGGGTTCTGCTGAGA GCAACCACAGTATCCGCAACCAC Kawaura et al. (2006)
LMW-GS glu-AS_2 GGCACAGGGTACCTTTTTGCATC ATACAAGGGCACATTGACACGGC Kawaura et al. (2006)
glu-A1 CGAGACAATATGAGCAGCAAG CTGCCATGGAGAAGTTGGA Li et al. (2008)
glu3A.1 GCCGTTGCGCAAATTTCACAG AACAGATGGATGAATAACTGGTAT Long et al. (2005)
glu3A.2 AGTGCCATTGCGCAGATGAAT AACGGATGGTTGAACAATAGA Long et al. (2005)
glu3A.3 ATGGAGACTAGCTGCATCC CTGCAAAAAGGTACCCTTTT
glu-A3ac AAACAGAATTATTAAAGCCGG GTGGCTGTTGTGAAAACGA Wang et al. (2010)
glu-A3f AAACAGAATTATTAAAGCCGG GCTGCTGCTGCTGTGTAAA Wang et al. (2010)
glu-A3g AAACAGAATTATTAAAGCCGG AAACAACGGTGATCCAACTAA Wang et al. (2010)
HMW-GS Ax2 * ATGACTAAGCGGTTGGTTCTT ACCTTGCTCCCCTTGTCTTT Ma et al. (2003)
ZSBy9aF1/R3 TTCTCTGCATCAGTCAGGA AGAGAAGCTGTGTAATGCC Lei et al. (2006)
Data analysis
First, bands formed on the gel were scored as absent (0) and present (1), compiling the data as a binary matrix. To compare the banding patterns of primers,
some genetic parameters were calculated by using PowerMarker 3.25 software (He et al. 2020). The Polymorphic Information Content (PIC) of each locus was
calculated as , where pi is the frequency of the ith allele. The Resolving power (Rp) of each locus was calculated as Rp = Σ 1- (2 × |0.5 - pi|).
The heterozygosity (He) value was computed according to Nei’s formula as He =1- . The Shannon’s Information index was determined as I = -Σ pi × ln
pi. The genetic variability indices, including total amplified bands (TAB), the number of polymorphic bands (NPB), percentage of polymorphic bands (PPB), the
effective number of alleles (Ne), Nei's gene diversity (h), diversity among populations (Gst), and the estimate of gene flow (Nm) were estimated using
POPGENE version 1.32 (Negisho et al. 2021). The distribution of genetic variation within and among populations (AMOVA) and principal coordinate analysis
(PCoA) was carried out using the GenAlex 6.5 software (Peakall and Smouse 2012). The model-based STRUCTURE version 2.3.4 was used to recognize
subpopulations of genetically similar individuals. The optimal number of subpopulations was determined by using Structure Harvester software (Earl and
Page 5/12vonHoldt 2012) according to the ΔK approach proposed by Evanno et al. (2005). Cluster analysis was performed using MEGA 6.0 software. First, the Jaccard’s
dissimilarity distance matrix was calculated using DARWIN software version 6.0 (Shaygan et al. 2021). Afterward, the cluster dendrogram was obtained using
the neighbor-joining method based on the distance matrix.
Results
Of the 23 initial FMs tested on 90 durum genotypes, only 12 (52.2%) were polymorphic. These 12 primers created a total of 52 polymorphic bands. On
average, 4.33 bands were amplified per primer of which, four primers had only two bands, whereas glu3A.1 and glu-A3ac produced seven bands (Table 3). The
mean number of effective alleles (Ne) was 1.56 per locus. Markers gli-AS_4 and glu-A1 with 1.98 and 1.01 alleles showed the highest and lowest Ne,
respectively. The polymorphism information content (PIC) values varied from 0.011 (by glu-A1) to 0.287 (by Ax2 *), with an average of 0.139. The highest and
lowest values of marker index (MI) were observed for primer Ax2 * (1.72) and primer glu-A1 (0.011), respectively, with an average of 0.68 (Table 3).
Furthermore, the mean values for resolving power (Rp) was 4.51 and ranged from 2.38 to 8.97 for primers gli-AS_3 and Ax2 *, respectively (Table 3).
Table 3
Discriminating power statistics and the amplification results of 12 gene-specific markers related to grain quality used in the study.
Marker/Locus TAB NPB PPB% Ne PIC MI Rp
α/β-Gliadin gli-AS_3 2 1 50 1.81 0.153 0.306 2.38
gli-AS_4 6 5 83.3 1.98 0.045 0.271 5.88
LMW-GS glu-AS_2 5 4 80 1.74 0.261 1.306 4.20
glu-A1 2 1 50 1.01 0.011 0.011 3.97
glu3A.1 7 6 85.7 1.60 0.216 1.516 3.80
glu3A.2 6 6 100 1.60 0.104 0.625 3.16
glu3A.3 3 1 50 1.72 0.060 0.180 4.20
glu-A3ac 7 7 100 1.83 0.150 1.050 5.55
glu-A3f 4 3 75 1.78 0.225 0.900 4.44
glu-A3g 2 1 50 1.14 0.123 0.247 3.71
LMW-GS Ax2 * 6 6 100 1.50 0.287 1.720 8.97
ZSBy9aF1/R3 2 2 100 1.04 0.043 0.086 3.91
Mean 4.33 3.58 77.00 1.56 0.139 0.680 4.51
TAB total amplified bands, NPB number of polymorphic bands, PPB percentage of polymorphic bands, Ne number of effective alleles, h Nei's gene
diversity, I Shannon's information index, PIC polymorphism information content, MI marker index, Rp resolving power.
The results of the population structure analysis have been shown in Figs. 1 and 2. First, to detect the optimal number of subpopulations that best fit the data,
the likelihood values of partitioning (ΔK) were plotted across multiple values of K (Fig. 1), assuming that the loci are independent in Hardy-Weinberg
equilibrium and K is the number of populations. As shown in Fig. 1, the maximum likelihood value was obtained when the initial population was divided into
four subpopulations. Accordingly, the durum wheat collection was classified into four subpopulations, containing 30, 19, 33, and 8 members, respectively (Fig.
2). The summary of the genetic diversity parameters of the four detected populations has been shown in Table 4. The percentage of polymorphic loci were
42.31, 44.23, 42.31, and 75.00 for subpopulations 1 to 4, respectively. The number of different alleles ranged from 1.13 for subpopulation 1 to 1.69 for
subpopulation 4. Similarly, subpopulations 1 and 4 with 1.18 and 1.38 had the lowest and the highest number of effective alleles, respectively. Also, the
Shannon's index were 0.18, 0.21, 0.19, and 0.37, for subpopulations 1 to 4, respectively. Furthermore, the Nei's gene diversity values were 0.11, 0.14, 0.12, and
0.24, respectively (Table 4). These results revealed that subpopulation 4 genotypes had the highest genetic variation than others while subpopulation 1 had
the lowest.
Table 4
Summary of genic variation statistics estimated using gene-specific primers related to grain quality for the four subpopulations studied durum wheat
genotypes.
Sub pop No. Size PPL% Na Ne I h
1 30 42.31 1.13 1.18 0.18 0.11
2 19 44.23 1.23 1.22 0.21 0.14
3 33 42.31 1.21 1.20 0.19 0.12
4 8 75.00 1.69 1.38 0.37 0.24
PPL percentage of polymorphic loci, Na number of different alleles, Ne number of effective alleles, I Shannon's Information index, h Nei's gene diversity
The allele distribution statistics across the 4 populations have been presented in Fig. 3. Population 4 showed the highest numbers of different bands (49)
whereas population 1 had the lowest (37). There were 2 and 7 bands unique to populations 2 and 4, respectively. Also, no bands were found at less than or
Page 6/12equal to 25% of the population. The number of less common bands presented at less than or equal to 50% of the populations was reported in subpopulations
2, 3, and 4. Likewise, the mean diversity ranged from 0.112 (population 1) to 0.238 (population 4).
The analysis of molecular variance (AMOVA) showed that the variation between the populations was 18% of the total variation while 82% of the variations
were among individuals within the population, indicating that most amplified fragments were informative for separating the genotypes. In addition, the
diversity among populations and gene flow were 0.14 and 3.03, respectively (Table 5).
Table 5
Analysis of molecular variance (AMOVA) based on Gene-specific markers related to grain quality for four populations of durum wheat
Source df SS MS Est. Var. Variation (%) Gst Nm
Among Pops 3 61.441 20.480 0.796 18%
Within Pops 86 309.259 3.596 3.596 82%
Total 89 370.700 4.392 100% 0.14 3.03
df degree of freedom, SS sum of squares, MS means of squares, Est. Var estimated variance components, Gst diversity among populations, Nm estimate
of gene flow.
Calculation of the Jaccard distance coefficient revealed that genetic dissimilarities ranged from 0.031 between G62 and G65 to 0.725 between G36 and G51
(Data not shown). These results showed that the primers used in the study had an appropriate potential for calculating genetic distances and detecting
relationships among durum wheat genotypes.
Cluster analysis based on the neighbor-joining method grouped the 90 individuals into four main clusters (Fig. 4). According to the subpopulations, the
clustering pattern was different from that detected by structure classification results.
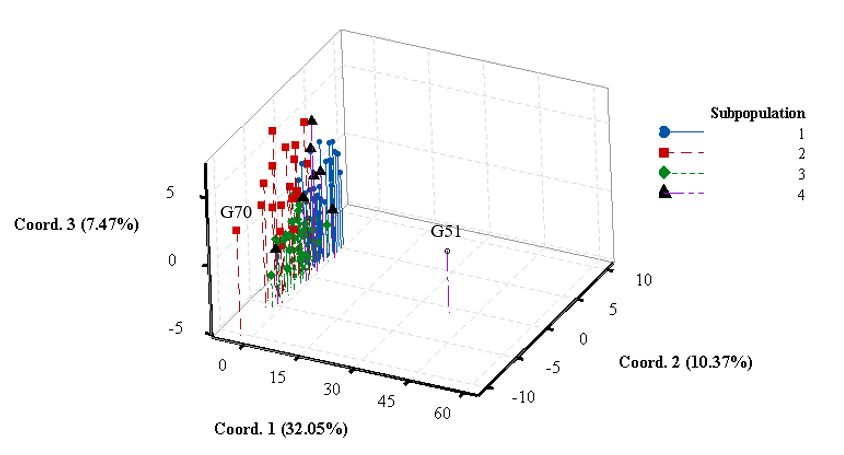
The results of the Principal coordinates analysis revealed that genotype G51 had a significant load on the first coordinate. Besides, due to their relatively large
distance from other genotypes, G51, G70 had the highest degree of dissimilarity compared to different genotypes (Fig. 5).
Discussion
Genetic diversity stems from the natural selection of wild ancestors and mediation through farmers and breeders. The study of genetic diversity is essential in
understanding the structure of germplasm. So far, genetic diversity analysis in crops has been applied for breeding programs related to the marker-trait
association, marker-assisted selection, creation of artificial variation to find specific hybrids, and crop germplasm conservation (Negisho et al. 2021). In the
past decades, different molecular tools such as neutral and functional DNA markers were introduced to plant breeding programs. Compared with neutral DNA
markers, FMs have the advantage of being entirely associated with target genes. Therefore, FMs have been preferred in biodiversity studies (van Tienderen et
al. 2002; Wu et al. 2020).
In this study, polymorphisms derived from FMs related to grain quality proteins were used to evaluate the genetic diversity of a collection of 90 durum wheat
genotypes for future selective breeding programs. The results showed a relatively high level of molecular variability among the studied genotypes. Compared
to neutral markers, the markers used in this study have been occasionally used in genetic diversity assays because gene-specific primers are often used in
marker-assisted selection programs (Liu et al. 2012). Therefore, this is the first-of-its-kind report which shows the applicability of FMs, associated with wheat
grain quality proteins, in assessing the genetic diversity of durum wheat. Significant polymorphisms and the formation of more than one band were among
the practical factors in obtaining acceptable results. Some other kinds of FMs, such as CAAT box-derived polymorphism primers, have been used successfully
to evaluate the genetic diversity of durum wheat (Shaygan et al. 2021; Etminan et al. 2019; Khodaee et al. 2021; Ghobadi et al. 2021).
According to our results, FMs had an acceptable percentage of polymorphic bands. Also, Marker information parameters showed the differentiation power of
these primers and thus the appropriate efficiency of this type of DNA marker to investigate the genetic diversity in the germplasm of durum wheat. Of the
primers used, four primers had PIC values above 0.20, indicating that these primers were informative in determining polymorphism. AMOVA results revealed
that there was a higher percentage of genetic variation within durum populations than among populations. This result is also confirmed by the Gst value
(diversity among populations). Zang et al. (2018) proposed that Gst is an important parameter to measure whether genetic differentiation exists among
populations. When the Gst value falls between 0.05 and 0.15, the genetic differentiation is considered as the medium. Therefore the identified subpopulations
were estimated to have the medium value of genetic differentiation. The Nm index, the number of migrants per generation, is an estimation of the gene flow.
The distribution of genetic diversity between and within populations is a consequence of the amount of gene flow between them. Gene flow rate, in turn, is
affected by the number of seeds or pollen that move between populations (Etminan et al. 2018). Nm values higher than 1 indicate that a weak possibility of
genetic drift inhibits differentiation among populations whereas Nms less than 1 specify that local populations tend to differentiate. Hence, the higher Nm the
less genetic differentiation among populations (Chen et al. 2020). Accordingly, in our study, the existence of large gene flow (Nm = 3.03) among populations
decreased the degree of genetic differentiation among populations.
The Nei genetic diversity index and the Shannon Index are known as the most genetic diversity parameters to show diversity and differentiation between and
within populations (Carvalho et al. 2010). The higher values of these indices denote the greater the genetic diversity (Que et al. 2014). In the current study, the
level of variability between h and I indices revealed a high level of genetic diversity among subpopulations 2 and 4. The former was rich in α/β-Gliadin alleles
while the latter showed a high percentage of bands associated with HMW-GS (data not shown). These results indicated that these populations of durum
wheat may be a good source of grain quality-related protein subunits that can be used for a variety of purposes including breeding programs related to quality
improvement especially in crosses with elite durum wheat germplasm.
Page 7/12As it can be seen, the clustering pattern (Fig. 4) was not consistent with that obtained from the population structure algorithm (Fig. 2). STRUCTURE identifies
subsets by detecting allele frequency differences within the data and assigns individuals to those sub-populations based on analysis of likelihoods (Porras-
Hurtado et al. 2013) while cluster analysis subdivides cases into clusters according to a specific measure of similarity and arranges cases in a hierarchy.
Therefore, the observed results may be due to differences in the algorithm of the two methods. For example, in cluster analysis, a relatively large genetic
distance between genotype G51 and other genotypes left this genotype in a single group while such a thing was not observed in grouping by STRUCTURE
analysis (Figs. 2 and 4). This result is also supported by PCoA analysis (Fig. 5)
Breeding targets will have an advantage when the focus is on the cross of distant genotypes, or to increase diversity and identify new genes to further improve
wheat. Hence, the classification and characterization of wheat germplasm is a prerequisite stage in the selection and improvement of wheat. The results of
this study could be useful to select parents to be crossed for obtaining new appropriate populations intended for transgressive segregation of some important
agronomic characters in the descendant populations. Our results confirmed a high level of genetic diversity in the studied genotypes. In addition, the results
revealed that the FMs were reproducible, efficient, and powerful to assess genetic diversity among durum wheat genotypes.
Abbreviations
AMOVA Analysis of molecular variance
FM Functional marker
HMWGs High molecular weight glutenin subunits
I Shannon's Information Index
LMWGs Low molecular weight glutenin subunits
MI Marker index
Ne Number of effective alleles
Nm The estimate of gene flow
NPB The number of polymorphic bands
PCoA Principal coordinate analysis
PIC Polymorphism information content
PPB Percentage of polymorphic bands
Rp Resolving power
TAB Total amplified bands
UPGMA Unweighted pair group method with arithmetic mean
Declarations
Acknowledgments The authors thank the Sararud Dryland Agricultural Research Institute of Kermanshah for its sincere cooperation in providing the
genotypes.
Author contributions
Conceptualization: ZMKh, RA, AMM, MK, AE; Data curation: RA, AMM, MK, AE; Formal analysis: ZMKh, RA; Investigation: ZMKh, RA, AMM, MK, AE;
Methodology: RA, AMM, MK, AE; Validation: RA, AMM, MK, AE; Writing original draft: ZMKh, Review, and editing: RA, AE
Funding Not applicable.
Data availability Data related to the results obtained in the present study are available from the corresponding author by request.
Ethics approval Not applicable
Conflict of interest The authors of this article have no conflicts of interest.
Consent for publication All authors have given their consent for publication.
References
Page 8/121. Alemu A, Feyissa T, Letta T, Abeyo B (2020) Genetic diversity and population structure analysis based on the high-density SNP markers in Ethiopian
durum wheat (Triticum turgidum ssp. durum). BMC Genet 21(1):18. https://doi.org/10.1186/s12863-020-0825-x
2. Aslan-parviz M, Omidi M, Rashidi V, Etminan A, Ahmadzadeh A (2020) Evaluation of genetic diversity of durum wheat (Triticum durum desf.) genotypes
using inter-simple sequence repeat (ISSR) and caat box-derived polymorphism (CBDP) markers. Genetika 52(3):895–909.
https://doi.org/10.2298/GENSR2003895A
3. Carvalho MA, Quesenberry KH, Gallo M (2010) Comparative assessment of variation in the USA Arachis pintoi (Krap. and Greg.) germplasm collection
using RAPD profiling and tissue culture regeneration ability. Plant Syst Evol 288(3):245–251. https://doi.org/10.1007/s00606-010-0335-9
4. Chegdali Y, Ouabbou H, Essamadi A, Cervantes F, Ibba MI, Guzmán C (2020) Assessment of the glutenin subunits diversity in a durum wheat (T. turgidum
ssp. durum) collection from Morocco. Agron J 10(7):957
5. Chen C, Chu Y, Ding C, Su X, Huang Q (2020) Genetic diversity and population structure of black cottonwood (Populus deltoides) revealed using simple
sequence repeat markers. BMC Genet 21(1):2. https://doi.org/10.1186/s12863-019-0805-1
6. Earl DA, vonHoldt BM (2012) STRUCTURE HARVESTER: a website and program for visualizing STRUCTURE output and implementing the Evanno
method. Conserv Genet Resour 4(2):359–361. https://doi.org/10.1007/s12686-011-9548-7
7. El Haddad N, Kabbaj H, Zaïm M, El Hassouni K, Tidiane Sall A, Azouz M, Ortiz R, Baum M, Amri A, Gamba F, Bassi FM (2021) Crop wild relatives in durum
wheat breeding: Drift or thrift? Crop Sci 61(1):37–54. https://doi.org/10.1002/csc2.20223
8. Etminan A, Pour-Aboughadareh A, Mehrabi AA, Shooshtari L, Ahmadi-Rad A, Moradkhani H (2019) Molecular characterization of the wild relatives of
wheat using CAAT-box derived polymorphism. Plant Biosyst 153(3):398–405. https://doi.org/10.1080/11263504.2018.1492993
9. Etminan A, Pour-Aboughadareh A, Mohammadi R, Noori A, Ahmadi-Rad A (2018) Applicability of CAAT Box-derived Polymorphism (CBDP) markers for
analysis of genetic diversity in durum wheat. Cereal Res Commun 46(1):1–9. https://doi.org/10.1556/0806.45.2017.054
10. Evanno G, Regnaut S, Goudet J (2005) Detecting the number of clusters of individuals using the software STRUCTURE: a simulation study. Mol Ecol
14(8):2611–2620. https://doi.org/10.1111/j.1365-294X.2005.02553.x
11. Fattah YM, Tayib NN (2020) Assessment of genetic diversity and population structure of some soft and hard wheat varieties based on SSR marker. Sci j
Univ Zakho 8(3):80–87
12. Fayaz F, Aghaee Sarbarzeh M, Talebi R, Azadi A (2019) Genetic diversity and molecular characterization of Iranian durum wheat landraces (Triticum
turgidum durum (Desf.) Husn.) using DArT markers. Biochem Genet 57(1):98–116. https://doi.org/10.1007/s10528-018-9877-2
13. Ghobadi G, Etminan A, Mehrabi AM, Shooshtari L (2021) Molecular diversity analysis in hexaploid wheat (Triticum aestivum L.) and two Aegilops species
(Aegilops crassa and Aegilops cylindrica) using CBDP and SCoT markers. J Genet Eng Biotechnol 19(1):56. https://doi.org/10.1186/s43141-021-00157-8
14. He Z, Rasheed A, Xia X, Ma W (2020) Molecular marker development and application for improving qualities in bread wheat. In: Igrejas G, Ikeda TM,
Guzmán C (eds) Wheat Quality For Improving Processing And Human Health. Springer International Publishing, Cham, pp 323–345.
https://doi.org/10.1007/978-3-030-34163-3_14
15. Hsia CC, Anderson OD (2001) Isolation and characterization of wheat ω-gliadin genes. Theor Appl Genet 103(1):37–44. https://doi.org/10.1007/s00122-
001-0552-2
16. Irani P (2000) Pasta quality traits of some durum wheat varieties. J Agric Sci Technol 2(2):143–148
17. Kage U, Kumar A, Dhokane D, Karre S, Kushalappa AC (2016) Functional molecular markers for crop improvement. Crit Rev Biotechnol 36(5):917–930.
https://doi.org/10.3109/07388551.2015.1062743
18. Kawaura K, Mochida K, Ogihara Y (2006) Expression profile of two storage-protein gene families in hexaploid wheat revealed by large-scale analysis of
expressed sequence tags. Plant Physiol 139:1870–1880. https://doi.org/10.1104/pp.105.070722
19. Khodaee L, Azizinezhad R, Etminan AR, Khosroshahi M (2021) Assessment of genetic diversity among Iranian Aegilops triuncialis accessions using ISSR,
SCoT, and CBDP markers. J Genet Eng Biotechnol 19(1):5. https://doi.org/10.1186/s43141-020-00107-w
20. Kumar S, Kumar M, Mir RR, Kumar R, Kumar S (2021) Advances in molecular markers and their use in genetic improvement of wheat. In: Wani SH, Mohan
A, Singh GP (eds) Physiological, Molecular, and Genetic Perspectives of Wheat Improvement. Springer, Cham. https://doi.org/10.1007/978-3-030-59577-
7_8
21. Lei ZS, Gale KR, He ZH, Gianibelli C, Larroque O, Xia XC, Butow BJ, Ma W (2006) Y-type gene-specific markers for enhanced discrimination of high-
molecular-weight glutenin alleles at the Glu-B1 locus in hexaploid wheat. J Cereal Sci 43(1):94–101. https://doi.org/10.1016/j.jcs.2005.08.003
22. Li W, Zeng X, Li S, Chen F, Gao J (2020) Development and application of two novel functional molecular markers of BADH2 in rice. Electron J Biotechnol
46:1–7. https://doi.org/10.1016/j.ejbt.2020.04.004
23. Li X, Wang A, Xiao Y, Yan Y, He Z, Appels R, Ma W, Hsam SLK, Zeller FJ (2008) Cloning and characterization of a novel low molecular weight glutenin
subunit gene at the Glu-A3 locus from wild emmer wheat (Triticum turgidum L. var. dicoccoides). Euphytica 159(1):181–190.
https://doi.org/10.1007/s10681-007-9471-x
24. Liu Y, He Z, Appels R, Xia X (2012) Functional markers in wheat: current status and future prospects. Theor Appl Genet 125(1):1–10.
https://doi.org/10.1007/s00122-012-1829-3
25. Long H, Wei Y-M, Yan Z-H, Baum B, Nevo E, Zheng Y-L (2005) Classification of wheat low-molecular-weight glutenin subunit genes and its chromosome
assignment by developing LMW-GS group-specific primers. Theor Appl Genet 111(7):1251–1259. https://doi.org/10.1007/s00122-005-0024-1
26. Ma W, Zhang W, Gale KR (2003) Multiplex-PCR typing of high molecular weight glutenin alleles in wheat. Euphytica 134(1):51–60.
https://doi.org/10.1023/A:1026191918704
Page 9/1227. Magallanes-López AM, Ammar K, Morales-Dorantes A, González-Santoyo H, Crossa J, Guzmán C (2017) Grain quality traits of commercial durum wheat
varieties and their relationships with drought stress and glutenins composition. J Cereal Sci 75:1–9. https://doi.org/10.1016/j.jcs.2017.03.005
28. Murray MG, Thompson WF (1980) Rapid isolation of high molecular weight plant DNA. Nucleic acids research 8(19):4321–4325.
https://doi.org/10.1093/nar/8.19.4321
29. Negisho K, Shibru S, Pillen K, Ordon F, Wehner G (2021) Genetic diversity of Ethiopian durum wheat landraces. Plos one 16(2):e0247016
30. Peakall R, Smouse PE (2012) GenAlEx 6.5: genetic analysis in Excel. Population genetic software for teaching and research–an update. Bioinformatics
28(19):2537–2539. https://doi.org/10.1093/bioinformatics/bts460
31. Porras-Hurtado L, Ruiz Y, Santos C, Phillips C, Carracedo A, Lareu MV (2013) An overview of STRUCTURE: applications, parameter settings, and
supporting software. Front Genet 4:98–98. https://doi.org/10.3389/fgene.2013.00098
32. Que Y, Pan Y, Lu Y, Yang C, Yang Y, Huang N, Xu L (2014) Genetic analysis of diversity within a chinese local sugarcane germplasm based on start codon
targeted polymorphism. Biomed Res Int 2014:468375. https://doi.org/10.1155/2014/468375
33. Regina A, Guzmán C (2020) Starch and starch-associated proteins: Impacts on wheat grain quality. In: Igrejas G, Ikeda T, Guzmán C (eds) Wheat Quality
For Improving Processing And Human Health. Springer, Cham. https://doi.org/10.1007/978-3-030-34163-3_3
34. Shaygan N, Etminan A, Majidi Hervan I, Azizinezhad R, Mohammadi R (2021) The study of genetic diversity in a minicore collection of durum wheat
genotypes using agro-morphological traits and molecular markers. Cereal Res Commun 49(1):141–147. https://doi.org/10.1007/s42976-020-00073-6
35. van Tienderen PH, de Haan AA, van der Linden CG, Vosman B (2002) Biodiversity assessment using markers for ecologically important traits. Trends Ecol
Evol 17(12):577–582. https://doi.org/10.1016/S0169-5347(02)02624-1
36. Wang L, Li G, Peña RJ, Xia X, He Z (2010) Development of STS markers and establishment of multiplex PCR for Glu-A3 alleles in common wheat (Triticum
aestivum L.). J Cereal Sci 51(3):305–312. https://doi.org/10.1016/j.jcs.2010.01.005
37. Wu Y, Li M, He Z, Dreisigacker S, Wen W, Jin H, Zhai S, Li F, Gao F, Liu J, Wang R, Zhang P, Wan Y, Cao S, Xia X (2020) Development and validation of high-
throughput and low-cost STARP assays for genes underpinning economically important traits in wheat. Theor Appl Genet 133(8):2431–2450.
https://doi.org/10.1007/s00122-020-03609-w
38. Xynias IN, Mylonas I, Korpetis EG, Ninou E, Tsaballa A, Avdikos ID, Mavromatis AG (2020) Durum wheat breeding in the mediterranean region: current
status and future prospects. Agron J 10(3):432
39. Zang R, Zhao Y, Guo K, Hong K, Xi H, Wen C (2018) The population genetic variation analysis of bitter gourd wilt caused by Fusarium oxysporum f. sp.
momordicae in China by inter simple sequence repeats (ISSR) molecular marker. bioRxiv:424077. https://doi.org/10.1101/424077
Figures
Figure 1
Detection of the optimal number of K subpopulations of 90 durum wheat genotypes based on data obtained by 12 gene-specific primers related to grain
quality traits (Evanno et al. 2005).
Page 10/12Figure 2
Bayesian model-based population structure based on data obtained by 12 gene-specific markers related to grain quality traits in 90 durum wheat genotypes.
Figure 3
Allele distribution statistics across populations of 90 durum wheat genotypes NB No. of different bands, NB >= 5% No. of different bands with a frequency >=
5%, NPB No. of bands unique to a single population, NLCB = 5%) found in 25% or fewer populations, NLCB = 5%) found in 50% or fewer populations h Diversity (1 - (p^2 + q^2))
Page 11/12Figure 4
UPGMA phylogenetic dendrogram according to Jaccard’s distance coefficient based on data obtained by 12 gene-specific markers related to grain quality
traits on 90 durum wheat genotypes.
Figure 5
principal coordinate analysis based on data obtained by 12 gene-specific markers related to grain quality traits on 90 durum wheat genotypes.
Page 12/12You can also read