An assessment of genetic diversity among marula populations using the amplified fragment length polymorphism (AFLP) technique
←
→
Page content transcription
If your browser does not render page correctly, please read the page content below
In tern a tio n a l
              Sch o la rs
              Jo u rn a ls
 International Journal of Agricultural Sciences ISSN 2167-0447 Vol. 10 (3), pp. 001-008, March, 2020. Available online
 at www.internationalscholarsjournals.org © International Scholars Journals
                                      Author(s) retain the copyright of this article.

Full Length Research Paper

        An assessment of genetic diversity among marula
         populations using the amplified fragment length
                polymorphism (AFLP) technique
          Kgabo Moganedi1*, Mbudzeni Sibara2, Paul Grobler3,4 and Elisabeth Goyvaerts1,5
  1
      Department of Biochemistry, Microbiology and Biotechnology, School of Molecular and Life Sciences, University of
                                Limpopo, Private Bag X 1106 Sovenga, 0727 - South Africa.
                2
                 Office of Deputy Vice Chancellor, University of Limpopo, Private Bag X 1106 Sovenga, 0727, South
                     3
             Africa. Department of Biodiversity, School of Molecular and Life Sciences, University of Limpopo, Private
                                              Bag X 1106 Sovenga, 0727 - South Africa.
         4
          Department of Genetics, University of the Free State, P. O. Box 339, Bloemfontein, 9300 - South Africa.
                        5
                         Kitso Biotech Pty Ltd, 23 Fernvilla P1, Pietermaritzburg 3201, South Africa.
                                                  Accepted 26 October, 2019

Marula is a wild-growing dioecious leafy tree species indigenous to Africa. The species exhibits a high phenotypic
variability, especially in fruit size and quality and these traits are exploited by indigenous communities for commercial
gain. As a first step towards assessing the relationship between the phenotypic and genotypic properties of the
marula species, the genetic structure of natural marula populations was assessed using the Amplified Fragment
Length Polymorphism (AFLP ) technique. Seven primer combinations were used to assess the degree of genetic
diversity within and among natural marula sampled from the Bochum, Tzaneen and Nelspruit areas of South Africa. A
total 141 unambiguous bands were amplified, of which 83 (59%) displayed polymorphism in one or more populations.
Representative levels of genetic diversity were observed within all local populations. Coefficients of genetic
differentiation showed evidence of drift among populations from the Limpopo-and Mpumalanga Provinces. A
Bayesian assignment technique supported this trend, and suggested a true genetic structure of two populations,
containing the Limpopo and Mpumalanga trees respectively. This diversity provides a plausible foundation for the
marked phenotypic variation observed in marula, and suggest genetic diversity to provide for artificial selection
during future artificial propagation programmes is present.

Key words: Sclerocarya birrea, marula, genetic diversity, genetic structure, amplified fragment length
polymorphism.

INTRODUCTION

Marula species belongs to the genus Sclerocarya which            as mango (Mangifera indica), cashew (Anarcadium
falls under the mango family, Anacardiaceae. This family         occidentale) and pistachio (Pistacia vera). There are two
is widespread in the warmer regions of the world. It is a        members of the genus Sclerocarya, namely, Sclerocarya
large group with over 60 genera and more than 500                birrea (marula) and Sclerocarya gillettii that are native to
species (Palmer and Pitman, 1972). Over 50 species of            Africa and Madagascar. These species differ mainly in
this family grow in Southern and Southwest Africa as             the number of leaflets, the length of the stalks and the
trees, a few of which produce edible fruits and nuts such        sizes of the fruits. The species S. birrea has three
                                                                 subspecies: caffra, birrea and multifoliata, with S. birrea
                                                                 subsp. caffra being the most widespread and researched
                                                                 in Southern and Southwest Africa (Palmers and Pitman,
*Corresponding author. E-mail: kgabom@ul.ac.za.        Tel:      1972; Agufa et al., 2000; Emanuel et al., 2005).
+27152682996. Fax: +27152683012.                                    Indigenous communities in South Africa, Botswana,
Kenya, Tanzania, Swaziland, Mozambique, Namibia, three sampling areas Bochum (Bo) and Tzaneen (Tz) areas in the
Zimbabwe, Zambia and Malawi (Palgrave, 1984; Agufa et Limpopo Province, and from fields around Nelspruit (Ne) in the
al., 2000; Eloff, 2000; Wynberg et al., 2002) utilize marula Mpumalanga Province (Figure 1). Equal numbers of both sexes
were collected. Samples were labelled Bo 1-20, Tz 1-20 and Ne 1-
products for various purposes. The fruit is rich in minerals 20 indicating the source of the respective samples, with odd
and carbohydrates and is either eaten fresh, processed numbers representing male samples and even numbers female
or brewed. An interest in fruit and seed contents has also samples.
emerged (Mdluli, 2005; Hillman et al., 2008; Kleiman et
al., 2008; Viljoen et al., 2008). The seeds are rich in oil
Genetic analysis
(50 - 60%) and protein (28%) and are eaten either raw or
roasted as nuts (ANU forestry, 2001) . The bark and roots Leaf samples were ground to a fine powder under liquid nitrogen.
of the marula tree are also used in treating a variety of The DNA was isolated following the method of Kleinhofs et al.
ailments such as ulcers, fever, sore eyes, (1993). The DNA from each genotype was double digested with
schistosomiasis and stomach ailments (Palgrave, 1984; Tru9I (M- Roche-Biochemicals) and EcoRI (E- Roche-
Eloff, 2000; ANU forestry, 2001). Marula has been Biochemicals) at appropriate conditions prescribed by the
manufacturers and MseI (M) and EcoRI (E) adaptors were ligated to
declared a national tree in the Republic of South Africa the fragments. Tru9I and MseI are isochizomers. The generic MseI
because of its potential to be developed into a viable and EcoRI adaptors and primers were prescribed in Vos et al.
commercial crop (Marula natural products, 2003) and has (1995). Preselective amplification was performed in a 20 l reaction
attracted attention for commercial application. mixture containing 1x ExTaq buffer, 0.75U ExTaq polymerase
Marula is functionally dioecious and out crossing. The (Takara biochemicals), 0.5 M of each primer (M-A/E-G and M-A/E-
species exhibits a high degree of intraspecies phenotypic T), 0.25 mM dNTP mix and 5 l restriction digested template. The
differences for traits such as tree size, number of leaves cycling conditions consisted of 30 cycles, each with 94°C for 1 min,
56°C for 90 and 90 s at 72°C, followed by 7 min at 72°C.
in an inflorescence, fruit yield, fruit size, fruit juice and Polymerase Chain Reaction (PCR) reaction mixtures for selective
sugar content (Holtzhausen, 2001; Leakey et al., 2002; amplification were the same as for preselective amplification except
Muok et al., 2007). There is no published study that has that primers with more selective nucleotides were used, that is, M-
investigated and attributed the relative contributions of ACA/E-GTT, M-AGT/E-GCA, M-AGC/E-GAC, M-ACA/E-GAC, M-
genetic and environmental factors to these phenotypic ACA/E- TAT, M- AGA/E-TGC and M-AGT/E-TCC. A touchdown
cycling program was performed for selective amplification of the
variations. It is noteworthy that the phenotypic
template using the following cycling conditions: 13 cycles of 94C
characteristics of a tree are often stable throughout its for 1 minute; 1 minute at 65 56C (t = 0.7C per cycle) and 1
lifespan when growing in an environment of constant minute at 72°C and a further 17 cycles at 94°C for 1 min; 1 min at
climatic conditions. Based on interviews during sample 56°C and 1 min at 72°C, with an extended 7 min at 72°C. The
collection, it appears that local communities use these amplification products were analysed on a 5% denaturing
characteristics to tag the trees of high fruit quality. polyacrylamide gel [PAA gel solution: 5% acrylamide/bisacrylamide
However, phenotypic properties may not offer a good (19:1), 7.5 M urea, 89 mM Tris (pH 8.3), 89 mM borate and 2 mM
EDTA]. The fingerprints were visualised with silver staining
measure of the actual genetic diversity that exists in a following the procedure in the Promega© protocols and applications
population because of the effect of environmental factors, guide (1996). AFLP fingerprints were manually scored for the
especially when trees are grown at different locations of presence (1) and the absence (0) of bands.
different climatic or physical conditions because
morphological characteristics could be the result of
environmental influences and their interactions with Statistical analysis
genetic properties. This implies that some genes of an Distinct monomorphic and polymorphic bands were analysed using
organism may never be expressed unless these genes POPGENE (Yeh et al., 1997), ARLEQUIN ver 3.0 (Excoffier et al.,
are presented with the right environment. 2005) and NTSYS-pc (version 2.02i; Rohlf, 1997) softwares.
In this paper, we report on the use of the Amplified POPGENE was used to determine observed number of alleles (Ao);
Fragment Length Polymorphism (AFLP) technique to expected heterozygosity (He) within populations and genetic
distance (D; Nei, 1972) among populations. ARLEQUIN software
assess genetic differentiation among conspecific was used to determine the spatial distribution of genetic diversity in
populations and the genetic diversity within marula marula, by implementing an Analysis of Molecular Variance
populations. In particular, the aims of this study were to (AMOVA) and to calculate conventional Fst values. Associate gene
assess the extent of genetic divergence between three flow (Nm) values were calculated using Nm= [0.25*(1-Fst))/Fst].
marula populations in the Limpopo and Mpumalanga The NTSYS-pc program was used to calculate genetic similarity as
a measure of genetic differentiation using the dice coefficient; and a
Provinces of South Africa and to determine the level of
Principal Co-ordinates Analysis (PCO) based on the genetic
genetic diversity within marula populations. similarity matrix was then determined.
To supplement the frequency-based analyses, an assignment test
based on a Bayesian approach was used to identify the true
MATERIALS AND METHODS number of populations (clusters) and assign individual marula trees
probabilistically to each cluster. Structure software Pritchard et al.
Study sites and sample collection (2000) and Falush et al. {2003} was used for this analysis. A model
with assumption of admixture ancestry and correlated allele
Leaf samples from 20 marula trees were collected from each of the frequencies was selected. The parameter ln Pr (X|K) was calculatedFigure 1. A geographical map of Limpopo and Mpumalanga provinces showing the three areas ( )
where natural marula trees were sampled.
Table 1. Genetic distance (D; below the diagonal); genetic variability measures (diagonal; with standard deviation in brackets)
and Fst and gene flow estimates (above the diagonal) among marula populations.
Bochum Nelspruit Tzaneen
Ao=1.411(0.494) Fst=0.219 (p=0.001) Fst=0.134 (p=0.001)
Bochum
He=0.168 (0.201) Nm=0.892 Nm=1.616
Ao=1.461(0.500) Fst=0.191 (p=0.001)
Nelspruit 0.058
He=0.184 (0.212) Nm=1.059
Ao=1.404 (0.493)
Tzaneen 0.053 0.055
He=0.171 (0.217)
for K values (number of populations) of 1-3, with 10 independent Coefficients of genetic differentiation suggested
runs for each K, to estimate the true number of populations. All runs significant geographic genetic structuring within marula.
consisted of a burn-in period of 100,000 steps, followed by 200,000
Values from AMOVA showed that 19.831% of total
iterations.
variation is found among the three regional populations,
with 80.169% within populations. Pair-wise Fst values
RESULTS showed significant differentiation (P < 0.001) between all
populations pairs. The Fst values between the
A total of 141 bands were amplified using the seven populations from Bochum and Tzaneen (Fst=0.134) were
combinations of selective primers. Of these bands, 83 however, slightly lower compared to values between
(59%) were polymorphic in one or more populations. these two populations and the third, from the Nelspruit
Intraspecific genetic variability was very similar in all the area (Fst=0.191-0.219). Gene flow values supported this
three populations (Table 1), with the expected trend (Table 1), with Nm values indicative of less
heterozygosity values within populations ranging from exchange of genetic material between Nelspruit
0.168 to 0.184. population and either of the populations from Bochum orTable 2. Proportion of membership of each pre- representative level of diversity in wild populations of tree
defined marula population in each of two clusters, from species.
a fully Bayesian assignment test following Pritchard et A gradual increase in intraspecific genetic diversity from
al. (2000).
Northwest (Bochum) to southeast (Nelspruit) for He and
Ao values was apparent. This trend is probably an
Cluster 1 Cluster 2
indication of isolation by distance and is explained by the
Bochum 0.732 0.268 geographic closeness between the Bochum and Tzaneen
Nelspruit 0.069 0.931 populations, with the Nelspruit population more distant.
Tzaneen 0.758 0.242 The results from AMOVA provide further support for a
hypothesis of geographic structure in Marula. AMOVA
indicated that 19.831% of total genetic diversity was
Tzaneen. Genetic distance between population pairs found between regional populations. This among-region
were closely comparable, but provided some support for value is substantially higher than the 9.10% calculated
the observation of closer identity between the populations among regional populations of G. jasminoides by Han et
from the Limpopo Province (D=0.53) compared to al. (2006), and slightly exceeds the value of 17.02%
distances between these populations and the Nelspruit calculated between different species of the genus Prunus
population (D=0.55-0.58; Table 1). by Aradhya et al. (2004), suggesting significant
The pattern from Fst and D values is also evident from differentiation. Further, comparisons between population
the PCO plot, which is based on the relative similarities pairs using Fst (Table 2) confirm the hypothesis of
between individuals and shows a cluster – though significant differentiation among populations, with signifi-
separate from the Nelspruit individuals when compared to cant (P=0.001) divergence between all population pairs
the interspersed individuals from Bochum and Tzaneen (Table 2).
areas. It is noteworthy that none of the three clusters on Han et al. (2006) noted that Nm0.20 B13
B18
B6
B14
N6
0.10 B12 B7 N12
B11 B10
B4 B8
B2 T17 B17
B9 B16 T11
N3
PC 2 B15 B19 N14
N15
T16 B1 N5
B5B3 N11
0.01 N7 N19
T5
N1 N16 N13
T8 N10N4
T20 N2 T1 N17
T18 N8
B20 N9
T15 T10
T19 T3
-0.09 N20
T13
T14 T12 T7 N18
T9 T6
T2
T4
-0.19
-0.16 -0.07 0.03 0.13 0.22
PC 1
Figure 2. PCO plot showing the dispersal of the natural genotypes in three South African populations,
in relation to each other.
Figure 3. Probability of K=1-3 in three marula populations. Light grey bars show the average –Ln
probability for 10 simulations of each value of K; darker areas above bars indicate the standard
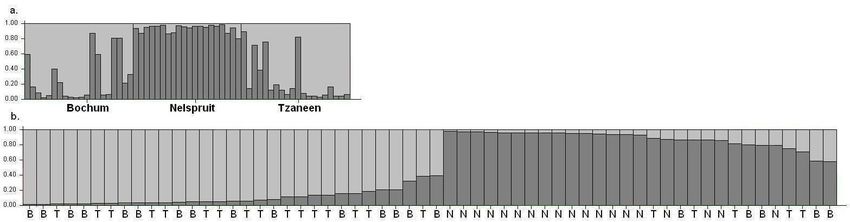
deviation for 10 simulations.Figure 4. Bar plots (from structure). Each tree is represented by a single vertical line broken into two differently shaded segments, with lengths proportional to
membership of each of the two inferred clusters. (a) Three geographic populations in original order. (b) Membership of individuals to two true clusters of marula.
Abbreviations used: B=Bochum; N=Nelspruit; T=Tzaneen.
Naturally occurring marula trees are widely exploited to produce superior individuals. Pheno- structuring observed in marula, the genetic data
dispersed throughout the Limpopo and typic variations in fruit size, fruit yield per tree, obtained in the current study do not suggest
Mpumalanga Provinces, with a high density in flesh, juice and sugar contents between trees reduced exchangeability or reproductive isolation
non-residential areas. The present study shows within regions have been reported by Holtzhausen between regional populations, and therefore
that this exchange of genetic material induces (2001) and Leakey et al. (2002). support the presence of only one subspecies in
gene flow within local localities, as demonstrated Such differences can be exploited during future the two provinces studied (Limpopo and
by representative within -population levels of artificial breeding programs to suit the needs of Mpumalanga). Muok et al. (2007) studied genetic
genetic diversity. Over greater geographic specific enterprises. Similarly, phenotypic and morphological relationship between marula
distances, some genetic structure in marula is differences among natural marula were observed populations in Kenya and Tanzania and resulted
apparent as shown by various comparisons of among populations from the Bochum, Tzaneen in restructuring of the marula populations in Kenya
marula trees from the Nelspruit area compared to and Nelspruit areas. The differences in juice from two to three subspecies.
the remaining populations. This may be pure drift content observed among marula trees in the three The observation from this study suggested less
caused by isolation through distance or it may regions could be the result of differential amount exchange of genetic material between Nelspruit
represent true adaptive differentiation due to a of free water that is available from rainfall. and the other two populations Bochum and
gradient of environmental factors or a combination Bochum is relatively dry when compared to Tzaneen. However, a high intraspecific variation
of both. Tzaneen and Nelspruit which both receive a within Nelspruit population was revealed. Noting
The observed phenotypic differences that have higher amount of rainfall during spring (South the geographical location in relation to neigh-
been reported in marula from different regions African weather service, 2004). Nevertheless, bouring areas and countries, some level of gene
suggest that some adaptive differences, stemming genetic differentiation and adapta-tion to specific flow may be probable between the Nelspruit
from genetic differentiation, do occur. Thiong’o et environmental conditions could equally explain the marula population and Swaziland and/or
al. (2000) also observed a wide phenotypic phenotypic differences. Mozambique populations based on (1) the genetic
variability within marula in the wild which can be Notwithstanding the slight geographic genetic separation of Nelspruit population from theTzaneen and Bochum populations, (2) Swaziland and sustainable harvest of Sclerocarya birrea subsp. caffra fruits in the
South African lowveld. Forest Ecol. Manage., 214: 91- 103
Mozambique are both hosts to the same marula species
Excoffier L, Laval G, Schneider S (2005). Arlequin, version 3.0: An
(Palgrave, 1984; Agufa et al., 2000) and (3) gene flow is Integrated Software Package for Population Genetics Data Analysis.
enhanced in insect- based pollinated species because of Computational and Molecular Population Genetics Laboratory
good transfer of pollen over large distance (Fatemi and (CMPG), Institute of Zoology, University of Berne, Switzerland.
Falush D, Stephens M, Pritchard JK (2003). Inference of population
Gross, 2009). In conclusion, the current study provides structure: extensions to linked loci and correlated allele frequencies.
the first data on AFLP-based genetic variation within and Genetics, 164: 1567–1587.
among South African marula populations. Most studies Fatemi M, Gross CL (2009). Life on the Edge-High levels of genetic
on marula have focused on the fruit content and its diversity in a cliff population of Bertya ingramii attributed to B.
rosmarinifolia (Euphorbiaceae). Biol. Conserv., 142: 1461-1468
utilization in producing commercial products, not on its Han J, Zhang W, Cao H, Chen S, Wang Y (2006). Genetic diversity and
natural genetic diversity. An understanding of the genetic biogeography of the traditional Chinese medicine, Gardenia
structure is important for the protection of the biodiversity jasmoides, based on AFLP markers. Biochem. Syst. Ecol., 35: 138-
of this species especially noting that marula has been 145.
Hillman Z, Mizrahi Y, Beit-Yannai E (2008). Evaluation of valuable
declared a national tree in the Republic of South Africa nutrients in selected genotypes of marula (Sclerocarya birrea ssp.
because of its economic value. Some genetic structure caffra). Sci. Hortic., 117: 321-328
exists based on the observations in this study; however, Holtzhausen C (2001) Ennobling the African Marula. Report and
intraspecific diversity outranks any differentiation abstracts, Marula workshop, 14-16 February 2001, Magaliespark
Timeshare, Hartebeespoortdam
resultant from genetic drift. There is an underlying
Kleiman R, Ashley DA, Brown JH (2008). Short communication:
supposition that genetic, environmental and epigenetic Comparison of two seed oils used in cosmetics, moringa and marula.
factors interact in determining the marula phenotype Ind. Crops Prod., 28: 361-364
based on the diverse phenotypic characteristics Kleinhofs A, Kilian A, Saghai Maroof MA, Biyashev RM, Hayes P, Chen
FQ, Lapitan N, Fenwick A, Blake TK, Kanazin V, Ananiev E, Dahleen
alongside the narrow genetic variation. The study of the L, Dukrna D, Bollinger J, Knapp SJ, Lui B, Sorrells M, Heun M,
relationship between the environment, genetic properties Franckowiak JD, Hoffman D, Skadsen R, Steffenson BJ (1993). A
and specific phenotypic characteristics will provide addi- molecular, isozyme and morphological map of the barley (Hordeum
tional data on the foundation of phenotypic variation, so vulgare) genome. Theor. Appl. Genet., 86: 705-712
Leakey R, Shackleton S, du Plessis P, Pate K, Lombard C (2002).
that important attributes could be preserved and utilized Characterization of phenotypic variation in marula (Sclerocarya
for commercial selection in marula. birrea) fruits, nuts and kernels in South Africa and Namibia. .
Agroforestry and Novel Crops Unit, James Cook University, Australia
Marula natural products (2003) Marula news.
http://www.marula.org.za/news3.htm Accessed 23 July 2003
ACKNOWLEDGEMENTS
Mdluli KM (2005). Partial purification and characterisation of polyphenol
oxidase and peroxidase from marula fruit (Sclerocarya birrea subsp.
The authors would like to thank the Flanders caffra). Food Chem., 92 (2): 311- 323
Interuniversity Institute for Biotechnology (VIB) at the Muok B, Matsumura A, Ishii T, Odee DW (2007). Genetic diversity
within Sclerocarya birrea populations in Kenya. J. Arid Environ., 71:
University of Gent, Belgium for providing skills, funds and 1-11
space to carry out the laboratory work. Our gratitude goes Nei M (1972). Genetic distance between populations. Am. Nat., 106:
to National research Foundation for financial assistance; 283-292.
and we further thank Ms.’s N. Colpaert and M Legodi; Palgrave KC (1984). Trees of Southern Africa, 4th edn. C. Struik
publishers, Cape Town.
Messrs. H. Labbeau, D. B. Moganedi and S. Mtileni for Palmer E, Pitman N (1972). Trees of Southern Africa. A. A. Balkema,
their inputs and technical assistance during the execution Cape Town.
of this study. Portis E, Acquadro A, Comino C, Mauromicale G, Saba E, Lanteri S
(2005). Genetic structure of island populations of wild cardoon
[Cynara cardunculus L. var. sylvestris (Lamk) Fiori] detected by
AFLPs and SSRs. Plant Sci., 169: 199-210.
REFERENCES
Pritchard JK, Stephens M, Rosenberg NA, Donnelly P (2000).
Association mapping in structured populations. Am. J. Hum. Genet.
Agufa CAC, Simons AJ, Maghembe J, Dawson IK (2000). Molecular
67: 170–181.
genetic variation within and between populations of Sclerocarya
Promega (1996). Protocols and Applications guide: the source for
birrea measured by RAPD and chloroplast RFLP-PCR analysis:
discovery, 3rd edn, USA.
Implications for genetic management of the species.
Rohlf FJ (1997). NTSYSpc version 2.02i. Numerical taxonomy and
Http://www.bangor.ac.uk/afforum/research/monographs/output.htm.
Multivariate Analysis System. Exeter Software, Setauket, New York
Accessed 1 March 2004.
South African weather services (2004). Climate data.
ANU forestry (2001). Marula fruit.
http://www.weathersa.co.za/climate/rainfall Accessed 5 March 20044414. Yeh FC, Yang R, Boyle T (1997). POPGENE version 1.32. Microsoft Wright S (1940). Breeding structure of populations in relation to windows-based freeware for population genetic analysis. speciation. Am. Nat., 74: 232-248. Wright S (1943). Isolation by distance. Genetics, 28: 114-138. Wynberg R, Cribbins J, Leakey R, Lombard C, Mander M, Shackleton S, Sullivan C (2002). Knowledge of Sclerocarya birrea subsp. caffra with emphasis on its importance as a non-timber forest product in South and southern Africa: A Summary. South. Afr. Forest. J., 196: 67-78.
You can also read