Assessment of genetic diversity in Moroccan sesame (Sesamum indicum) using ISSR molecular markers
←
→
Page content transcription
If your browser does not render page correctly, please read the page content below
OCL 2021, 28, 3
© M. El Harfi et al., Hosted by EDP Sciences, 2021
https://doi.org/10.1051/ocl/2020072                                                                                                      OCL
                                                                                                                                          Oilseeds & fats Crops and Lipids

                                                                                                                                    Available online at:
                                                                                                                                    www.ocl-journal.org

    RESEARCH ARTICLE

Assessment of genetic diversity in Moroccan sesame
(Sesamum indicum) using ISSR molecular markers
Meriem El Harfi1,2, Jamal Charafi1, Karim Houmanat1, Hafida Hanine2 and Abdelghani Nabloussi1,*
1
    National Institute of Agronomic Research, Regional Agronomic Research Center, Meknès, Morocco
2
    Department of Biology, Faculty of Science and Technics, Sultan Moulay Slimane University, Béni Mellal, Morocco

             Received 17 June 2020 – Accepted 7 December 2020

             Abstract – There is a need for sesame (Sesamum indicum L.) breeding in Morocco to release performant
             and adapted varieties, which requires a large genetic variability in the germplasm to be used. In this context,
             genetic diversity of sesame populations from different locations in Tadla area was investigated using ISSR
             (Inter Sequence Simple Repeats) markers as a simple method to reveal polymorphism among them. A total
             of 130 individuals representing 31 populations were sampled. Twenty-four ISSR primers were used for
             analysis of individuals representing the 31 different sesame populations grown in different agroclimatic
             zones of Tadla, accounting for 90% of sesame cultivation area in Morocco. Indeed, seven primers showed
             legible and reproducible genomic profiles with an interesting number of bands. A total of 57 bands were
             obtained with ISSR primers, of which 47 were polymorphic. PIC (Polymorphic Information Content)
             ranged from 0.002 to 0.350, showing that ISSR markers are informative and relevant for discriminating the
             populations evaluated. The similarity coefficient of ISSR data ranged from 0.509 to 1, with an average of
             0.870. The results obtained showed that Moroccan sesame populations are characterized by a low genetic
             diversity, suggesting a genetic proximity among them. Therefore, new germplasm should be either
             introduced from diverse geographical origins or created through mutagenesis breeding in order to broaden
             the existing genetic variability.

             Keywords: genetic diversity / ISSRs markers / Morocco / polymorphism / Sesamum indicum L.

             Résumé – Évaluation de la diversité génétique du sésame marocain (Sesamum indicum) à travers
             l’utilisation de marqueurs moléculaires ISSR. Au Maroc, il y a un besoin en amélioration génétique du
             sésame (Sesamum indicum L.) pour développer des variétés performantes et adaptées, ce qui nécessite une
             grande variabilité génétique dans le germoplasme de cette culture. Dans ce contexte, la diversité génétique
             des populations de sésame de différentes localités de la zone du Tadla a été étudiée en utilisant les marqueurs
             ISSR (Inter Sequence Simple Repeats) comme méthode simple pour révéler le polymorphisme entre elles.
             Un total de 130 individus représentant 31 populations a été échantillonné. Vingt-quatre amorces ISSR ont
             été utilisées pour l’analyse d’individus représentant les 31 différentes populations de sésame cultivées dans
             différentes zones agroclimatiques du Tadla qui totalise 90 % de la superficie globale du sésame au Maroc.
             Sept amorces ont montré des profils génomiques lisibles et reproductibles avec un nombre intéressant de
             bandes. En effet, 57 bandes ont été obtenues avec les amorces ISSR, dont 47 étaient polymorphes. L’indice
             de polymorphisme (PIC) varie de 0,002 à 0,350, montrant que les marqueurs ISSR sont informatifs et
             pertinents pour discriminer les populations évaluées. Le coefficient de similarité des données ISSR varie de
             0,509 à 1, avec une moyenne de 0,870. Les résultats obtenus ont montré que les populations marocaines de
             sésame sont caractérisées par une faible diversité génétique, suggérant une proximité génétique entre elles.
             Par conséquent, un nouveau matériel génétique devrait être soit introduit de différentes origines
             géographiques, soit développé par mutagenèse, afin d’élargir la variabilité génétique existante.

             Mots clés : diversité génétique / marqueurs ISSR / Maroc / polymorphisme / Sesamum indicum L.

*Correspondence: abdelghani.nabloussi@gmail.com

This is an Open Access article distributed under the terms of the Creative Commons Attribution License (https://creativecommons.org/licenses/by/4.0), which permits
                           unrestricted use, distribution, and reproduction in any medium, provided the original work is properly cited.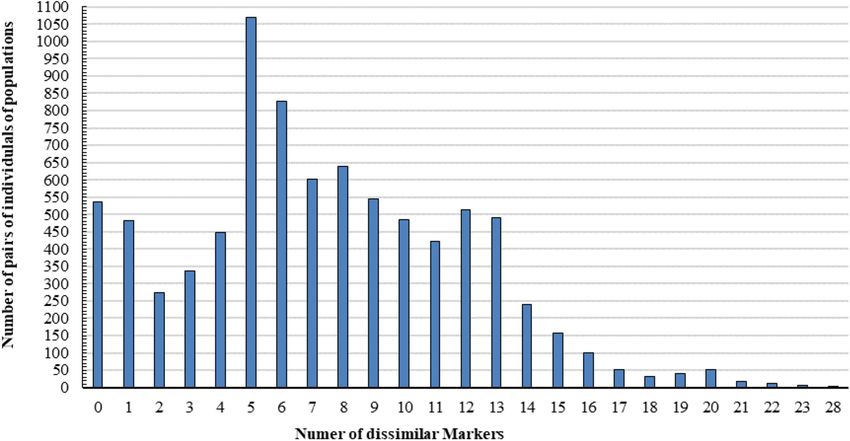
M. El Harfi et al.: OCL 2021, 28, 3

1 Introduction                                                        diversity among them and to confirm or refute the findings
                                                                      of agromorphological study (El Harfi et al., 2018). Particularly,
     Sesame (Sesamum indicum L., 2n = 26) is the most ancient         DNA markers are useful and reliable as they remain stable
annual oilseed crop grown in both tropical and temperate zones        under different environmental conditions (Ferdinandez et al.,
(Bedigian and Harlan, 1986). It is ranked ninth among the top         2001; Dar et al., 2019b). Genetic diversity in sesame over the
13 oilseed crops that ensure 90% of the global edible oil             world has been assessed using different molecular techniques
production (Adeola et al., 2010). It is predominantly a self-         namely, RAPD (Random Amplified Polymorphic DNA)
pollinated diploid plant (2n = 26), with seeds that are rich in oil   (Salazar et al., 2006; Dar et al., 2017), AFLP (Amplified
(50–60%) and antioxidants (Uzun et al., 2007). It is a source of      Fragment Length Polymorphism) (Laurentin and Karlovsky,
protein, high-quality edible oil with elevated level of               2006), ISSR (Inter Simple Sequence Repeats) (Kim et al.,
polyunsaturated fatty acids and various minor nutrients, such         2002; Kumar and Sharma, 2011; Nyongesa et al., 2013; Abate
as vitamins, minerals and important characteristic antioxidant        et al., 2015; Woldesenbet et al., 2015), SSR (Simple Sequence
lignans (sesamin, sesamolin, sesamol) (Dar and Arumugam,              Repeat) (Uncu et al., 2015; Sehr et al., 2016; Dossa et al.,
2013; Pathak et al., 2017). Sesame seeds and their oil, having        2017), and SRAP (Sequence Related Amplified Polymor-
long been used for human consumption and different industrial         phism) (Zhang et al., 2010). ISSR are DNA based markers
purposes, have recently attracted much attention due to the           having primers with simple repetitive sequences of two, four or
high oil quality, with high content of oleic and linoleic acids       five nucleotides, and known to be simple, fairly stable and
(Dar et al., 2019a). The plant is cultivated in many countries of     highly reproducible (Houmanat et al., 2016). Also, they are a
the Asian, African and American continents and has been               reliable tool that gives good information on the level of
growing over 5000 years. However, sesame is still a poorly            diversity (Chen et al., 2014). Therefore, the objective of this
investigated crop. In 2017, about 10 million hectares were            work was to analyze the genetic diversity among the sesame
harvested worldwide, producing more than 5.5 million tons of          local Moroccan populations, from Tadla area, using ISSR
seed, with an average yield of 0.55 t/ha (FAOSTAT, 2018). A           markers. This will allow us to confirm or deny the results of the
total of 70% of the world production comes from Asia and 26%          phenotypic characterization reported by El Harfi et al. (2018)
from Africa. Actually, the largest producers of sesame in the         and, then, to make appropriate decision with regard to sesame
world are India, Myanmar, China, Sudan, Uganda, Ethiopia              breeding program to be undertaken.
and Nigeria (FAOSTAT, 2018).
     Sesame genome size, which is about 350 Mb, is not largely        2 Material and methods
explored. A number of 27,148 genes have been annotated in a
sesame reference genome that shows a low proportion of                2.1 Plant material
repetitive sequences (28.5%) (Wang et al., 2014). Besides, the            The plant material investigated was composed of 31 sesa-
available genetic diversity in sesame germplasm is relatively         me local populations that were collected from different
limited as during sesame evolution many valuable genes                locations of Tadla area in Morocco, and then assessed for some
associated with high yield might have been lost. Also, limited        morphological and agronomic traits (El Harfi et al., 2018). The
use of landraces in contemporary sesame breeding programs             Tadla area that lies at an altitude between 450 and 470 m is
has probably narrowed the genetic basis of cultivated sesame          characterized by an arid to semi-arid climate with a wet season
(Spawan et al., 2019).                                                from November to March and a dry one from April to October.
     In Morocco, despite sesame has been grown during                 The annual rainfall is around 370 mm, while the average
hundred years, yield and production are still too low. National       temperature is about 19 °C, with a maximum above 40 °C and a
production is around 1000 tons on an area harvested of about          minimum below 1 °C. The codes of the populations collected
840 ha, for an average seed yield of 1.12 t/ha (FAOSTAT,              along with the geographical coordinates of collecting locations
2018). Tadla zone, belonging to Béni Mellal-Khénifra region,          are shown in the Table 1. Five individuals per population were
is the most important area of sesame production, with almost          analyzed. However, due to technical problem, 25 individuals
90% of the global cultivated area in the country. Moroccan            did not show a good molecular profile and thus were
sesame remains undeveloped because of several constraints,            eliminated. At the end, a total of 130 individuals, representing
including the uncharacterized plant material cultivated and the       the 31 populations, were considered for this study.
non-use of improved varieties. This situation can be changed
by developing and releasing productive varieties of good              2.2 DNA isolation
quality and high adaptive potential to environmental con-
ditions of this crop cultivation. Prior to that, genetic                  Genomic DNA was isolated from young leaves of each
information on local landraces is needed and the existing             plant following the Cetyl Trimethyl Ammonium Bromide
genetic diversity should be explored. In this context, a number       (CTAB) modified method of Saghai-Maroof et al. (1984). The
of local sesame populations or cultivars were collected and           quality of the extracted DNA was first verified on agarose gel
characterized, for the first time, using some morphological and        (0.8%). The amount and purity of DNA extracted were
agronomic traits (El Harfi et al., 2018). The genetic variability      evaluated by measuring the OD (Optical Density) at 260 nm
revealed was too narrow for most of the studied traits,               and at 280 nm to detect contamination. Indeed, the more the
suggesting these cultivars are genetically very close. Addi-          ratio OD260/OD280 tends to 2, the more the DNA extract is
tional molecular analysis of those plant materials was                better or pure, and its use in several amplification techniques is
recommended to better investigate the existing genetic                doomed to success.

                                                               Page 2 of 8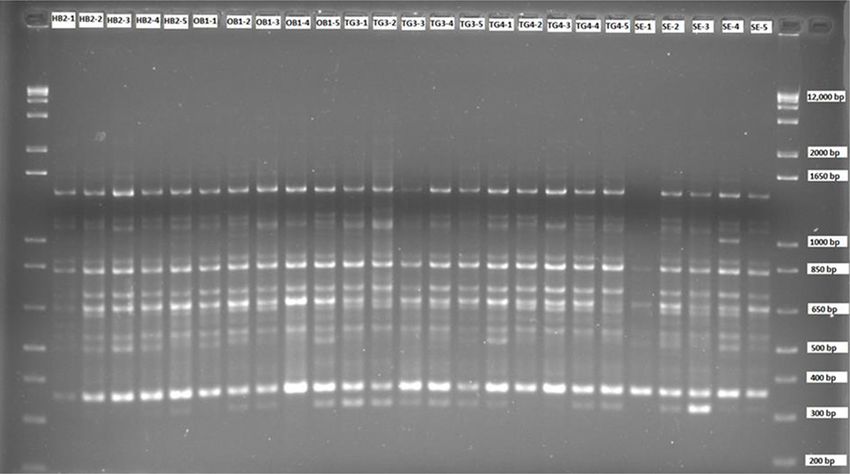
M. El Harfi et al.: OCL 2021, 28, 3

Table 1. Identification of the 31 Moroccan sesame populations used      final elongation step at 72 °C for 6 min. The ISSR amplification
in the present study according to the codes of a previous              products were separated by electrophoresis on 2% agarose gel
agromorphological study (El Harfi et al., 2018).                        in TBE buffer for 2.5 hours at 150 volts. After staining with
                                                                       ethidium bromide (0.1%), the gel is visualized under UV and
Populations number         Code         Geographical coordinates       photographed and stored on computer for subsequent
                                                                       treatment by Mesurim software. A 1 kb DNA ladder
1                          BA           33.21° N,   6.72° W            (Invitrogen) was used for molecular weight estimation of
2                          TG2          32.44° N,   6.20° W            PCR products.
3                          KR1          32.24° N,   6.22° W
4                          KR2          32.24° N,   6.22° W
5                          OZ2          32.30° N,   6.26° W            2.4 Scoring and data analysis
6                          OY1          32.43° N,   6.33° W
8                          TG1          32.44° N,   6.20° W
                                                                           A data matrix was created by scoring ISSR bands from gels
9                          OY2          32.43° N,   6.33° W
                                                                       as 1 and 0 for their presence and absence, respectively. Only
10                         HB1          32.24° N,   6.95° W
                                                                       clear, unambiguous bands between 300 and 1800 bp were
11                         HB2          32.24° N,   6.95° W
                                                                       recorded.
12                         OB1          32.13° N,   6.53° W
                                                                           The genetic distances and similarities were calculated
13                         TG3          32.44° N,   6.20° W
                                                                       using simple matching coefficient (SMC) by Clustering
14                         TG4          32.44° N,   6.20° W
                                                                       Calculator software program established by Brzustowski
15                         SE           32.45° N,   6.53° W
                                                                       (2002). Thus, based on the pairwise comparisons of genotypes,
16                         TG8          32.44° N,   6.20° W
                                                                       a histogram according to the number of markers which
17                         LZ1          32.26° N,   6.23° W
                                                                       distinguish them has been established. Characterization of
18                         OB2          32.13° N,   6.53° W
                                                                       primers for their ability to differentiate the studied genotypes
19                         KF           32.31° N,   6.36° W
                                                                       was assessed by calculating polymorphic information content
20                         LZ2          32.26° N,   6.23° W
                                                                       (PIC). PIC was calculated according to the formula of
21                         OZ1          32.30° N,   6.26° W
                                                                       Anderson et al. (1993), as:
                                                                                                              !
22                         TG6          32.44° N,   6.20° W                                          X
25                         TG7          32.44° N,   6.20° W                         PIC i ¼ n 1         Pij  ðn  1Þ;
                                                                                                            2
27                         SS1          32.30° N,   6.70° W                                           j
28                         LZ3          32.26° N,   6.23° W
29                         HB3          32.24° N,   6.95° W            where j is the primer concerned, n is the size of i bands and Pij
30                         OM           32.28° N,   6.46° W            is the frequency of marker I revealed by the primer j through
31                         LZ4          32.26° N,   6.23° W            the band sum.
32                         HB4          32.24° N,   6.95° W                 Cluster analysis was performed to construct dendrograms,
33                         KR3          32.24° N,   6.22° W            with the unweighted pair-group method by arithmetic averages
34                         KR4          32.24° N,   6.22° W            (UPGMA) from the similarity data matrices using simple
35                         SS2          32.30° N,   6.70° W            matching coefficient. The numerical taxonomy and multivari-
                                                                       ate analysis system program package for personal computer
                                                                       (NTSYSPC V.2.02.; Rohlf, 1998) was used for statistical
2.3 Amplification of the sesame DNA by ISSR                             analysis of data.
markers

    ISSR analysis based on PCR was carried out using 24 ISSR
                                                                       3 Results and discussion
primers selected from several studies (Medraoui et al., 2007;          3.1 ISSR genotyping
Houmanat et al., 2016). Gradient PCR was used to adjust the
annealing temperature of each primer. Primer sequences and                 Among the 24 ISSR primers tested, seven primers (29%)
melting temperatures are shown in Table 2. DNA was                     have been chosen according to their clear and reproducible
amplified by PCR in a total volume of 25 mL. The composition            profiles (Tab. 3). The other 17 primers (71%) have generated
of the reaction mixture is 15 ng/mL of DNA, 5 mL of PCR                ambiguous and non-readable amplification profiles. Figure 1
tampon (10), 50 mM of MgCl2, 2.5 mM of dNTP,                          shows an example of a molecular profile revealed by the F9
10 pmol/mL of each ISSR primer and 2 units DNA polymerase              primer. The seven ISSR primers amplified 57 bands of which
(Invitrogen). The ideal hybridization temperatures of each             46 were polymorphic (80.7%), suggesting that these primers
primer were chosen from the results of the PCR gradient test           are effective for exploring molecular polymorphism in
(temperatures of 44 to 60.5 °C). The amplification was                  Moroccan sesame and reflecting the existence of genetic
executed in the Eppendorf Master Cycler gradient. The                  variability. The highest number of total amplified bands was 14
PCR reactions were conducted faithfully according to the               with the primer F11, while the lowest number of total amplified
program of the following thermal cycle: initial denaturation at        bands was 1 with the primer IMA8Z, with an average of
94 °C for 4 min followed by 40 cycles with a denaturation of           6.57 bands per primer (Tab. 3). The observed band sizes of all
the DNA at 94 °C for 1 min, hybridization of the primer at the         amplification fragments ranged from 329 to 1795 bp (Tab. 3).
corresponding hybridization temperature for 1 min, extension               The highest polymorphism rate was observed with F7, F9,
of the primer at 72 °C for 1 min. Amplification is sealed off by        F11 and UBC807 primers, all showing 100% of the

                                                               Page 3 of 8
M. El Harfi et al.: OCL 2021, 28, 3
Table 2. List of 24 ISSR primers used in the genetic characterization of 31 sesame populations.
Primers Sequences (5’–3’) Annealing temperature (°C) Primers Sequences (5’–3’) Annealing temperature (°C)
F1 [CA] 6AT 46.76 F13 [GA] 8CG 59.9
F2 [CA] 6GC 52.61 F14 [GT] 8CT 57.62
F3 [CA] 6AG 49.61 F15 [GT] 8CC 48
F4 [AGC] 4CT 51.67 F16 [GT] 8CG 59.9
F5 [AC] 8CA 57.62 ISSR1 [AG] 8CA 46
F6 [AC] 8CG 59.9 ISSF1 [AG] 8TA 46
F7 [AC] 8CT 46 IMA 5-1 [CA] 8TG 57
F8 [AG] 8CC 46 IMA 8Z [AC] 8CT 46
F9 [AG] 8CG 46 IMA 834 [AG] 8YT 45
F10 [CA] 8AG 57.62 UBC 807 [AG] 8T 46
F11 [CA] 8AC 46 UBC 818X [CA] 8G 55
F12 [GA] 8CC 59.9 UBC 841Y [GA] 7GYC 46
Table 3. Marker attribute information of 7 different ISSR primers tested with 31 populations of Moroccan sesame.
Primers Sequence (5’–3’) Bands size (bp) Total number of markers P M Polymorphism (%) PIC
F7 [AC] 8CT 352–1119 8 8 0 100 0.350
F8 [AG] 8CC 598–1504 8 4 4 50 0.246
F9 [AG] 8CG 359–1453 6 6 0 100 0.104
F11 [CA] 8AC 329–1279 14 14 0 100 0.250
F15 [GT] 8CC 343–1795 10 9 1 90 0.174
UBC 807 [AG] 8T 530–1100 4 4 0 100 0.060
IMA 8Z [GA] 8GT 534–1328 7 1 6 14.28 0.002
Average 8.14 6.57 1.57 80.7 0.169
P: polymorphic markers; M: monomorphic markers; PIC: Polymorphic Information Content.
polymorphic bands, while the minimum polymorphism rate
was found with the IMA8Z primer (14.28%). The average
polymorphism rate was about 80.7%.
3.2 Genetic similarity
According to the simple matching coefficient, similarity
index values ranged from 0.509 to 1.000, with an average of
0.870. The highest similarity (1) was recorded between
537 pairs of individuals or genotypes, from the 31 populations
studied, indicating that they have the same genetic profile. The
lowest similarity coefficient was found between an individual
of the population LZ2 (LZ2-5) and an individual of the
population KF (KF-2), and between KF-2 and an individual of
Fig. 1. PCR amplification profile of the ISSR F9 primer for
the population TG6 (TG6-5), suggesting a maximal genetic
25 samples from the sesame populations analyzed.
distance between the three individuals or genotypes. Twenty-
eight different markers differentiate these individuals (Fig. 2).
Among the total 8385 pairwise combinations, a number of (Tab. 3). Indeed, the study confirmed the genetic variability of
6244 (74.46%) were differentiated by less than 11 markers, the seven primers used. The difference in the Polymorphic
while the other 2141 pairs were distinguished by 11 to Information Content (PIC) reveals the difference in the degree
28 markers (Fig. 2). This explains the low diversity among the of ability to differentiate the genotypes. For a given primer, the
studied populations of Moroccan sesame. more its value tends to 1, the more it is polymorphic and vice
versa. The lowest PIC is 0.002 observed in primer IMA8Z,
indicating the lowest diversity of this primer. The highest PIC
3.3 Polymorphism Information Content
(0.35) is found in F7 primer which gives 100% polymorphic
All primers used generated polymorphic profiles with bands, confirming its greatest ability to distinguish between
variable and significant polymorphic information content genotypes. The average PIC registered is 0.169, which remains
Page 4 of 8M. El Harfi et al.: OCL 2021, 28, 3
Fig. 2. Frequencies distribution of genetic dissimilarity for all the Moroccan sesame populations’ pairs.
too low and indicates a weak polymorphism among the works using ISSR markers to investigate the genetic diversity in
Moroccan sesame populations studied. sesame from Africa and wild relatives (70.6%) (Nyongesa et al.,
2013), Ethiopian sesame (75.86%) (Woldesenbet et al., 2015),
Indian sesame (57%) (Kumar and Sharma, 2011) and Korean
3.4 Genetic relationship among Moroccan sesame sesame (33%) (Kim et al., 2002). In contrast, the average
populations according to cluster analysis polymorphism rate is lower than that reported by Anitha et al.
(2010) (98.5%), having used ISSR markers, and Salazar et al.
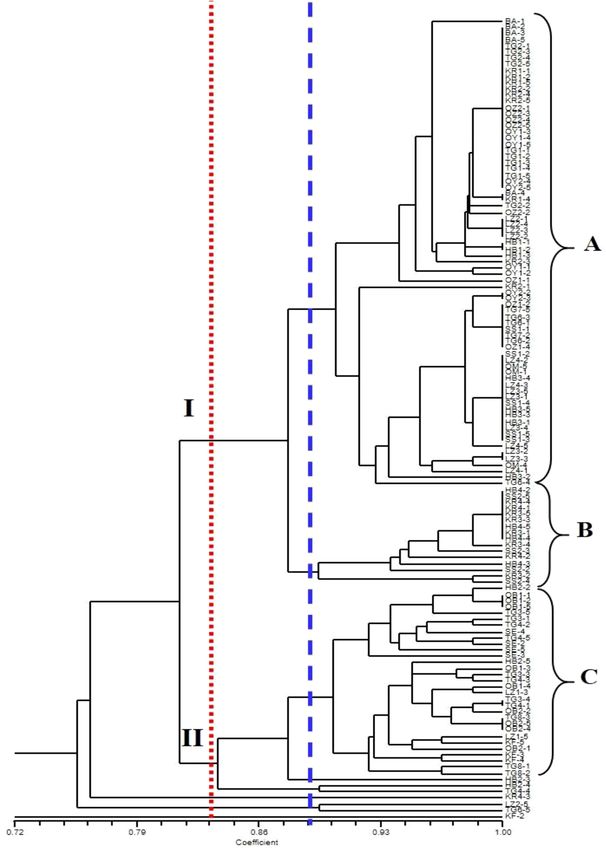
The dendrogram obtained (Fig. 3) illustrates the genetic (2006) (100%), having used RAPD markers in the analysis of
relationships between individuals of the 31 populations genetic diversity of Tamil Nadu sesame and Venezuelan sesame
investigated. The first observation, a primary differentiation varieties, respectively. More recently, in their mapping study in
into two main groups (I and II, Fig. 3) was observed at a sesame, based on the codominant SSRs markers, Dossa et al.
similarity coefficient of 0.83. However, the important (2017) found 78% of polymorphism in the population
distinction of genotypes appears at a level above a coefficient investigated. Differences in polymorphism might be due to
of 0.885. Three clusters and seven independent branches were the genetic material analyzed, the nature of the ISSR primers and
distinguished. The first cluster A includes more than 58.46% of the hybridization temperatures used (Sanchez de la Hoz et al.,
individuals of Moroccan sesame populations, containing 1996). Low hybridization temperature can increase nonspecific
individuals from populations; 1, 2, 3, 4, 5, 6, 8, 9, 10, 20, amplification, leading to artifact bands. It was reported that
21, 22, 25, 27, 28, 29, 30 and 31. Clusters B and C include, modification of hybridization temperature greatly affected
respectively, 12.30% and 23.84% of individuals. According to richness and readability of fingerprints (Bornet and Branchard,
the Figure 3, the individuals of the populations 32, 33, 34 and 2001).
35 are found in the same cluster B. The group corresponding to Polymorphism Information Content (PIC) value is the
cluster C consisted of individuals from the populations 11, 12, discriminatory power of primers and used as a relative measure
13, 14, 15, 16, 17, 18 and 19. Therefore, the dendrogram level of polymorphism. In other words, PIC is used to
confirms the pairwise comparison, showing that several determine the informativeness of a genetic marker for linkage
individuals have the same genetic profiles. studies. In plants, PIC values often range from zero to 0.5,
The use of a high number of polymorphic ISSR primers is of respectively for monomorphic ISSR-markers and polymorphic
great utility as it increases the reliability of the interpretation of ISSR-markers that are present in 50% of the plants and absent
the results, especially if the generated profiles are reproducible in the other 50% (Roldán-Ruiz et al., 2000). In the present
(Handaji et al., 2012). This number varies according to plant study, PIC varied from 0.002 to 0.35, indicating that ISSR
species analyzed and differs from one study to another. The markers are informative and relevant for discriminating the
number of primers used in the present research was just seven, populations evaluated. However, these values remain lower
which was equal to that used for analyzing the genetic diversity in than those obtained by Anitha et al. (2010) in 10 Indian sesame
Ethiopian Sesame germplasm (Abate et al., 2015). However, populations (from 0.496 to 0.854), Abate et al. (2015) in
smaller number of ISSR primers was adopted to study the genetic Ethiopian sesame (from 0.26 to 0.76) and Singh et al. (2015) in
diversity in other annual species, for example five primers in 44 Indian sesame populations (PIC = 0.675). The differences
Brassica napus (Abdelmigid, 2012) and Melocanna baccifera observed among the various studies might be due to the
(Nilkanta et al., 2017). The average polymorphism rate obtained populations used, and the nature and number of molecular
in this study (80.7%) is higher than that reported in previous markers.
Page 5 of 8M. El Harfi et al.: OCL 2021, 28, 3
Fig. 3. Dendrogram generated for individuals from 31 Moroccan sesame populations using UPGMA cluster analysis.
Page 6 of 8M. El Harfi et al.: OCL 2021, 28, 3
Similarity coefficient between the investigated populations 4 Conclusion
varied from 0.509 to 1, with an average of 0.87. The similarity
coefficients found between the Moroccan sesame populations This study has given some useful information about the
are comparable with those reported by Singh et al. (2015) in a genetic diversity of Moroccan sesame populations. Polymor-
collection of 44 Indian sesame genotypes (from 0.65 to 0.87, phism and PIC found in this study indicated that the ISSR
with a mean value of 0.76). However, wider range of similarity markers used were highly reproducible. Although a limited
coefficient (from 0.26 to 0.96) was observed among populations number of ISSR markers were used in the study, the results
of cultivated sesame and wild sesame from West Africa confirm that ISSR markers are effective in detecting
(Nyongesa et al., 2013). The quite high average similarity polymorphism between Moroccan sesame populations. How-
coefficient (0.87) observed in the present research suggests that ever, the high similarity coefficients found between them as
the genetic variability among the studied sesame populations is well as the pairwise comparison of these populations show that
low. High values of this coefficient explain the kinship link there is a low genetic diversity among them. Thus, this result
existing between these populations collected from Tadla zone agrees with that of agromorphological characterization. At
that represents the largest area of sesame cultivation in Morocco, 88.5% similarity, the individuals of the 31 populations of
with about 90%. This low diversity in Moroccan populations is Moroccan sesame were grouped into three large clusters and
confirmed by the pairwise comparison in which most seven independent branches. Therefore, to find clear patterns
combinations are distinguishable by less than 11 markers. Thus, of diversity and to have a sound conclusion, further studies
one could notice that several combinations have the same genetic should be conducted through comparison with foreign genetic
profile. Also, the observed low diversity is confirmed by pools, using preferably codominant molecular markers.
hierarchical analysis. In fact, the emerged dendrogram shows Besides, in order to launch sesame breeding program in
that the genetic profile of the 31 Moroccan sesame population is Morocco, new germplasms should be introduced from diverse
close and might be derived from one or few genetic pools only. In geographical origins. Otherwise, novel genetic variability may
contrast, in a similar study in safflower, Houmanat et al. (2016) be induced through mutagenesis breeding.
showed that the majority of pairwise combinations are
distinguishable by more than eight markers. References
The analysis of the clusters of the dendrogram generated by
the ISSR markers shows the existence of correlation between
Abate M, Mekbib F, Ayana A, Nigussie M. 2015. Assessment of
geographical locations and genomic similarity for some genetic diversity in Ethiopian sesame (Sesamum indicum L.)
populations. This is the case of populations 1 (BA), 30 germplasm using ISSR markers. Br Biotechnol J 8: 1–13.
(OM), 6 (OY1) and 9 (OY2), all grouped in cluster A, and Abdelmigid HM. 2012. Efficiency of random amplified polymorphic
populations 12 (OB1), 18 (OB2), 15 (SE) and 19 (KF), all DNA (RAPD) and inter–simple sequence repeats (ISSR) markers
found in cluster B. For the other populations, the distribution of for genotype fingerprinting and genetic diversity studies in canola
sesame populations operates independently from their origin (Brassica napus). Afr J Biotechnol 11: 6409–6419.
location, indicating no correlation between their geographical Adeola YB, Augusta CO, Oladejo TA. 2010. Proximate and mineral
origin and their genetic distance. Besides, and in comparison composition of whole and dehulled Nigerian sesame seeds. Afr J
with agromorphological assessment of the studied plant Food Sci Technol 1:71–75
materials, three populations of cluster C are characterized Anderson JA, Churchill GA, Sutrique JE, Tanksley SD, Sorrells ME.
by high number of seeds per capsule, low height at first capsule 1993. Optimizing parental selection for genetic linkage maps.
and intermediate thousand seeds weight value. These are 32 Genome 36: 181–186.
(HB4), 33 (KR3) and 34 (KR4). Furthermore, individuals of Anitha BK, Manivannan N, Vindhiyavarman P, Gopalakrishnan C,
the same population were clustered into the same branch, Ganesamurthy K. 2010. Molecular diversity among sesame
suggesting there is no intra-population variation. varieties of Tamil Nadu. Electron J Plant Breed 1: 447–452.
The findings of this study suggest that the investigated Bedigian D, Harlan JR. 1986. Evidence for cultivation of sesame in
populations might originate from the same cultivar whose the ancient world. Econ Bot 40: 137–154.
name would be ‘Blonde of Marrakech’ as reported by Skiredj Bornet B, Branchard M. 2001. Nonanchored Inter Simple Sequence
et al. (2003). However, to analyze in depth these populations, Repeat (ISSR) markers: reproducible and specific tools for
genome fingerprinting. Plant Mol Biol Rep 19: 209–215.
additional studies using codominant markers are needed,
Brzustowski J. 2002. Clustering calculator “fast clustering algo-
especially in terms of comparison with foreign genetic
rithms, including UPGMA and Saitou-Nei neighbor joining”.
resources that can give more information on the diversity Canada: Department of Biological Sciences, University of
level of Moroccan populations and their genetic proximity to Alberta. Available from http://www.biology.ualberta.ca/
those foreign resources. Furthermore, other minor local jbrzusto/cluster.php (last consult: 2020/23/03).
cultivars from other zones than Tadla should be involved in Chen F, Ahmed T, Liu YJ, He KL, Wang ZY. 2014. Analysis of
those upcoming studies. genetic diversity among different geographic populations of
To launch a sesame breeding program, a large genetic Athetis lepigone using ISSR molecular markers. J Asian Pac
variability should be available. In light of the results obtained, Entomol 17: 793–798.
it will be necessary to get additional genetic material to widen Dar AA, Arumugam N. 2013. Lignans of sesame: purification
the existing variability. The most common strategy is to methods, biological activities and biosynthesis A review.
introduce new germplasms from some sesame producing Bioorg Chem 50: 1–10.
countries throughout the world. Another strategy may be Dar AA, Kancharla PK, Chandra K, Sodhi YS, Arumugam N. 2019a.
adopted and consists of inducing novel genetic variability from Assessment of variability in lignin and fatty acid content in the
the existing material using mutagenesis technique. germplasm of Sesamum indicum. J Food Sci Technol 56: 976–986.
Page 7 of 8M. El Harfi et al.: OCL 2021, 28, 3
Dar AA, Mahajan R, Sharma S. 2019b. Molecular markers for the status, features and importance A review. Agric Rev 38:
characterization and conservation of plant genetic resources. 223–227.
Indian J Agric Sci 89: 1755–1763. Rohlf FJ. 1998. NTSYS-pc 2.02. Numerical taxonomy and
Dar AA, Mudigunda S, Mittal PK, Arumugam N. 2017. Comparative multivariate analysis system. Setauket, New York, USA: Exeter
assessment of genetic diversity in Sesamum indicum L. using Software: Applied Biostatistics Inc.
RAPD and SSR markers. 3 Biotech 7: 10. Roldán-Ruiz I, Dendauw J, Van Bockstaele E, Depicker A, De Loose
Dossa K, Yu J, Liao B, Cisse N, Zhang X. 2017. Development of M. 2000. AFLP markers reveal high polymorphic rates in
highly informative genome-wide single sequence repeat markers ryegrasses (Lolium spp.). Mol Breed 6: 125–134.
for breeding applications in sesame and construction of a web Saghai-Maroof MA, Soliman KM, Jorgensen RA, Allard RW. 1984.
resource: SisatBase. Front Plant Sci 8: 1470. Ribosomal DNA spacer-length polymorphisms in barley:
El Harfi M, Jbilou M, Hanine H, Rizki H, Fechtali M, Nabloussi A. Mendelian inheritance, chromosomal location, and population
2018. Genetic diversity assessment of Moroccan sesame dynamics. Proc Natl Acad Sci U S A 81: 8014–8018.
(Sesamum Indicum L) populations using agromorphological Salazar B, Laurentin H, Davila M, Castillo MA. 2006. Reliability of
traits. J Agric Sci Technol A 8: 296–305. the RAPD technique for germplasm analysis of Sesame
FAOSTAT. 2018. FAO statistical database. Available from http:// (Sesamum indicum L.) from Venezuela. Interciencia 31: 456–460.
www.fao.org/faostat/en/#data/QC (last consult: 2019/01/27). Sanchez de la Hoz MP, Davila JA, Loarce Y, Ferrer E. 1996. Simple
Ferdinandez YSN, Somers DJ, Coulman BE. 2001. Estimation the sequence repeats primer used in PCR amplifications to study
genetic relationship of hybrid bromegrass to smooth bromegrass genetic diversity in barley. Genome 39: 112–117.
and meadow bromegrass using RAPD markers. Plant Breed 120: Sehr EM, Okello-Anyanga W, Hasel-Hohl K, et al. 2016. Assessment
149–153. of genetic diversity amongst Ugandan sesame (Sesamum indicum
Handaji N, Benyahia H, Gaboun F, Ibriz M. 2012. Caractérisation et L.) landraces based on agromorphological traits and genetic
structuration de la diversité génétique du germoplasme de markers. J Crop Sci Biotechnol 19: 117–129.
mandarines par les marqueurs moléculaires ISSR au Maroc. Singh KM, Kumar DB, Kumar DS, Manorama. 2015. Assessment of
J Appl Biosci 57: 4186‒4197. genetic diversity among Indian Sesame (Sesamum indicum L.)
Houmanat K, Charafi J, Mazouz H, El Fechtali M, Nabloussi A. 2016. accessions using RAPD, ISSR and SSR markers. Res J Biotechnol
Genetic diversity analysis of safflower (Carthamus tinctorius L.) 10: 35–47.
accessions from different geographic origins using ISSR markers. Skiredj A, El Attir H, El Fadl A. 2003. Fiche technique des cultures
Int J Agric Biol 18: 1081–1087. aromatiques et condimentaires. Department d’horticulture, IAV
Kim DH, Zur G, Danin-Poleg Y, et al. 2002. Genetic relationships of Hassan II, pp. 22. Available from https://studylibfr.com/doc/
sesame germplasm collection as revealed by inter-simple 885224/3.cultures-aromatiques-legumieres (last consult: 2020/
sequence repeats. Plant Breed 121: 259–262. 01/05).
Kumar V, Sharma SN. 2011. Comparative potential of phenotypic, ISSR Spawan KT, Kar J, Sahu D. 2019. Advances in sesame (Sesamum
and SSR markers for characterization of sesame (Sesamum indicum indicum L.) breeding. In: Al Khayri JM, Jain SM, Johnson DV,
L.) varieties from India. J Crop Sci Biotechnol 14: 163–171. eds. Advances in plant breeding strategies: industrial and food
Laurentin H, Karlovsky P. 2006. Genetic relationship and diversity in crops. V6. Switzerland AG: Springer Nature, pp. 577–636.
sesame (Sesamum indicum L.) germplasm collection using Uncu AO, Gultekin V, Allmer J, Frary A, Doganlar S. 2015. Genomic
amplified fragments length polymorphisms (AFLP). BMC Genet 7: simple sequence repeat markers reveal patterns of genetic
1–10. relatedness and diversity in sesame. Plant Genome 8: 1–12.
Medraoui L, Ater M, Benlhabib O, Msikine D, Filali-Maltouf A. Uzun B, Arslan C, Karhan M, Toker C. 2007. Fat and fatty acids of
2007. Evaluation of genetic variability of sorghum (Sorghum white lupin (Lupinus albus L.) in comparison to sesame
bicolor L. Moench) in northwestern Morocco by ISSR and RAPD (Sesamum indicum L.). Food Chem 102: 45–49.
markers. C R Biol 330: 789–797. Wang L, Yu S, Tong C, et al. 2014. Genome sequencing of the high oil
Nilkanta H, Amom T, Tikendra L, Hamidur R, Nongdam P. 2017. crop sesame provides insight into oil biosynthesis. Genome Biol
ISSR marker based population genetic study of Melocanna 15: R39.
baccifera (Roxb.) Kurz: a commercially important bamboo of Woldesenbet DT, Tesfaye K, Bekele E. 2015. Genetic diversity of
Manipur, North-East India. Scientifica 2017: 1–9. sesame germplasm collection (Sesamum indicum L.): implication
Nyongesa BO, Were BA, Gudu S, Dangasuk OG, Onkware AO. 2013. for conservation, improvement and use. Int J Biotechnol Mol Biol
Genetic diversity in cultivated sesame (Sesamum indicum L.) and Res 6: 7–18.
related wild species in East Africa. J Crop Sci Biotechnol 16: Zhang YX, Zhang XR, Hua W, Wang LH, Che Z. 2010. Analysis of
9–15. genetic diversity among indigenous landraces from sesame
Pathak K, Rahman SW, Bhagawati S, Gogoi B. 2017. Sesame (Sesamum indicum L.) core collection in China as revealed by
(Sesamum indicum L.), an underexploited oil seed crop: Current SRAP and SSR markers. Genes Genom 32(3): 207–215.
Cite this article as: El Harfi M, Charafi J, Houmanat K, Hanine H, Nabloussi A. 2021. Assessment of genetic diversity in Moroccan sesame
(Sesamum indicum) using ISSR molecular markers. OCL 28: 3.
Page 8 of 8You can also read