COMBINATION OF CLIMATOLOGICAL INFORMATION AND METEOROLOGICAL FORECAST FOR SEAMLESS PREDICTION OF ALPINE SNOW CONDITIONS
←
→
Page content transcription
If your browser does not render page correctly, please read the page content below
Proceedings, International Snow Science Workshop, Innsbruck, Austria, 2018

    COMBINATION OF CLIMATOLOGICAL INFORMATION AND METEOROLOGICAL
     FORECAST FOR SEAMLESS PREDICTION OF ALPINE SNOW CONDITIONS

        C.M. Carmagnola1,∗, S. Morin1 , M. Lafaysse1 , M. Vernay1 , H. François2 , N. Eckert2 , L. Batté3 , J.-M.
                                              Soubeyroux4 , C. Viel4
    1
        Univ. Grenoble Alpes, Université de Toulouse, Météo-France, CNRS, CNRM, Centre d’Études de la Neige, Grenoble, France
                                         2
                                           Univ. Grenoble Alpes, Irstea, LESSEM, Grenoble, France
                                3
                                  CNRM, Université de Toulouse, Météo-France, CNRS, Toulouse, France
                                                  4
                                                    DCSC, Météo-France, Toulouse, France

ABSTRACT:
Ski-resort management strongly depends on meteorological conditions, in particular natural snowfall and con-
ditions favorable for technical snowmaking. Therefore, improved anticipation capabilities up to the seasonal
scale hold significant potential to improve the real-time adaptation of ski-resorts to upcoming meteorologi-
cal conditions. In this context, the H2020 PROSNOW project will build a demonstrator of a meteorological,
climate and snow management prediction system from few days to several months ahead, with a seamless
approach specifically tailored to the needs of the ski industry. This work presents preliminary results achieved
within PROSNOW. A 4 day lead-time numerical weather prediction product has been combined with clima-
tological forcing in order to feed the detailed snowpack model SURFEX/ISBA-Crocus, allowing to generate
an ensemble of possible realizations of the unfolding of the snow season. Snow height simulations, carried
out at different altitudes in a French ski-resort, are shown and several improvements in the ability to better
forecast the observed snow height on the ski slopes are discussed. The relative impact of the current snow
conditions and the upcoming meteorological conditions on the future state of the snowpack is assessed using
appropriate statistical metrics (Rank Diagrams, Brier Scores, CRPS and CRPSS), highlighting in particular
the impact of re-initializing the snow height throughout the winter season and using forecast against mere
reanalysis-based forcing to drive the simulations. Overall, our results show the significant potential of the
approach combining snow height initialization and forecast forcing to predict the future state of the snow-
pack, thereby demonstrating the interest of the PROSNOW modeling framework as a decision-making tool
for ski-resort managers.
Keywords:
ski-resorts, snow management, snowmaking, snowpack modeling, numerical weather prediction, climate
services

1. INTRODUCTION                                                        economic terms (premature melt of the snow pro-
                                                                       duced, overproduction, inadequate grooming fre-
When looking at weather and snow forecast, ski-                        quency, etc.) and ecological, not to mention the
resort operators have to rely on various and scat-                     quality of snow on the slopes and the satisfaction
tered sources of information, hampering their ability                  of skiers.
to cope with highly variable meteorological condi-
                                                                          In this context, snow management and slope
tions. This makes the snow management optimiza-
                                                                       preparation in ski-resorts could strongly benefit from
tion particularly challenging, in particular for snow-
                                                                       anticipation tools to assist the decision-making pro-
making. For example, the required water volumes
                                                                       cess. Improved anticipation capabilities at all time
are currently estimated before the snow season and
                                                                       scales, spanning from ”weather forecast” (up to 5
based on general information, such as the worst en-
                                                                       days typically) to ”climate prediction” at the sea-
countered snow season in the past, with only one or
                                                                       sonal scale (up to several months) holds signifi-
two decades of historical hindsight. This lack of an-
                                                                       cant potential to increase the resilience of socio-
ticipation can have negative consequences, both in
                                                                       economic stakeholders and support their real-time
                                                                       adaptation potential to upcoming meteorological
    ∗ Corresponding author address:                                    conditions. The H2020 PROSNOW project (www.
C.M. Carmagnola, Météo-France - CNRS, CNRM, Centre                   prosnow.org) will meet this need by designing, de-
d’Études de la Neige,
                                                                       veloping and implementing a decision-making ser-
1441 rue de la Piscine - 38400 Saint-Martin d’Hères (France),
tel: +33 776021726                                                     vice based on meteorological, climate and snow
email: carlo.carmagnola@meteo.fr                                       prediction from one week to several months ahead,

                                                                 503
Proceedings, International Snow Science Workshop, Innsbruck, Austria, 2018

specifically tailored to the needs of the ski industry          (so-called ”massifs”) within which meteorological
(Morin et al., 2018).                                          conditions are assumed to depend only on altitude.
   The key hypothesis behind PROSNOW is that ad-               For the analysis of meteorological surface fields,
equately combining in-situ observations of the snow            the guess used by SAFRAN consists of vertical
conditions on ski slopes, which form the starting              atmospheric profiles from numerical weather
point of any forecast, with atmospheric predictions            prediction (NWP) models. A robust assimilation
spanning meteorological to seasonal time scales in             scheme corrects the initial guess using ground-
a seamless manner (Pappenberger et al., 2011),                 based and radiosonde observations as well as
will provide added value for operational decision-             remotely-sensed cloudiness.      Thus, SAFRAN
making. This hypothesis is discussed in this work,             provides hourly meteorological conditions for each
introducing and quantifying the added value of com-            massif for 300 m-spaced elevation bands, also
bining forecast and climatological information for the         accounting for aspect and slope.
prediction of snow conditions at the scale of the sea-
son. In particular, we have assessed the partition-
ing of the predictability of snow conditions due to,
on the one hand, the initial conditions of the snow-           2.3. PEARP-SAFRAN ensemble forecast
pack (i.e. the impact of the ”memory of snow”) and,
on the other hand, the upcoming weather condi-                 In this study we have used a probabilistic version of
tions. All these evaluations of the predicted con-             ARPEGE, called PEARP for Prévision d’Ensemble
ditions of the snowpack have been performed com-               ARPEGE (Descamps et al., 2014), to generate an
puting appropriate, proper statistical metrics (Rank           ensemble of 35 different predicted meteorological
Diagrams, Brier Scores, CRPS and CRPSS), well                  conditions. PEARP has been post-processed to
suited for analyzing the skills of probabilistic fore-         provide forecast data matching the type (variables)
casts. This statistical evaluation is crucial to esti-         and geometry (massifs, elevations) of SAFRAN.
mate the uncertainty affecting the forecast and the            This PEARP-SAFRAN forecast (also referred to as
expected impact of operational decisions taken at              PEARP hereafter) has a 4 day lead-time and it is
various times of the season by the ski-resort man-             initialized each day at 6 UTC.
agers.

2. MATERIAL AND METHODS                                        2.4. Snowpack modeling configurations

2.1. Crocus snowpack model                                     The forcing data described above (SAFRAN analy-
                                                               sis and PEARP-SAFRAN ensemble forecast) have
In this study, we have used the detailed snowpack              been combined in different ways to provide the
model SURFEX/ISBA-Crocus (Vionnet et al.,                      Crocus snowpack model with the required meteo-
2012). This model, referred to as Crocus hereafter,            rological driving data. The resulting configurations
explicitly solves the energy and mass balance                  are presented in Fig. 1.
of the snowpack to simulate the evolution of the
physical properties of a multi-layer snowpack in               Analysis (A). The SAFRAN analysis has been
a detailed manner, including internal phenomena                taken as a proxy for the meteorological obser-
such as phase change, water percolation, snow                  vations, since, as explained earlier, it already
compaction, snow metamorphism and their impact                 integrates measurements from various sources
on the radiative and thermal properties of the                 and the spatial scale of simulated variables does
snowpack. Here we focus only on natural snow                   not have observation equivalents. Analysis-based
processes.                                                     snowpack simulations have been run starting from
                                                               the 1st of August and are considered as ”pseudo-
                                                               observations” of the snow season of interest.
2.2. SAFRAN analysis
                                                               Reanalysis (R). The SAFRAN reanalysis of 35 past
In order for Crocus model to be run, consistent                winter seasons (from 1982/1983 to 2016/2017) has
meteorological input data are required.    The                 been used to generate an ensemble of meteorolog-
generation of those data necessary to feed the                 ical conditions. This ensemble has then been used
numerical snowpack model Crocus is carried out                 to drive Crocus to obtain 35 possible evolutions
by the meteorological downscaling and surface                  of the snow conditions. The median value of
analysis tool SAFRAN (Durand et al., 1999).                    this ensemble is considered as a climatological
SAFRAN operates at the geographical scale of                   reference, since it represents the expected snow
meteorologically homogeneous mountain ranges                   conditions for each location of interest based on

                                                         504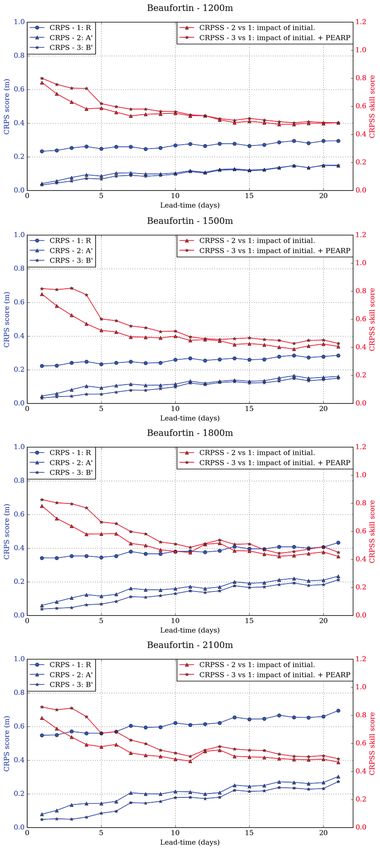
Proceedings, International Snow Science Workshop, Innsbruck, Austria, 2018

Figure 1: Snowpack modeling configurations obtained with different combinations of meteorological forcing
data. For the reanalysis, in the graphic only the quantiles q20, q50 and q80 are shown.

climatology.                                                   2.5. Statistical metrics

Analysis + Reanalysis-based forecast (A’). This                Forecast scores are used to quantify the accuracy
configuration is a combination of the first 2. For               and/or degree of association of a forecast to an
each calendar date, the outputs of the SAFRAN-                 observation (or an estimate of the actual value of
Crocus analysis have been used to provide the                  what is being predicted), whereas skill scores are
initial state of the snowpack, starting from which             used to evaluate the skills of a forecast with respect
an ensemble of snow simulations has been built                 to the skills of a reference method, supposedly sim-
by using the SAFRAN reanalysis of past seasons                 pler to implement. In this work, the performances
as a surrogate for possible meteorological future              of the ensemble simulations have been evaluated
conditions for the next weeks to months. This con-             using the 3 metrics described below.
figuration, called A’ with reference to Fig. 2 of Morin
et al. (2018), shows the impact of initializing the            Rank Diagrams
state of the snowpack, compared to configuration R
which does not include any initialization during the              Rank Diagrams (sometimes also called verifica-
snow season.                                                   tion rank histograms or Talagrand diagrams) are a
                                                               way to show how reliable an ensemble forecast is
Analysis + PEARP + Reanalysis-based forecast                   compared to a set of observed data (Hamill, 2000).
(B’). This configuration is similar to A’, with the             In other words, they measure how well the ensem-
difference that the first 4 days of forecast are taken          ble spread of the forecast represents the true vari-
from PEARP-SAFRAN, instead of reanalysis. It is                ability (uncertainty) of the observations, by counting
called B’ with reference to Fig. 2 of Morin et al.             where the verifying observation falls with respect to
(2018) and allows to highlight the combined contri-            the ensemble forecast data.
butions of initializing the state of the snowpack and             In an ensemble with perfect spread, each mem-
using NWP to drive the simulations instead of mere             ber represents an equally likely scenario, so the
reanalysis.                                                    observation is equally likely to fall between any
                                                               two members. A flat diagram then means that the
   We expect that moving from R to A’ to B’ (i.e.              ensemble is accurate (or reliable): the observed
starting from the reanalysis and complexifying                 values are indistinguishable from any forecast
the system by progressively accounting for the                 member of the ensemble and the ensemble
initialization and using NWP) will improve our ability         spread correctly represents forecast uncertainty.
to match the actual behavior of the snowpack                   Conversely, deviations from a uniform distribution
represented by model run A.                                    mean that the model is biased. U-shaped dia-
                                                               grams are obtained when the ensemble spread is

                                                         505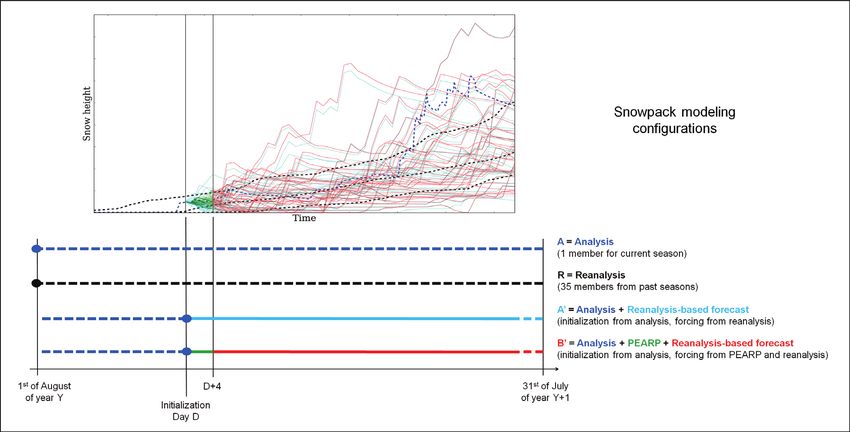
Proceedings, International Snow Science Workshop, Innsbruck, Austria, 2018

too small, many observations falling outside the                  The skill of a prediction system can also be com-
extremes of the ensemble (in particular, a peak                puted with respect to its benefit over a simpler en-
on the right side of the diagram indicates that the            semble prediction method. To this aim, the CRPS of
ensemble members are systematically lower than                 a forecast can be compared to the CRPS of a refer-
the observations). Finally, a dome-shaped diagram              ence, baseline method via the Continuous Ranked
means that the ensemble spread is too large, too               Probability Skill Score (CRPS S ):
many observations falling near the center of the
ensemble.                                                                                      CRPS
                                                                              CRPS S = 1 −                         (3)
                                                                                              CRPS re f
Brier Score                                                    By definition, CRPS S equals 0 when the prediction
                                                               performs similarly to the baseline method used as a
   The most common probabilistic score is the Brier            reference, approaches 1 when the prediction over-
Score (Brier, 1950), which describes the ensemble              performs the reference and tends to -∞ when the
forecast system performance in terms of a given                prediction under-performs the reference.
threshold exceedance. In its most common formu-
lation, the Brier Score ( BS ) is defined as the mean
squared error of the probabilistic forecast:                   2.6. Implementation and evaluation data

                      1  f                                    This work reports on simulations carried out during
                         N            2
               BS =         P − Poi                (1)         the 2017/2018 winter season, characterized by very
                      N i=1 i
                                                               large snow accumulations in the French Alps, es-
where N is the number of prediction instances,                 pecially above 2000m. Results obtained at differ-
Pif is the forecast probability of exceeding a given           ent altitudes and on flat terrain in the French ski-
threshold at instance i and Poi is the observed out-           resort of Les Saisies (in the Beaufortain mountain
come of the event at instance i (1 if the observation          range, Haute-Savoie, with elevations ranging ap-
is above the threshold, 0 otherwise). The Brier                proximately from 1200m to 2100m) are shown. Les
Score ranges from 0 (representing a perfect score)             Saisies is one of the 8 pilot ski-resorts of the PROS-
to 1, since this is the largest possible difference            NOW project.
between a predicted probability (which must be                    The snowpack model Crocus (Sect. 2.1) has
between 0 and 1) and the actual outcome (which                 been run using different combinations of forcing
can take values of only 0 or 1).                               data provided by the SAFRAN analysis (Sect. 2.2)
                                                               and the PEARP-SAFRAN forecast (Sect. 2.3), gen-
Continuous Ranked Probability Score                            erating several ensembles of possible realizations
                                                               of the unfolding of the snow season (Sect. 2.4).
   The Continuous Ranked Probability Score                     Then, results have been evaluated in terms of snow
(CRPS ) compares a forecast with an observation,               height using the metrics described in Sect. 2.5.
where both are represented as Cumulative Distribu-             During this evaluation process, each of the 3 snow
tion Functions (CDF s). The equation for calculation           height ensembles (R, A’ and B’) has been compared
of the CRPS is the following:                                  to A to assess its performances.
                                                                  For the Rank Diagrams, for a given elevation
           N
                                                               and a given initialization date D, the percent-
        1  x=+∝                        2
                                                               ages of curves falling above or below the pseudo-
 CRPS =            CDFif (x) − CDFio (x) dx
        N i=1 x=−∝                                             observations have been computed for each lead-
                                                   (2)         time (D + 1, D + 2, etc.) and then added. Finally, the
              f
where CDFi is the forecast probability CDF at in-              results obtained for all 151 daily initializations along
stance i and CDFio is the observed probability CDF             the season (from 01/11/2017 to 31/03/2018) have
at instance i. If the observation is represented by a          been aggregated and normalized in order to end up
single value, then the corresponding CDF is a sin-             with a single diagram per elevation per season.
gle step-function with the step from 0 to 1 at the                For the Brier Scores, a similar approach has been
observed value of the variable (Heaviside function).           followed, with 2 main differences. First, for each
The calculation of the CRPS , which can be seen as             lead-time the members of the ensembles and the
a Brier score integrated over all possible thresholds          pseudo-observations have been compared to 3 pre-
(Brown, 1974), results in a value expressed in the             defined snow height exceedance thresholds (set to
units of the forecast variable (meters, in the case of         0.5, 1 and 2m) through Eq. 1. The values of N
snow height). The perfect score is achieved when               in the equation correspond to the number of days
CRPS is equal to 0, meaning that the forecast en-              (D + 1, D + 2, etc.) after each initialization and then
semble is both accurate (low bias) and sharp (small            decrease when the initialization date D is moved
spread).                                                       along the season and less lead-time dates remain

                                                         506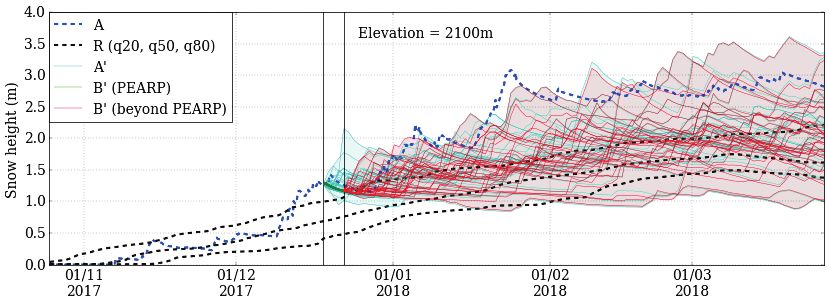
Proceedings, International Snow Science Workshop, Innsbruck, Austria, 2018

Figure 2: Simulated snow heights during the 2017/2018 winter season at 2100m at Les Saisies ski-resort.
Colors correspond to different snowpack modeling configurations (see Fig. 1 for more details).

available. Second, in this case the results from dif-          show how the wide variability in meteorological con-
ferent initialization dates have not been aggregated,          ditions translates into a wide range of snow height
so that the evolution of the Brier Scores over the             values, when meteorological conditions from differ-
season can be represented.                                     ent years are used. The range of snow height
   For the CRPS, Eq. 2 has been applied for all                values which can be ”expected” starting from a
initialization dates along the season and computed             given initialization date increases rapidly with lead-
for all lead-times. Then the results have been ag-             time, so that predicting precisely snow height val-
gregated for each lead-time value. In this case,               ues using only forcing data from the reanalysis has
the values of N in the equation represent the total            poor predictive power at the seasonal scale. Using
number of results obtained for each lead-time and              PEARP to force the snowpack simulations during
decrease with increasing lead-time (when the lead-             the first 4 days after the initialization improves the
time is D + k, N is equal to the number of days in             forecast even after the 4 day timespan. However,
the season, 151, minus k). The CRPSS has been                  this effect fades over time and less than 2 weeks
calculated through Eq. 3 using the CRPS of the re-             after the initialization the benefit of having used the
analysis as a reference. This way, it is possible to           NWP product instead of mere reanalysis is almost
highlight the impact of initialization only (A’) and a         negligible.
combination of initialization and NWP (B’) against
                                                                  Since we have used forcing data coming from the
the performances of mere reanalysis (R).
                                                               reanalysis of past winter seasons to drive the snow-
                                                               pack simulations (except for the first 4 days after
3. RESULTS AND DISCUSSION                                      the initialization, when PEARP was also used), we
                                                               expect that the overall match between the predic-
Figure 2 shows the time evolution of snow height               tion and the analysis is maximized when the un-
during the 2017/2018 winter season, at 2100m on                folding of a given season resembles most the cli-
flat terrain within Les Saisies ski-resort. The snow-           matological median. In contrast, predictions made
pack simulations have been fed with a combination              during snow seasons displaying significantly higher
of different forcing datasets: the blue dashed line            or lower snow height than the reanalysis will dis-
represents the analysis of the current season, the             play under- and over-estimated snow heights, re-
black dashed lines represent the quantiles 20, 50              spectively (the example shown in Fig. 2 belongs to
and 80 of the reanalysis, the cyan curves repre-               the first case). For the same reason, the predic-
sent the simulations initialized on the 18th of De-            tion curves and the reanalysis exhibit similar pat-
cember 2017 with the analyzed state of the snow-               terns, which is simply due to the fact that the same
pack and driven by the reanalysis-based forecast,              meteorological forcing data have been used to per-
the green curves represent the simulations driven              form all simulations. Nevertheless, significant dif-
by the PEARP forecast from the 18th to the 22nd of             ferences between the climatological values and the
December 2017 and the red curves represent the                 prediction results (with and without using PEARP)
simulations initialized with the state of the snowpack         are present, due to the initialization with snow con-
at the end of PEARP and driven by the reanalysis-              ditions potentially widely different from the climato-
based forecast.                                                logical median. This mainly stems from the inter-
   The ensemble simulations of Fig. 2 eloquently               annual variability in snow precipitation during the

                                                         507
Proceedings, International Snow Science Workshop, Innsbruck, Austria, 2018
accumulation period, which is the main driver of fect of using PEARP becomes negligible after a few
seasonal snow variability in the case studied. weeks.
In order to generalize these first conclusions and The CRPS and CRPSS (Fig. 5) show an obvi-
to better quantify the relative importance of current ous degradation of the scores with lead-time. Re-
snow conditions, date of the prediction and upcom- gardless of the lead-time, however, it is clear that
ing meteorological conditions on future state of the accounting for the current snow conditions signifi-
snowpack, we have run different snowpack ensem- cantly improves the skill and the usefulness of the
ble simulations (Sect. 2.4) for a larger number of model chain. The predictability of snowpack con-
initialization dates and then computed the statisti- ditions using the snow height initialization keeps a
cal scores (Sect. 2.5) with the approach described predictive value with respect to the reanalysis for a
in Sect 2.6. Some results are shown in Fig. 3, few weeks after the date of the prediction, in terms
Fig. 4 and Fig. 5, which present, respectively, the of snow height values. These scores also allow
Rank Diagrams, the Brier Scores and the CRPS to highlight the improving effect of adding PEARP,
and CRPSS for the whole 2017/2018 winter season whose benefit lasts beyond the 4 day lead-time and
at Les Saisies ski-resort. is more significant when larger amount of snow are
present on the ground. These results assess the
The Rank Diagrams (Fig. 3) generally show a
possibility to carry out informative forecasts at time
peak on the right side, indicating that the ensemble
scales exceeding one week and provide the foun-
members are systematically lower than the obser-
dation for the development of the PROSNOW oper-
vations. Indeed, the snow cover during this particu-
ational chain.
lar season was more abundant than the average,
which leads to an overall under-estimation of the
observed snow height by the simulations driven by 4. CONCLUSIONS AND OUTLOOK
the reanalysis. This effect increases with altitude,
since snow accumulation during the 2017/2018 win- The current study addresses the predictability of
ter season was particularly large at higher eleva- snow conditions in mountain regions, providing
tions. For example, the performances of the re- quantitative insights into how current snow condi-
analysis with respect to the analysis at 2100m (top tions and subsequent meteorological conditions in-
right panel) indicate that almost 80% of the times at fluence the unfolding of a given snow season. To
least 34 members of the reanalysis are below the this goal, a prediction system was built, consisting
pseudo-observations. More interestingly, the effect of an ensemble of numerical simulations performed
of initializing the snow conditions (middle row) leads with the detailed snowpack model Crocus, fed by a
to a flatter diagram, meaning that the forecast en- combination of meteorological conditions and initial-
semble tends to be more accurate compared to the ized daily with pseudo-observations.
one obtained without initialization (top row). In this It was found that the current version of the pre-
representation, the added-value of PEARP (bottom diction system keeps an interest with respect to re-
row) is not easy to capture and leads to results sim- analysis until a few weeks after the prediction date.
ilar to those obtained with an entirely climatological Two comments can be made in this regard. First,
forcing. this result highlights the importance of the initial-
The Brier Scores (Fig. 4) improve with elevation, ization, since the snowpack can keep memory of
since larger snow accumulations make it easier to its past state during several days, as the statistical
reach a given snow height threshold faster in the scores presented in this work clearly show. Sec-
season. Similarly, for a given elevation scores im- ond, this result also indicates that, regardless of the
prove when the snow height threshold is reduced. initial conditions and the date of the prediction, me-
Looking at the performances of the ensembles, the teorological conditions are the main driver of snow
graphics clearly show the improved skill of the pre- conditions in mountain regions beyond a lead-time
diction system in which the simulations are initial- of a few weeks. This is not surprising but quan-
ized with the analyzed snow height (cyan curves) titatively demonstrates that medium-range predic-
compared to the skill of reanalysis alone (black tions of natural snow conditions will mostly improve
curves). Indeed, the Brier Scores of the reanalysis through improvements in meteorological forecast.
are always worse (higher) then those obtained with Indeed, we found that using a numerical weather
an initialization of the snow conditions and this dif- prediction product with a 4 day lead-time (PEARP)
ference remains as long as the snowpack builds up improves the scores with respect to a simple clima-
and diverges from the climatological behavior. The tological forcing, and this despite the main known
benefit of using PEARP during 4 days (red curves) limitations affecting the PEARP product, i.e. an
is small, because, as explained in Sect. 2.6, the under-dispersion of the ensemble and a relative un-
scores are calculated for each initialization date by derestimation of the forecast probabilities of snow-
aggregating results for all lead-times, and the ef- fall (Vernay et al., 2015).
508Figure 3: Rank Diagrams for the season 2017/2018 at 4 elevations at Les Saisies ski-resort. Please note that the vertical scales are different to better
highlight the shapes of the diagrams. The configurations R, A’ and B’ are explained in Fig. 1.
509
Proceedings, International Snow Science Workshop, Innsbruck, Austria, 2018
Figure 4: Brier Scores for the season 2017/2018 at 4 elevations at Les Saisies ski-resort. Scores are computed for different initialization dates accounting
for the remainder of the snow season. Three snow height thresholds are considered: 0.25, 0.5 and 1.0m. Please note that the vertical scales are different
to better highlight the shapes of the curves. The configurations R, A’ and B’ are explained in Fig. 1.Proceedings, International Snow Science Workshop, Innsbruck, Austria, 2018
ity of the conclusions reached by Morin et al. (2013).
Third, in addition to the climatological forcing, we
have introduced the use of an ensemble weather
forecast product, allowing to take into account pre-
dicted conditions for the first 4 days after the initial-
ization. We have demonstrated that this improve-
ment, by explicitly accounting for the meteorological
situation and its potential development into the fu-
ture, extends the time frame over which the forecast
system has a predictive power superior to the clima-
tological data.
Several additional developments are currently in
progress to corroborate and refine the results of this
study. First, other NWP products will be seamlessy
integrated into a fully-fledged modeling chain to ex-
tend the meteorological forecast period, combining
different progressively increasing lead-times up to
the seasonal scale. In particular, the Ensemble
Prediction System (EPS) probabilistic forecast de-
veloped at the European Center for Medium-range
Weather Forecast (ECMWF) will be used until lead-
times of 15 days. To assess the added-value of sea-
sonal forecast over climatologically-based predic-
tion for lead-times beyond 15 days, the Copernicus
Climate Change - Seasonal Prediction (C3S-SP)
system will be added to the modeling chain. Sec-
ond, the snow management practices (grooming,
snowmaking) will be explicitly accounted for in the
snowpack simulations (Hanzer et al., 2014; Span-
dre et al., 2016; Hanzer et al., 2018), to represent
the actual state of the snow on the ski slopes. And
third, daily measurements of water consumption for
snowmaking and snow height on the ski slopes will
be integrated into the chain to adjust the snow con-
ditions at the initial step of the prediction to field ob-
servations.
All these combined developments will make it
possible to build up the PROSNOW real-time op-
erational chain, which will help ski-resort operators
to improve the snow management through a better
anticipation of the weather and snow conditions on
Figure 5: CRPS and CRPSS for the season the slopes.
2017/2018 at 4 elevations at Les Saisies ski-resort.
The configurations R, A’ and B’ are explained in Fig.
1. ACKNOWLEDGEMENTS
This project has received funding from the Euro-
Our modeling framework was inspired by the ap- pean Union’s Horizon 2020 research and innovation
proach developed by Morin et al. (2013), which has programme under grant agreement No 730203.
been refined and extended here through 3 main im-
provements. First, the statistical analysis introduced
by Morin et al. (2013) has been improved using REFERENCES
more complex statistical metrics, in order to fully ac-
count for the spread between ensemble members. Brier, G. W.: Verification of forecasts expressed in terms of prob-
Second, the work of Morin et al. (2013) was limited ability, Monthly Weather Review, 78, 1950.
Brown, T. A.: Admissible scoring systems for continuous distri-
to only one point at 2400m in the Mont-Blanc mas-
butions, Hydrol. Earth Sys. Sci., 12, 1974.
sif, whereas here we have performed simulations at Courtier, P., Freydier, C., Geleyn, J.-F., Rabier, F., and Rochas,
different elevations, thereby assessing the general- M.: The ARPEGE project at Météo-France, in: Proceedings
510Proceedings, International Snow Science Workshop, Innsbruck, Austria, 2018
of the 1991 ECMWF Seminar, pp. 193–231, Reading, U.-K.,
1991.
Descamps, L., Labadie, C., Joly, A., Bazile, E., Arbogast, P., and
Cébron, P.: PEARP, the Météo-France short-range ensemble
prediction system, Q. J. R. Meteorol. Soc., 2014.
Durand, Y., Giraud, G., Brun, E., Mérindol, L., and Martin, E.: A
computer-based system simulating snowpack structures as a
tool for regional avalanche forecasting, J. Glaciol., 45, 469–
484, 1999.
Hamill, T. M.: Interpretation of Rank Histograms for Verifying
Ensemble Forecasts, Hydrol. Earth Sys. Sci., 129, 550–560,
2000.
Hanzer, F., Marke, T., and Strasser, U.: Distributed, explicit mod-
eling of technical snow production for a ski area in the Schlad-
ming region (Austrian Alps), Cold Regions Science and Tech-
nology, 108, 113–124, 2014.
Hanzer, F., Bavay, M., Carmagnola, C., Ebner, P., Lafaysse, M.,
Lehning, M., Strasser, U., and Morin, S.: Simulating snow
conditions in ski resorts with the physically based snowpack
models AMUNDSEN, Crocus, and SNOWPACK/Alpine3D, in:
Proceedings ISSW Innsbruck, 2018.
Lafaysse, M., Morin, S., Coleou, C., Vernay, M., Serca, D.,
Besson, F., Willemet, J.-M., Giraud, G., and Durand, Y.: To-
wards a new chain of models for avalanche hazard forecast-
ing in French mountain ranges, including low altitude moun-
tains, in: Proceedings of International Snow Science Work-
shop Grenoble–Chamonix Mont-Blanc, pp. 162–166, CEN,
2013.
Morin, S., Lafaysse, M., Coleou, C., and Lejeune, Y.: On the
conditional predictability of snow conditions several weeks to
months in advance, in: Proceedings of the International Snow
Science Workshop Grenoble - Chamonix Mont-Blanc - 2013,
7-11 October, Grenoble, France, pp. 1171–1176, CEN, 2013.
Morin, S., Dubois, G., and The PROSNOW Consortium: PROS-
NOW: Provision of a prediction system allowing for manage-
ment and optimization of snow in Alpine ski resorts, in: Pro-
ceedings ISSW Innsbruck, 2018.
Pappenberger, F., Cloke, H. L., Persson, A., and Demeritt,
D.: HESS Opinions ”On forecast (in)consistency in a hydro-
meteorological chain: curse or blessing?”, Hydrology and
Earth System Sciences, 15, 2391–2400, 2011.
Spandre, P., François, H., Thibert, E., Morin, S., and George-
Marcelpoil, E.: Integration of snow management in a de-
tailed snowpack model, Cold Regions Science and Technol-
ogy, 125, 48–64, 2016.
Vernay, M., Lafaysse, M., Merindol, L., Giraud, G., and Morin, S.:
Ensemble forecasting of snowpack conditions and avalanche
hazard, Cold Regions Science and Technology, 120, 251–
262, 2015.
Vionnet, V., Brun, E., Morin, S., Boone, A., Martin, E., Faroux,
S., Moigne, P. L., and Willemet, J.-M.: The detailed snow-
pack scheme Crocus and its implementation in SURFEX v7.2,
Geosci. Model. Dev., 5, 773–791, 2012.
511You can also read