Impacts of Urbanization on Extreme Regional Precipitation Events
←
→
Page content transcription
If your browser does not render page correctly, please read the page content below
Hindawi
Discrete Dynamics in Nature and Society
Volume 2021, Article ID 2210184, 17 pages
https://doi.org/10.1155/2021/2210184

Research Article
Impacts of Urbanization on Extreme Regional
Precipitation Events

 Wei Wu ,1 Lei Ren ,1 Yingjian Wei,2 and Mengjing Guo1
 1
 State Key Laboratory of Eco-hydraulics in Northwest Arid Region of China, Xi’an University of Technology, Xi’an 710048, China
 2
 Power China Kunming Engineering Corporation Limited, Kunming 650051, China

 Correspondence should be addressed to Lei Ren; 543491057@qq.com

 Received 18 June 2021; Accepted 4 August 2021; Published 12 August 2021

 Academic Editor: Daqing Gong

 Copyright © 2021 Wei Wu et al. This is an open access article distributed under the Creative Commons Attribution License, which
 permits unrestricted use, distribution, and reproduction in any medium, provided the original work is properly cited.
 Urbanization significantly impacts regional precipitation. In this study, using the city of Xi’an in China as a study area, we analyze
 the variation in land use and the characteristics of the variation in extreme precipitation events and discuss the response of
 urbanization to extreme precipitation. The main conclusions drawn are as follows. (1) The construction land area of the study area
 rapidly expanded in size from 80.76 km2 in 1984 to 400.3 km2 in 2018. The transfer of land use mainly occurred as the transfer
 from farmland to other types of land use. The urban land use intensity continues to increase. (2) The intensities and different
 frequency indices of extreme precipitations both show an increasing trend. In addition, the former exhibits periodic alternation
 with a dominant frequency of 21 years during the flood season, and both the fluctuation amplitude and maximum value of the
 periodic variation increase with time. (3) The urbanization in the study area has a significant impact on Rx1h and Rx2h
 precipitations, but little impact on the intensity of long-duration precipitation. Hence, urbanization significantly increases the
 intensity of extreme precipitation. After the 2000s, the urban building area, rainfall frequency, and rainfall intensity growth trends
 are highly consistent.

1. Introduction heat, and its surface heat is released mainly in the form of
 sensible heat. In addition, large quantities of heat are re-
Urbanization is rapidly occurring across the world, and the leased as a result of high energy consumption (e.g., air
global urban population is predicted to increase by 2.5 conditioning and transportation). As a result, the urban
billion by 2050 [1]. Increasing urban population can directly surface temperature is remarkably higher than that of the
lead to enlarged urban construction areas and changes in corresponding underlying natural surface [4, 5]. These
land use types, which can further alter the physical prop- factors make precipitation more likely to occur in urban
erties of the underlying urban surface and greatly affect the areas, known as the rain island effect [6, 7].
characteristics of regional hydrological circulation [2, 3]. Thunderstorms are more likely to occur in urban areas than
Additionally, given the clustering trends of population and in suburban areas [8, 9]. The mechanisms of the impact of
industry, different artificial heat sources, carbon sources, and urbanization on precipitation mainly include the urban heat
pollutant emissions directly affect the chemical and physical island effect, underlying surface changes, and aerosol emis-
properties of the atmosphere, which can lead to changes in sions. Heat island circulation weakens the stability of the urban
the movement state of near-surface matter and energy in atmosphere, which significantly promotes the formation of
local urban areas and over an even larger range and have convective weathers such as thunderstorms, heavy precipita-
complex effects on a series of meteorological and hydro- tion, and strong storms, and changes the dynamic structures of
logical elements, including wind fields, temperature, pre- clouds and storms, leading to extreme events of enhanced
cipitation, evapotranspiration, and runoff. The urban intensity as a result of the strengthened convection in
interior is characterized by low water content and low latent downwind urban areas [10]. In addition, the gravitational
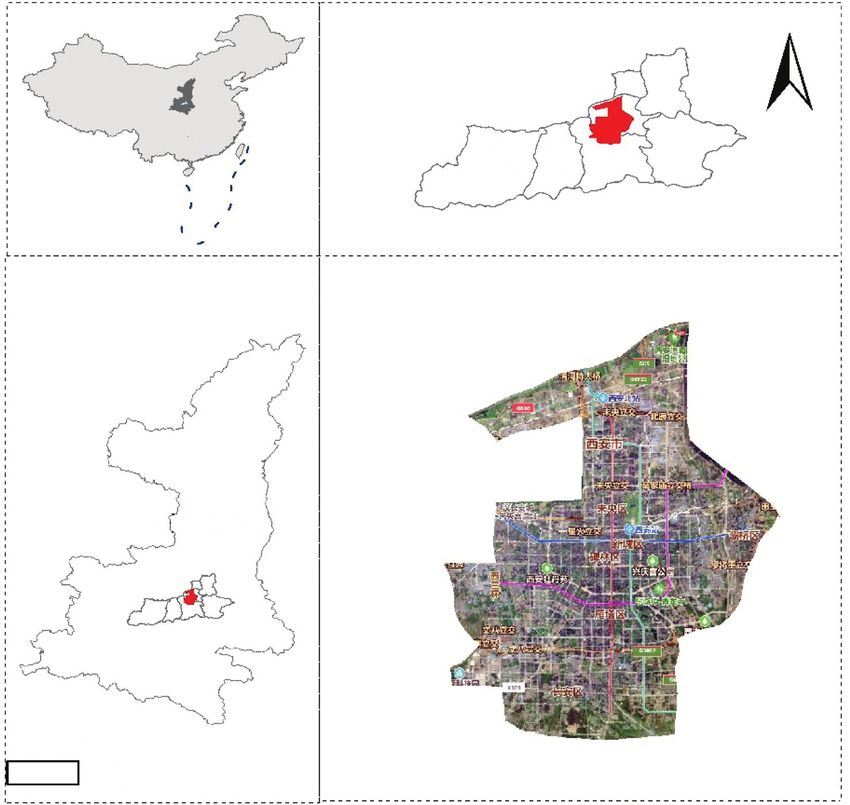
2 Discrete Dynamics in Nature and Society

waves induced by the urban heat island effect can cause the 2. Overview of the Study Area
airflow to ascend in downwind urban areas, which can easily
trigger and strengthen moist convection, causing extreme In this study, we chose the city of Xi’an in China as our study
precipitation events in some urban and downwind areas [11]. area (Figure 1). Xi’an is located in central China between
Changes in the underlying urban surface can reduce the near- 108°46′–109°5′E and 34°11′–34°22′N, with a total area of
surface air humidity, which further leads to decreases in 10,100 m2. The study area is in a warm-temperature zone
evapotranspiration and precipitation in summer [12]. Aerosols with a semihumid continental monsoonal climate. It is
such as smoke dust over urban areas are also conducive to the characterized by well-delineated seasons regarding humidity
formation of clouds and thus rain [13, 14], but the impact of and temperature and by unevenly distributed seasonal
aerosols on precipitation is influenced by many factors such as precipitation. More than 80% of the precipitation occurs
climate and geography and thus is highly uncertain [15–18]. during flood season, and the amount of precipitation from
 The impact of urbanization on precipitation can be July to September accounts for more than half of the annual
assessed by two methods: data analysis and numerical precipitation. In recent years, heavy, short-duration pre-
simulation [19]. The data analysis method compares the cipitation has occurred multiple times and resulted in severe
different precipitation elements in the urban area and the urban waterlogging. The study area has experienced rapid
adjacent suburban or rural areas at different positions and urbanization. As a result, the original natural vegetation and
uses the obtained difference as the main index for assessing farmlands are now covered by impermeable surfaces,
the level of the impact of urbanization on precipitation. This resulting in significant changes to the underlying surface.
method falls into two categories: station data analysis and Currently, the types of urban land use mainly include res-
integrated remote sensing data analysis. The former requires idential lands, commercial lands, parklands, and education
the use of a series of long-duration precipitation observa- and research lands, which can fully reflect the urbanization
tions in both urban and rural areas and is limited by its poor process.
spatial coverage. In comparison, the latter can overcome the
limit on spatial coverage and improve the construction of 3. Data and Methodology
precipitation samples in both urban and background areas
[20, 21]. To investigate the impact of urbanization on pre- 3.1. Data. The land-use data of the study area are derived
cipitation, the numerical simulation method focuses on the from the Geospatial Data Cloud platform maintained by the
simulation of single-factor impacts and integrated impacts. China Academy of Sciences Computer Network Informa-
In the single-factor impact simulation, the impacts of the tion Center (http://www.gscloud.cn) as well as from Google
urban heat island, the underlying surface, and the aerosols Earth. The LANDSAT remote sensing image data of 1985,
are separately simulated and assessed. The most direct ap- 1990, 1995, 2000, 2005, 2010, 2015, and 2018, a span of 34
proach for the integrated impact simulation is to conduct years, which could represent the degree of urbanization of
control experiments with and without cities or with different the study area in different periods are selected. The reso-
scenarios of urban development [22–24]. In the numerical lution of the data is 30 m × 30 m. The image data were taken
simulation method, sensitivity analysis can be carried out by during April to August with the cloudiness controlled to
varying the model parameters to determine the impacts of within 5%.
different factors in the urbanization process. However, The hourly precipitation data of 1982 to 2018 of the Xi’an
numerical simulation results are usually of low accuracy station (S1) and Huxian station (S2) in the study area are
[24]. In contrast, the statistical data analysis method can selected. Since the surrounding regions of the S1 station
more accurately and directly assess the variation patterns of experienced urbanization after the 1980s, station S1 is used
urbanization and precipitation. as an urban precipitation observation station in the present
 Urbanization can alter the underlying surface properties study. The long-term variation in precipitation at this station
and the regional precipitation, both of which often lead to can be viewed as a representation of the local impact of
serious urban waterlogging problems [25, 26]. Thus, it is of urbanization on rainfall and the background fluctuations in
great importance to understand the impact of urbanization the regional climate. Thus, the precipitation data at station
on precipitation [27, 28]. Existing studies on this subject S1 are selected to analyze the impact of urbanization on the
mostly focus on analyzing daily precipitation data to obtain evolution of extreme precipitation events. In contrast, sta-
the trends of precipitation, while there is little research on tion S2 is located in a rural area that is barely impacted by
extreme precipitation events of short duration, which are urbanization. Thus, the precipitation variation at station S2
more likely to cause urban waterlogging [29, 30]. To address is considered to represent the natural variation due to cli-
this knowledge gap, the spatiotemporal patterns of urban mate change.
sprawl in the central urban area are investigated in the
present study based on the interpretation of remote sensing 3.2. Methodology
data, taking the city of Xi’an in China as a study area. In
addition, the pattern of the maximum of short-duration 3.2.1. Urbanization of Study Area. In this study, the different
precipitation in flood season is analyzed using the short- types of land-use data are categorized by using the ENVI
duration rainfall data of the urban area. Finally, the impact (Environment for Visualizing Images) software. Then, the
of urbanization on extreme precipitation events is discussed accuracy of the calculation results is evaluated to ensure that
through comparison. the accuracy is greater than 80% with a kappa coefficient
Discrete Dynamics in Nature and Society 3

 N

 Xi’ an

 ShaanXi

 9,750
 Miles

 Figure 1: Schematic diagram of the study area.

greater than 0.8. The land use within the study area is land use intensities. That is, in the analysis of the spatial
categorized into five types, namely, farmland, vegetation, correlations of land use intensities, Moran’s index is cal-
bare land, water body, and construction land. The spatio- culated to determine the spatial clustering of the land use
temporal evolution of the urban sprawl in the study is mainly intensities. Moran’s index I is in the range of [−1, 1]. I < 0,
analyzed in terms of the speed, direction, and intensity of the I � 0, and I > 0 indicate negative, no, and positive correla-
changes in urban land use. tions, respectively. The greater the I value is, the higher the
 Land use intensity can reflect both the depth and breadth spatial correlation and the clustering.
of urban land use and the intensity and development stages
of urbanization. In fact, increasing land use intensity is a
process during which the natural attributes of land are 3.2.2. Extreme Precipitation in the Study Area. In this study,
continuously changed as a result of human activities. There the extreme precipitation events are assessed in terms of
exist differences in the intensities of different land use types. intensity and occurrence frequency. The indices for the
In this study, the land use intensity is rated with a four-level extreme precipitation intensity include the maximum 1-
scale based on the natural equilibrium state of the natural hour precipitation intensity during flood season (Rx1h), the
land complex under the influence of social factors and maximum 2-hour precipitation intensity during flood sea-
assigned an index according to the rated level [31]. The son (Rx2h), the maximum 3-hour precipitation intensity
calculation equation is during flood season (Rx3h), the maximum 6-hour precip-
 itation intensity during flood season (Rx6h), the maximum
 4
 AI × S i 12-hour precipitation intensity during flood season (Rx12h),
 L � 100 × ,
 S and the maximum 24-hour precipitation intensity during
 I�1 (1)
 flood season (Rx24h), based on which a series of extreme
 L ∈ [100, 400], i � 1, 2, 3, 4, precipitation intensities of varying durations during flood
 season is selected using the annual maximum method. The
where L is the composite index for the land use intensity of indices of the extreme precipitation frequency mainly in-
an area, AI is the rating index of the intensity of the level i clude the number of heavy precipitation hours, the number
land use in the area, Si is the area of the level i land use in the of heavy-rain days, and the number of rainstorm days. The
area, and S is the total area of the land in the area. percentile threshold method is used to select the 99-per-
 The spatial autocorrelation analysis method (Moran’s centile hourly precipitation as the threshold value for the
index method) is used to analyze the spatial correlations of hourly heavy precipitation. In addition, the fixed-value
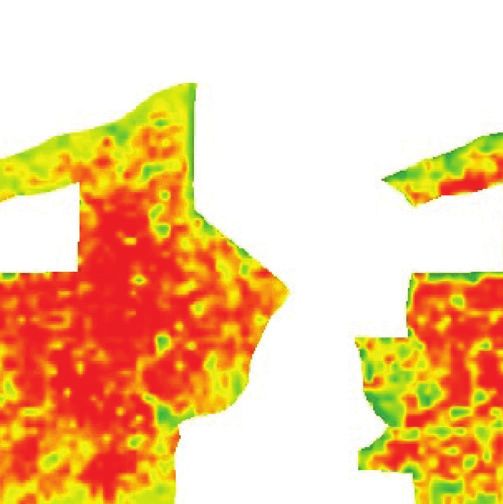
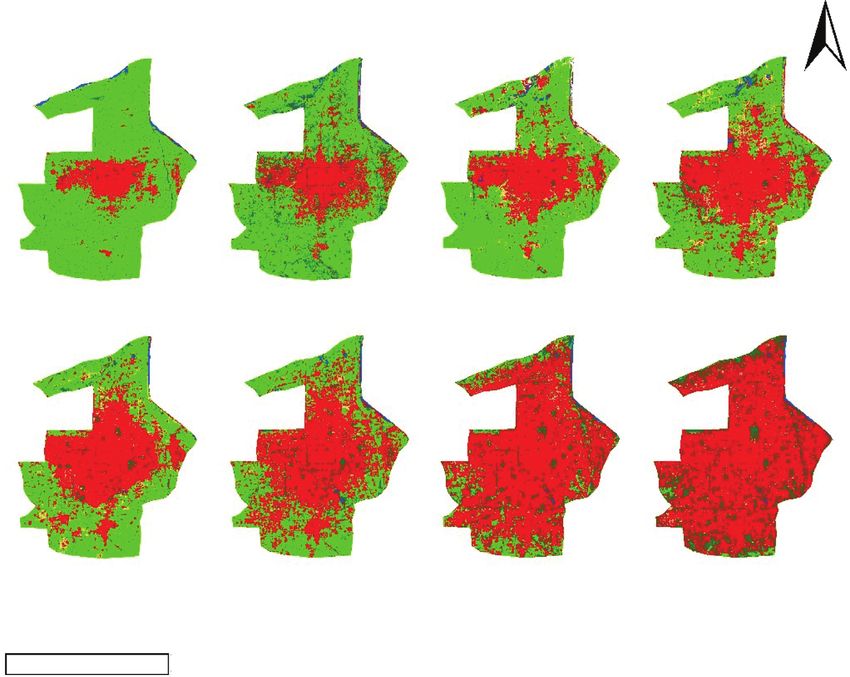
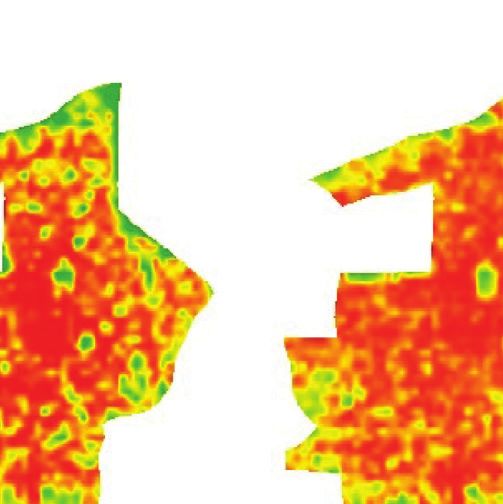
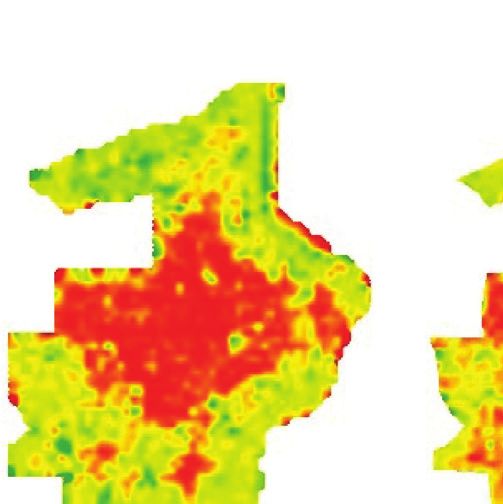
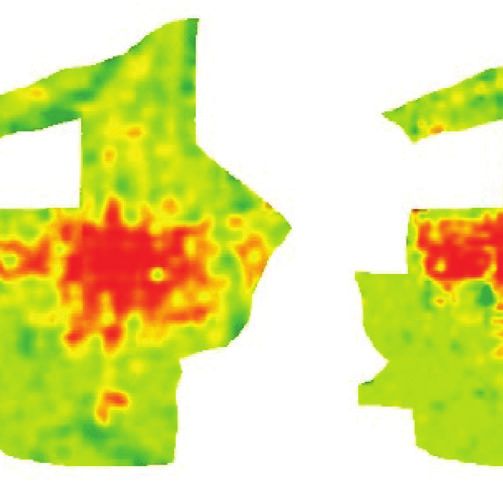
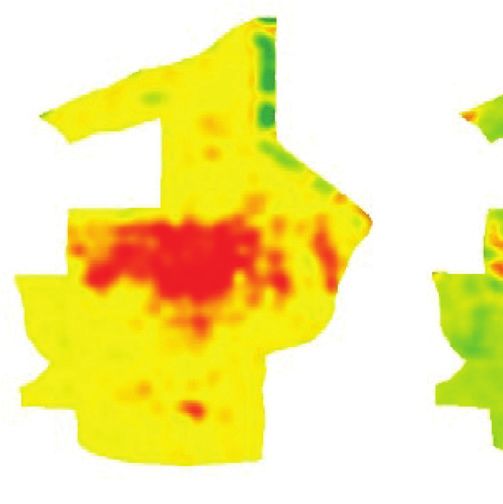
4 Discrete Dynamics in Nature and Society

method is employed to choose the rainstorm and heavy-rain lines for the intensities of extreme precipitation with dif-
values as the threshold values for calculating the numbers of ferent durations are all positive, showing an increasing trend
rainstorm days and heavy-rain days, respectively. The with fluctuations. The fluctuation peak continues to increase,
temporal series of the occurrence frequencies of extreme while the fluctuation valley does not vary significantly.
precipitation events is also selected (Table 1). The tendency Before the 1980s, the intensities of extreme precipitation
and abrupt change of the extreme precipitation events are with different durations were in a steady state with a small
analyzed using the Mann-Kendall (MK) nonparametric fluctuation range. After the 1980s, the fluctuations gradually
statistical test, and the periodic variations in extreme pre- intensified with an increasing difference in annual
cipitation events are examined using the wavelet analysis precipitation.
method.
 5. Discussion
4. Results 5.1. Variations in Urban Land Use
4.1. Land-Use Distribution in Central Urban Area and Its 5.1.1. Variation Direction of Land Use in Central Urban Area.
Variation. Based on the interpretation of eight sets of re- The transformation matrix for the land use during different
mote sensing image data in the central urban area from 1984 periods is calculated by using the software ENVI, and then
to 2018, the area variation map (Figure 2) and the spatial the variation direction of land use is analyzed. The land-use
distribution variation map (Figure 3) for the land use in the transformation matrices for the early period (1990) and the
urban area are obtained. late period (2018), as given in Table 3, show that the
 The results show that the farmland area in the central transformation of land use in the central urban area of the
urban area of the study area varies the most significantly. study area mainly involves the transfer of farmland to other
Specifically, this area decreased from 441.05 km2 in 1984 to types of land use, while the transfers between other types of
6.18 km2 in 2018, and the corresponding percentage de- land use are not significant.
creased from 81.81% to 1.15%. In particular, farmland From 1990 to 2018, the farmland in the study area
showed the largest decrease from 2009 to 2015, with an area continuously decreased, with the proportion of its area
decrease of 148.05 km2, accounting for 27.46% of the total decreasing from 81.81% to 1.15%. The farmland was mainly
area. In comparison, the area of construction land increased transferred to construction land and vegetation, with
significantly from 80.76 km2 in 1984 to 400.03 km2 in 2018, transferred areas of 234.27 km2 and 84.71 km2, respectively.
with the corresponding percentage increasing from 14.98% Construction land was mainly transferred to vegetation with
to 74.25%. Additionally, the construction land area in- an area of 16.44 km2 that was probably related to human
creased the most significantly from 2009 to 2015, with an activities such as newly constructed park green spaces and
increase of 105.36 km2 or 19.54% of the total area. urban greening. Vegetation was mainly transferred to
 construction land with an area of 43.14 km2, while the areas
 of water bodies and bare land did not vary significantly.
4.2. Trends of Precipitation during Flood Season. The MK
 In general, the different types of land use in the central
nonparametric statistical test method is used to calculate the
 urban area of the study area all experienced transformation.
trends of the intensities and occurrence frequencies of ex-
 The descending order of the types of areas that were con-
treme precipitation with different durations in the study area
 verted to a different type of land use is farmland
(Table 2). The intensities of the extreme precipitations with
 (327.53 km2) > vegetation (45.06 km2) > construction land
different durations in the study area all exhibit an increasing
 (18.74 km2) > water bodies (7.66 km2) > bare land
trend. The Z-scores of the increases in the extreme pre- 2
 (0.59 km ). The descending order of the types of land use
cipitation intensities Rx1h, Rx12h, and Rx24h are all greater
 that areas were converted to is construction land
than 1.28 and pass the 90% significance test, and the cor-
 (283.23 km2) > vegetation (103.2 km2) > bare land (9.1 km2)
responding nonparametric Sen’s slopes are 1.06, 1.64, and
 > water bodies (3.26 km2) > farmland (0.91 km2).
2.16 mm/10a, respectively. The descending order of the
significance levels of the trends of the intensities of extr-
eme precipitation with different durations is Rx12h > 5.1.2. Characteristics of the Spatiotemporal Distribution of
Rx24h > Rx1h > Rx2h > Rx6h > Rx3h. The descending order Land Use in the Central Urban Area. The intensity of land
of the increases in the calculated intensities of precipitat- use reflects the breadth and depth of land use. A low in-
ion with different durations is Rx24h > Rx12h > Rx1h > tensity of land use in a region indicates a small impact from
Rx2h > Rx6h > Rx3h. In addition, different extreme pre- human activities on the natural environment in this region,
cipitation frequency indices exhibit increasing trends; the while a high intensity of land use mirrors the impact of
number of 99-percentile heavy precipitation hours shows a human activities on the natural attributes of the land,
significant increasing trend with a Z-score of 1.79, which resulting in changes in the physical properties of the un-
passes the 95% significance test with an increase of 0.29 h/ derlying surface.
10a. The central urban area of the study area is divided into
 The long-term variations in the intensity of extreme grids with equal spacing using the software ArcGIS, resulting
precipitation in the study area are statistically analyzed in a total of 2280 grids with a spatial resolution of
(Figure 4). The results show that the slopes of the fitted trend 500 m × 500 m. Within each grid, the land use intensities are
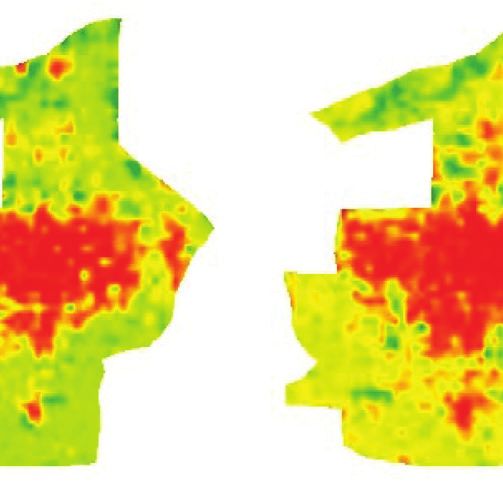
Discrete Dynamics in Nature and Society 5

 Table 1: Indices for extreme precipitation events and their definitions.
Extreme precipitation index Name Symbol Unit Definition
 Maximum 1-hour precipitation Maximum annual 1-hour precipitation during
 Rx1h mm
 intensity during flood season flood season
 Maximum 2-hour precipitation Maximum annual 2-hour precipitation during
 Rx2h mm
 intensity during flood season flood season
 Maximum 3-hour precipitation Maximum annual 3-hour precipitation during
 Rx3h mm
 intensity during flood season flood season
Extreme precipitation intensity
 Maximum 6-hour precipitation Maximum annual 6-hour precipitation during
 Rx6h mm
 intensity during flood season flood season
 Maximum 12-hour precipitation Maximum annual 12-hour precipitation during
 Rx12h mm
 intensity during flood season flood season
 Maximum 24-hour precipitation Maximum annual 24-hour precipitation during
 Rx24h mm
 intensity during flood season flood season
 Number of hours during which hourly
 Number of heavy precipitation hours R99p h precipitation is greater than the 99-percentile
 threshold value
Extreme precipitation frequency Number of days during which daily precipitation
 Number of heavy-rain days R25mm d
 is greater than 25 mm
 Number of days during which daily precipitation
 Number of rainstorm days R50mm d
 is greater than 50 mm

 500

 0.8

 Percentage of construction land area
 400

 0.6
 300
 Area/Km2

 0.4
 200

 100 0.2

 0 0.0
 1985 1990 1995 2000 2005 2010 2015 2018
 Year
 Farmland Water
 Vegetation Construction land
 Bare land

 Figure 2: Variations in land use and coverage area in the central urban area of the study area.

calculated, and a spatial interpolation analysis is conducted In the low-value regions, the types of land use include
on the varied intensities of land use in different periods by farmland, vegetation, water bodies, and bare land. The
the Kriging interpolation method, from which the spatial spatial shrinkage of the distributed area of the low-value
distribution of the land use intensities in the central urban regions is mainly related to the decrease in the farmland area
area of the study area during different periods is obtained and the increase in the construction land area. At the initial
(Figure 5). stage of the study period, the low-value regions were mainly
 The results show that the expansion of regions with high- distributed in the suburban area. As urbanization pro-
intensity land use in the central urban area of the study area gressed, the construction land encroached on the farmland
is consistent with the variation in the area of construction and vegetation and, as a result, the land use intensity of the
land. At the beginning of the study period, the high-value suburban area increased.
regions were mainly clustered in the old town with a planar The Moran’s index method is used to analyze the spatial
distribution pattern. Due to the impact of urbanization, correlation model of land use intensities in the central urban
these high-value regions started to expand with the con- area of the study area from 1984 to 2018 (Figure 6). The
struction land toward the south and north until the entire calculation results show that the Moran’s indices of the land
area was covered, exhibiting a multipoint expansion pattern. use intensities are all greater than zero from 1984 to 2018,
6 Discrete Dynamics in Nature and Society

 N

 1985 1990 1995 2000

 2005 2010 2015 2018

 25
 KM

 Construction land Vegetation
 Water Bare land
 Farmland
 Figure 3: Spatial distribution of land use in the central urban area of the study area from 1984 to 2018.

 Table 2: MK tests and slopes of indices of extreme precipitation in the central urban area of the study area.
Extreme precipitation index Z-score Variation magnitude of nonparametric Sen’s Confidence level (%)
Rx1h 1.29 1.06 (mm/10a) >90
Rx2h 1.02 0.95 (mm/10a)
Discrete Dynamics in Nature and Society 7

 120 120

 12-hour precipitation intensity

 24-hour precipitation intensity
 100 100

 80 80

 60 60

 40 40

 20 20

 1960 1970 1980 1990 2000 2010 1960 1970 1980 1990 2000 2010
 Year Year
 Trendline Trendline
 100
 100
 3-hour precipitation intensity

 6-hour precipitation intensity
 80
 80
 60
 60
 40
 40
 20
 20
 0
 1960 1970 1980 1990 2000 2010 1960 1970 1980 1990 2000 2010
 Year Year
 Trendline Trendline
 70 100
 1-hour precipitation intensity

 2-hour precipitation intensity

 60
 80
 50

 40 60

 30 40
 20
 20
 10

 0 0
 1960 1970 1980 1990 2000 2010 1960 1970 1980 1990 2000 2010
 Year Year
 Trendline Trendline
 Figure 4: Trends of intensities of extreme precipitation with different durations.

urbanization started gaining attention. This transfer re- use increased each year, with an increasing trend con-
flects the transformation from low to low/medium land sistent with the variation in construction land. The
use intensities. proportions of medium/high-intensity and medium-intensity
 To further analyze the characteristics of the land use land fluctuated and decreased with time. The variations in
intensities and their variations over different periods, the the other levels of land use intensities were not pro-
land use intensities are classified into the following levels: nounced. The land use intensities in the central urban area
low-intensity land use (L ≤ 200), low/medium-intensity of the study area varied considerably in different periods.
land use (200 < L ≤ 250), medium-intensity land use That is, the land use intensities were dominated by me-
(250 < L ≤ 300), medium/high-intensity land use (300 < L dium/high-intensity land use from 1984 to 2005 and by
 ≤ 350), and high-intensity land use (350 < L ≤ 400). The high-intensity land use from 2005 to 2018, thus reflecting
proportions of the different land use intensity levels in the changes in the dominant types of land use in different
different periods are calculated and presented in Figure 8 periods. Overall, the land use intensities of the entire study
using histograms in terms of frequency counts. The results area transformed with time from low-intensity to high-
show the following. The proportion of high-intensity land intensity land use.
8 Discrete Dynamics in Nature and Society

 Table 3: Transformation matrix of land use in the central urban area of the study area from 1990 to 2018.
 2018
Land use type 1990
 Construction land Water bodies Bare land Farmland Vegetation Total
 Area 116.98 0.90 1.27 0.14 16.44
Construction land Transfer rate (positive) 86.19 0.66 0.94 0.10 12.11 135.72
 Transfer rate (negative) 29.24 17.36 13.97 2.20 13.86
 Area 5.43 1.93 0.12 0.08 2.04
Water body Transfer rate (positive) 56.60 20.07 1.24 0.84 21.26 9.59
 Transfer rate (negative) 1.36 37.12 1.30 1.30 1.72
 Area 0.40 0.11 0.01 0.00 0.08
Bare land Transfer rate (positive) 66.87 18.21 1.79 0.00 13.13 0.60
 Transfer rate (negative) 0.10 2.12 0.12 0.00 0.07
 Area 234.17 1.86 6.87 5.27 84.71
Farmland Transfer rate (positive) 70.36 0.56 2.06 1.58 25.45 332.80
 Transfer rate (negative) 58.54 35.90 75.35 85.19 71.41
 Area 43.14 0.39 0.84 0.69 15.36
 Transfer rate (positive) 57.05 0.52 1.12 0.91 20.31
Vegetation 60.43
 Transfer rate (negative) 10.79 7.51 9.26 11.18 12.95
 Total 400.02 5.19 9.11 6.18 118.62

 1985 1990 1995 2000

 2005 2010 2015 2018

 VALUE N
 25 400
 KM
 100

 Figure 5: Spatial distribution of land use intensities in the central urban area of the study area from 1984 to 2018.

5.2. Trends of Intensity and Frequency of Precipitation with (Figure 10). The results show the following. The evolution
 Different Durations processes of extreme precipitation with different durations
 in the study area mainly exhibit two patterns of periodic
5.2.1. Periodic Characteristics of Intensities of Precipitation variation, that is, a period of 12 to 16 years and a period of 20
with Different Durations during Flood Season. The periodic to 25 years. The time scale of 12 to 16 years shows strong
trends of the intensities of precipitation with different du- characteristics of periodic alternations, with a central scale of
rations during flood season are calculated by wavelet approximately 15 years. In comparison, the time scale of 20
analysis, and the contours of the real parts of the calculated to 25 years exhibits strong characteristics of positive and
wavelet coefficients are plotted in Figure 9. The wavelet negative alternations and significant phase shifts, with a
variance is calculated based on the wavelet coefficients central scale of approximately 21 years. The dominant
Discrete Dynamics in Nature and Society 9

 0.80

 0.75

 Moran’s I index
 0.70

 0.65

 0.60

 0.55

 0.50
 1985 1990 1995 2000 2005 2010 2015 2018
 Year
 Moran’s I index
 Figure 6: Variation in Moran’s index in the central urban area of the study area.
 Average regional land use intensities

 360

 Standard deviation of regional
 52
 350

 land use intensities
 48
 340
 44
 330
 40
 320
 36
 310
 32
 1985 1990 1995 2000 2005 2010 2015 2018
 Year
 Average regional land use intensities
 Standard deviation of regional
 land use intensities
 Figure 7: Statistics of land use intensities in the central urban area of the study area.

periods of intensities of extreme precipitation with different intensities of Rx1h and Rx2h have been increasing since the
durations are basically the same, i.e., variation characteristics 1980s. Abrupt changes occurred for the Rx3h and Rx6h
with a period of 21 years are present. The wavelet coefficients precipitation intensities in 1960 and 2015, respectively, with
of the dominant periods of the intensities of precipitation a relatively low significance, and the variations before and
with different durations are analyzed, and it is found that the after the abrupt change in 2015 are consistent with those of
periodic variations intensified with time, exhibiting higher Rx1h and Rx2h. The Uf curves of Rx3h and Rx6h further
fluctuation magnitudes and larger peaks, which is consistent show that both indices experienced a process of first steady
with the actual fluctuations in the precipitation intensity fluctuation, then increased by small magnitudes, and finally
series. significantly increased. Thus, their overall variation trends
 are characterized by insignificant increases. Rx12h and
 Rx24h experienced multiple insignificant abrupt changes,
5.2.2. Abrupt Changes in Intensities of Precipitation with indicating that there were large fluctuations in the data series
Different Durations during Flood Season. The MK non- during this time period.
parametric test is conducted to analyze the abrupt changes in
the intensities of the precipitation with different durations
(Figure 11). The results show the following. There were 5.3. Impacts of Urbanization on Extreme Precipitation.
abrupt changes in the intensities of the precipitation with The precipitation in the city and its neighboring areas is the
different durations, but the significances of these abrupt result of the combined effect of regional climate background
changes are relatively low. In particular, the variations in conditions and urbanization process. Analyzing the rela-
Rx1h and Rx2h were relatively consistent, and they expe- tionship between urban and rural stations can strip the
rienced abrupt changes in 2015, mainly undergoing in- impact of climate change on extreme precipitation and
creases from small-magnitude to large-magnitude determine the law of impact of urbanization on extreme
fluctuations. The Uf curves further indicate that the precipitation. The process of urbanization can also be
10 Discrete Dynamics in Nature and Society

 600
 1200 Low Low/medium Medium Medium/high High Low Low/medium Medium Medium/high High
 0.00% 0.09% 23.72% 60.11% 13.90% 0.00% 2.13% 40.29% 44.07% 14.44%
 1000 500

 800 400
 Frequency

 Frequency
 600 300

 400 200

 200 100

 0 0
 200 250 300 350 400 200 250 300 350 400
 Intensity index (A) Intensity index (B)
 600
 Low Low/medium Medium Medium/high High Low Low/medium Medium Medium/high High
 800 0.09% 1.64% 29.10% 49.36% 18.08%
 500

 600 400
 Frequency

 Frequency
 300
 400
 200
 200
 100

 0 0
 200 250 300 350 400 200 250 300 350 400
 Intensity index (C) Intensity index (D)
 300
 Low Low/medium Medium Medium/high High Low Low/medium Medium Medium/high High
 500 0.19% 2.40% 22.08% 41.58% 28.79% 0.00% 1.64% 11.68% 43.49% 42.20%
 250
 400
 200
 Frequency

 Frequency

 300
 150
 200 100

 100 50

 0 0
 200 250 300 350 400 180 200 220 240 260 280 300 320 340 360 380 400
 Intensity index (E) Intensity index (F)

 350
 Low Low/medium Medium Medium/high High 300 Low Low/medium Medium Medium/high High
 300 0.00% 2.62% 10.97% 26.74% 53.58% 0.04% 4.49% 11.91% 27.14% 56.46%

 250
 250
 200
 Frequency

 Frequency

 200

 150 150

 100 100

 50 50

 0 0
 200 250 300 350 400 200 250 300 350 400
 Intensity index (G) Intensity index (H)
 Figure 8: Histograms of frequency counts of land use intensities in the central urban area of the study area from 1984 to 2018.
Discrete Dynamics in Nature and Society 11

 30 30

 Time scale/year 25 25

 Time scale/year
 20 20

 15 15

 10 10

 5 5

 1959 1968 1977 1987 1996 2005 2015 1959 1970 1981 1992 2004 2015
 1hour rainfall intensity 2hour rainfall intensity

 30 30

 25 25
 Time scale/year

 Time scale/year
 20 20

 15 15

 10 10

 5 5

 1959 1968 1977 1987 1996 2005 2015 1959 1968 1977 1987 1996 2005 2015
 3hour rainfall intensity 6hour rainfall intensity

 30 30

 25 25
 Time scale/year

 Time scale/year

 20 20

 15 15

 10 10

 5 5

 1959 1968 1977 1987 1996 2005 2015 1959 1968 1977 1987 1996 2005 2015
 12hour rainfall intensity 24hour rainfall intensity
Figure 9: Contour plots of the real parts of the wavelet coefficients of the intensities of the precipitation with different durations in the study
area from 1959 to 2018.

characterized by changes in urban building area. Therefore, (Table 4). The results show the following. There are differ-
in order to discuss the impact of urbanization on rainfall, on ences between the variation trends of the intensities of
the one hand, we analyzed the characteristics of long-term extreme precipitation with different durations at station S2.
rainfall changes in urban and rural stations; on the other In particular, Rx1h and Rx3h exhibit insignificant decreasing
hand, we analyzed the changes in urban building area and trends and low confidence levels, with decreases of −0.007
rainfall trends. and −0.03 mm/10a, respectively. Rx2h, Rx6h, Rx12h, and
 Rx24h show insignificant increasing trends and low confi-
 dence levels, with increases of 0.003, 0.01, 0.15, and 0.05 mm/
5.3.1. Analysis of Precipitation Changes in Urban and Rural 10a, respectively. In addition, the number of days of pre-
Stations. The MK nonparametric statistical test is conducted cipitation above the level of heavy rain has a Z-score of zero
to obtain the variations in the intensities and frequencies of and has a variation trend. The number of days of rainfall
extreme precipitation with different durations at station S2 above the level of rainstorm and the number of hours of
12 Discrete Dynamics in Nature and Society

 5
 1.2
 Wavelet variance 4 1.0

 Wavelet variance
 0.8
 3
 0.6
 2
 0.4

 1 0.2

 0.0
 0
 0 5 10 15 20 25 30 0 5 10 15 20 25 30 35
 Time Scale/Year Time Scale/Year
 1hour precipitation intensity wavelet variance 2hour precipitation intensity wavelet variance
 curve curve

 8 1.2
 Wavelet variance

 Wavelet variance
 6 0.9

 4 0.6

 2 0.3

 0 0.0
 0 5 10 15 20 25 30 35 0 5 10 15 20 25 30 35
 Time Scale/Year Time Scale/Year
 3hour precipitation intensity wavelet variance 6hour precipitation intensity wavelet variance
 curve curve

 1.0 1.0

 0.8 0.8
 Wavelet variance

 Wavelet variance

 0.6 0.6

 0.4 0.4

 0.2 0.2

 0.0 0.0
 0 5 10 15 20 25 30 0 5 10 15 20 25 30 35
 Time Scale/Year Time Scale/Year
 12hour precipitation intensity wavelet variance 24hour precipitation intensity wavelet variance
 curve curve
Figure 10: Plots of the wavelet variances of the intensities of precipitation with different durations in the study area from 1959 to 2018.

extreme precipitation exhibit an insignificant increasing (Figure 12). The results show that the inflection points of the
trend and a low confidence level, and no variation is detected slopes of the double cumulative curves of Rx1h and Rx2h
using the nonparametric Sen’s method. That is, the variation both appear in 1989. Prior to 1989, the intensities of the
trends of the intensities and frequencies of the extreme extreme precipitation at the urban and rural stations were
precipitation at station S2 are insignificant under natural basically consistent. After 1989, the extreme precipitation at
conditions. the urban station became higher than that at the rural
 The double accumulative curve method is used to an- station. There is minimal variation in the slopes of the
alyze the variations in the intensities of the precipitation with double cumulative curves of the other extreme precipitation
different durations at stations S1 and S2 from 1982 to 2018 intensity indices, indicating that the urbanization in the
Discrete Dynamics in Nature and Society 13

 3
 3
 1-hour extremum statistics 2

 2-hour extremum statistics
 2
 1
 1
 0
 0

 -1 -1

 -2 -2

 -3 -3
 1960 1970 1980 1990 2000 2010 1960 1970 1980 1990 2000 2010
 Year Year

 Uf Uf
 Ub Ub
 3 3
 3-hour extreme value statistics

 6-hour extreme value statistics
 2 2

 1 1

 0 0

 -1 -1

 -2 -2

 -3 -3
 1960 1970 1980 1990 2000 2010 1960 1970 1980 1990 2000 2010
 Year Year

 Uf Uf
 Ub Ub
 3 3
 12-hour extreme value statistics

 24-hour extreme value statistics

 2 2

 1 1

 0 0

 -1 -1

 -2 -2

 -3 -3
 1960 1970 1980 1990 2000 2010 1960 1970 1980 1990 2000 2010
 Year Year

 Uf Uf
 Ub Ub
 Figure 11: Abrupt changes in intensities of precipitation with different durations in the study area from 1959 to 2018.

study area has a large impact on short-duration precipitation means, variances, and maximums of Rx1h and Rx2h are
but minimal impact on long-duration precipitation. statistically analyzed (Table 5). The statistical indices of Rx1h
 To further clarify the differences in the extreme pre- at the Xi’an station after 1989 are all higher than those in the
cipitation before and after urbanization, the year of 1989 is former time period, specifically, the mean, variance, and
used as a node to divide the series of extreme precipitation in range of Rx1h in the latter time period are 7.09 mm/h,
the study area into two time periods, namely, 1959 to 1989 5.74 mm/h, and 27.3 mm/h, respectively, higher than those
and 1989 to 2018, based on which the variations in the in the former time period. The mean, variance, and range of
14 Discrete Dynamics in Nature and Society

 Table 4: MK tests and slopes of indices of extreme precipitation in the rural area of the study area.
Extreme precipitation index Z-score Variation magnitude of nonparametric Sen’s Confidence level (%)
Rx1h −0.5 −0.07 (mm/10a)
Discrete Dynamics in Nature and Society 15

 Table 5: Statistical indices of extreme precipitation before and after urbanization in the study area.
 Rx1h Rx2h
Statistical index
 1959–1989 1989–2018 1959–1989 1989–2018
Mean 18.38 25.47 24.05 31.82
Variance 8.3 14.04 9.63 19.5
Maximum 35.9 63.2 49.1 92.4

 450 70

 400
 60
 350
 50
 Construction land (km2)

 300

 Precipitation intensity
 250 40

 200 30

 150
 20
 100
 10
 50

 0 0
 1985 1990 1995 2000 2005 2010 2015 2020
 Year
 Construction land
 Precipitation intensity
 Figure 13: Construction land and precipitation intensity trend in the study area.

 450 7

 400
 6
 350
 Frequencies of precipitation

 5
 Construction land (km2)

 300

 250 4

 200 3

 150
 2
 100
 1
 50

 0 0
 1985 1990 1995 2000 2005 2010 2015 2020
 Year

 Construction land
 Frequencies of precipitation
 Figure 14: Construction land and frequencies of precipitation trend in the study area.
16 Discrete Dynamics in Nature and Society

Rx2h at the Xi’an station in the latter time period are (3) The urbanization in the study area had a large impact
7.75 mm/h, 9.87 mm/h, and 43.2 mm/h higher than those in on the Rx1h and Rx2h precipitation starting in 1989,
the former time period. Thus, the variances and ranges of while it had minimal impact on the precipitation
both Rx1h and Rx2h increase after urbanization, and the with long duration. The mean, variance, and range of
increase in the maximum of the extreme precipitation in- Rx1h after urbanization are 7.09 mm/h, 5.74 mm/h,
tensities leads to an increase in the peak values in the time and 27.3 mm/h higher, respectively, than those be-
series with increasing variation magnitudes, thus resulting in fore urbanization. The mean, variance, and range of
an increase in the variances of the extreme precipitation Rx2h are 7.75 mm/h, 9.87 mm/h, and 43.2 mm/h
series as well as in the fluctuation magnitude. higher, respectively, in the former time period.
 Hence, urbanization has a significant amplification
 effect on the increase in the intensity of extreme
 precipitation. With the development of urbaniza-
5.3.2. Test of the Differences between the Precipitation at the
 tion, regional rainfall intensity and rainfall frequency
Representative Urban and Rural Stations. The impact of
 have increased rapidly. After the 2000s, the growth
urbanization on rainfall is characterized by the trend of
 trend of urbanization process, rainfall intensity, and
urban area and rainfall characteristics (Figures 13 and 14).
 rainfall frequency is highly consistent.
From the 1980s to the present, the construction area, rainfall
intensity, and frequency of rainfall above 10 mm in the study
area have all shown an increasing trend. From 1980s to Data Availability
2000s, the increase in rainfall frequency and rainfall intensity The data used to support the findings of this study are
was less than the growth trend of building area; after 2000s, available from the corresponding author upon request.
the rainfall frequency, rainfall intensity, and building area all
increased rapidly, and the growth trends of the three tended
to be consistent.
 Conflicts of Interest
 The authors declare that they have no conflicts of interest.

6. Conclusion Acknowledgments
In this study, we analyzed the patterns of land use and the This work was supported by the National Natural Science
characteristics of extreme precipitation during the urbani- Foundation of China (project nos. 51979222 and 41807156)
zation process, using the city of Xi’an in China as a study and the Water Science and Technology Foundation of
area. On this basis, we discussed the response of urbani- Shaanxi Province of China (no. 2017slkj-13).
zation to extreme precipitation. The main conclusions are
summarized as follows: References
 (1) During the urbanization of the study area, the
 [1] World Urbanization Prospects, United Nations Department
 farmland area sharply decreased in size, the con- of Economic and Social Affairs, 2019.
 struction land area rapidly expanded, and the veg- [2] N. Harman, The Energy Balance of Urban Areas, University of
 etation area increased and fluctuated. The transfer of Reading, Reading, UK, 2003.
 land use in the central urban area occurred mainly as [3] J. Cheng, Effects of Land Use and Land Cover Change on
 the transfer of farmland to other types of land use, Environmental Hydrology in the Center Urban Area of
 while the transfers between other types of land use Shanghai, East China Normal University, Shanghai, China,
 were not significant. The intensities of land use in the 2007.
 central urban area continuously increased. [4] S. Grimmond, “Urbanization and global environmental
 change: local effects of urban warming,” The Geographical
 (2) The intensities and frequency indices of the extreme Journal, vol. 173, no. 1, pp. 83–88, 2007.
 precipitation with different durations in the study [5] W. Nie, B. F. Zaitchik, G. Ni, and T. Sun, “Impacts of an-
 area all showed increasing trends. Specifically, the thropogenic heat on summertime rainfall in Beijing,” Journal
 extreme precipitation intensities Rx1h, Rx12h, and of Hydrometeorology, vol. 18, no. 3, pp. 693–712, 2017.
 Rx24h all passed the significance test, with magni- [6] R. Bornstein and Q. Lin, “Urban heat islands and summertime
 tude increases of 1.06, 1.64, and 2.16 mm/10a, re- convective thunderstorms in Atlanta: three case studies,”
 spectively. During the flood season, the intensities of Atmospheric Environment, vol. 34, no. 3, pp. 507–516, 2000.
 extreme precipitation with different durations all [7] S. Miao, F. Chen, M. A. LeMone, M. Tewari, Q. Li, and
 exhibited periodic alternations with a dominant Y. Wang, “An observational and modeling study of charac-
 period of 21 years. Both the magnitude and maxi- teristics of urban heat island and boundary layer structures in
 Beijing,” Journal of Applied Meteorology and Climatology,
 mum value of the periodic variations increased with
 vol. 48, no. 3, pp. 484–501, 2009.
 time. Abrupt changes could occur in the intensities [8] S. A. Changnon, “The La Porte weather anomaly-fact or
 of the precipitation with different durations. How- fiction?” Bulletin of the American Meteorological Society,
 ever, the significance of the abrupt change points was vol. 49, no. 1, pp. 4–11, 1968.
 low, and the extreme precipitation series fluctuated [9] X. Li, S. Ning, P. Zhang, and W. Yang, “Environmental
 greatly. pollution and health risks of heavy metals in the soil around a
Discrete Dynamics in Nature and Society 17

 construction waste landfill,” International Journal of Design & in a changing environment: II: Urban stormwater modeling
 Nature and Ecodynamics, vol. 15, no. 3, pp. 393–399, 2020. and management,” Advances in Water Science, vol. 25, no. 5,
[10] L. M. Hand and J. M. Shepherd, “An investigation of warm- pp. 752–764, 2014.
 season spatial rainfall variability in Oklahoma city: possible [27] H. Cui and F. Gao, “Spatiotemporal distribution of air pol-
 linkages to urbanization and prevailing wind,” Journal of lutants and process of severe air pollution: evidence from a
 Applied Meteorology and Climatology, vol. 48, no. 2, highly polluted industrial and mining city,” International
 pp. 251–269, 2009. Journal of Sustainable Development and Planning, vol. 15,
[11] J. J. Baik, Y. H. Kim, J. J. Kim, and J. Y. Han, “Effects of no. 3, pp. 385–391, 2019.
 boundary-layer stability on urban heat island-induced cir- [28] P. Liu, Z. Fang, C. Lv, and A. Ruan, “China’s agricultural
 culation,” Theoretical and Applied Climatology, vol. 89, no. 1, water-use efficiency and its influencing factors under the
 pp. 73–81, 2007. constraint of pollution emission,” International Journal of
[12] S. Pfahl, P. A. O’Gorman, and E. M. Fischer, “Understanding Design & Nature and Ecodynamics, vol. 15, no. 4, pp. 579–585,
 the regional pattern of projected future changes in extreme 2020.
 precipitation,” Nature Climate Change, vol. 7, no. 6, [29] Y. Xin, “Characteristic analysis of change in precipitation
 pp. 423–427, 2017. frequency in Xi’an city,” Journal of Natural Disasters, vol. 20,
[13] J.-L. Fan, Y.-J. Zhang, and B. Wang, “The impact of urban- no. 4, pp. 60–65, 2011.
 ization on residential energy consumption in China: an ag- [30] Z. Zhou, N. Hu, and H. Zhou, “Analysis on the change trend
 gregated and disaggregated analysis,” Renewable and of temperature and precipitation in Xi’an during the period of
 Sustainable Energy Reviews, vol. 75, pp. 220–233, 2017. 1961–2009,” Gan Han Qu Yan Jiu, vol. 29, no. 1, pp. 27–34,
[14] L. Shi, H. Taubenböck, Z. Zhang, F. Liu, and M. Wurm, 2012.
 “Urbanization in China from the end of 1980s until 2010- [31] D. Zhuang and J. Liu, “Study on the model of regional dif-
 spatial dynamics and patterns of growth using EO-data,” ferentiation of land use degree in China,” Journal of Natural
 International Journal of Digital Earth, vol. 12, no. 1, pp. 78–94, Resources, vol. 12, no. 2, pp. 105–111, 1997.
 2019.
[15] M. O. Andreae, D. Rosenfeld, P. Artaxo et al., “Smoking rain
 clouds over the Amazon,” Science, vol. 303, no. 5662,
 pp. 1337–1342, 2004.
[16] Y. J. Kaufman and R. S. Fraser, “The effect of smoke particles
 on clouds and climate forcing,” Science, vol. 277, no. 5332,
 pp. 1636–1639, 1997.
[17] F. Chabane, A. Arif, and S. Benramache, “The estimate of
 aerosol optical depth for diverse meteorological conditions,”
 Instrumentation, Measure, Métrologie, vol. 19, no. 2,
 pp. 119–123, 2020.
[18] D. Rosenfeld, “Suppression of rain and snow by urban and
 industrial air pollution,” Science, vol. 287, no. 5459,
 pp. 1793–1796, 2000.
[19] Q. Hu, J. Y. Zhang, Y. T. Wang, Y. Huang, Y. Liu, and L. J. Li,
 “A review of urbanization impact on precipitation,” Advances
 in Water Resources, vol. 29, pp. 138–150, 2018.
[20] H. Lin and J. N. Sun, “Possible effects of urbanization on
 regional precipitation over Yangtze river delta area,” National
 Sciences, vol. 50, pp. 792–799, 2014.
[21] Y. R. Jin, Q. F. Hu, Y. T. Wang, Y. Huang, H. B. Yang, and
 T. T. Cui, “Impacts of rapid urbanization on precipitation at
 two representative rain gauges in Shanghai city,” Journal of
 Hohai University National Sciences, vol. 45, pp. 204–210, 2017.
[22] S.-H. Lee, S.-W. Kim, W. M. Angevine et al., “Evaluation of
 urban surface parameterizations in the WRF model using
 measurements during the Texas air quality study 2006 field
 campaign,” Atmospheric Chemistry and Physics, vol. 11, no. 5,
 pp. 2127–2143, 2011.
[23] X. Wang, J. Liao, J. Zhang et al., “A numeric study of regional
 climate change induced by urban expansion in the Pearl river
 delta, China,” Journal of Applied Meteorology and Climatol-
 ogy, vol. 53, no. 2, pp. 346–362, 2014.
[24] H. Zhang, C. Wu, W. Chen, and G. Huang, “Effect of urban
 expansion on summer rainfall in the pearl river delta, south
 China,” Journal of Hydrology, vol. 568, pp. 747–757, 2019.
[25] D. Wu, “Rainstorm water-logging origin analysis and simu-
 lation study of Xi’an typical area,” M.S. thesis, Chang’an
 University, Xi’an, China, 2015.
[26] X. M. Song, J. Y. Zhang, G. Q. Wang, R. M. He, and
 X. J. Wang, “Development and challenges of urban hydrology
You can also read


