Continuous blood pressure measurement by using the pulse transit time: comparison to a cuff-based method
←
→
Page content transcription
If your browser does not render page correctly, please read the page content below
Eur J Appl Physiol
DOI 10.1007/s00421-011-1983-3

 ORIGINAL ARTICLE

Continuous blood pressure measurement by using the pulse
transit time: comparison to a cuff-based method
Heiko Gesche • Detlef Grosskurth • Gert Küchler                •

Andreas Patzak

Received: 22 October 2010 / Accepted: 25 April 2011
Ó Springer-Verlag 2011

Abstract Pulse transit time (PTT) and pulse wave                    SBP values using the PTT-based method and those mea-
velocity (PWV), respectively, were shown to have a cor-             sured by cuff resulted in a significant correlation. However,
relation with systolic blood pressure (SBP) and have been           the Bland–Altman plot shows relevant differences between
reported to be suitable for indirect BP measurements. The           both methods, which are partly due to greater variability of
aim of this study was to create a function between SBP and          the SBPPTT measurement during intensified exercise.
PWV, and to test its reliability for the determination of           Results suggest that PTT can be used for measuring
absolute SBP using a non-linear algorithm and a one-point           absolute SBP when performing an individual correction for
calibration. 63 volunteers performed exercise to induce             the offset of the BP–PWV relation.
rises in BP. Arterial PTT was measured between the
R-spike of the ECG and the plethysmographic curve of                Keywords     Blood pressure  Pulse transit time  Exercise
finger pulse-oximetry. The reference BP was measured
using a cuff-based sphygmomanometric aneroid device.
Data from 13 of the 63 volunteers served for the detection          Introduction
of the PWV–BP relationship. The created non-linear
function was used to calculate BP values after individual           Non-invasive measurement of blood pressure (BP) using
correction for the BP offset in a group of 50 volunteers.           cuff-based methods provides adequate data for many
Individual correlation coefficients for SBP measured by             applications in medicine. However, cuff-based methods
PTT (SBPPTT) and by cuff (SBPCUFF) varied between                   have some disadvantages, which limit their use in certain
r = 0.69 and r = 0.99. Taking all data together, we found           clinical situations. First, a continuous measurement of
r = 0.83 (276 measurements in 50 volunteers). In the                blood pressure is not possible, since a pause of at least
Bland–Altman plot, the limits of agreement were                     1–2 min between two BP measurements is necessary to
meanSBPPTT ;SBPCUFF ± 19.8 mmHg. In conclusion, comparing           avoid errors in the measurement (Campbell et al. 1990).
                                                                    Therefore, short-term changes in BP cannot be detected.
                                                                    Furthermore, the inflation of the cuff may disturb the
                                                                    patient and the consequences of these disturbances are
Communicated by Keith Phillip George.                               alterations of the BP. Both problems are, for example,
                                                                    important when investigating BP fluctuations during sleep.
H. Gesche  A. Patzak (&)                                           The blow up of the cuff leads to an arousal going along
Institute of Vegetative Physiology, Charité-Universitätsmedizin
                                                                    with an increase in the systemic blood pressure (personal
Berlin, Tucholskystr. 2, 10117 Berlin, Germany
e-mail: andreas.patzak@charite.de                                   observation). Thus, in this case, blood pressure measure-
                                                                    ment may result in false-positive values. An alternative
D. Grosskurth                                                       approach for a continuous, non-invasive and indirect
Clinic for Rehabilitation Mettnau, Radolfzell, Germany
                                                                    measurement of BP is based on changes in pulse wave
G. Küchler                                                         velocity (PWV). PWV is the speed of a pressure pulse
SOMNOmedics GmbH, Randersacker, Germany                             propagating along the arterial wall and can easily be

                                                                                                                      123
Eur J Appl Physiol
calculated from pulse transit time (PTT). PTT is the time Table 1 Gender, height, and correlation coefficients of volunteers
between two pulse waves propagating on the same cardiac (group 1)
cycle from two separate arterial sites. PTT has been shown Subj. Sex Height CC #
to be quasi-linear to low BP values, but increase expo- (cm)
nentially at higher pressures (Pruett et al. 1988; Callaghan
1 m 173 0.988 5
et al. 1984).
2 m 171 0.995 3
The velocity of a longitudinal pressure wave is related
3 f 165 0.946 5
to the elasticity of the arterial vessel and to the vessel
4 f 168 0.878 4
dimension by the equation of Moens and Korteweg
5 f 163 0.940 4
(Callaghan et al. 1984; Wippermann et al. 1995). PWV
6 m 180 0.942 6
depends both on the arterial pressure and the intrinsic
7 f 172 0.853 4
elastic properties of the arterial wall. In practice, it is
8 f 176 0.892 5
difficult to estimate how well PWV reflects BP and in
9 m 184 0.782 6
how far severe age-dependent or disease-related changes
(e.g., atherosclerosis) influence the arterial wall stiffness. 10 f 170 0.747 4
In fact, investigations in a larger number of subjects 11 m 192 0.973 3
showed that age, BP, gender, and cardiovascular risk 12 m 188 0.941 6
factors significantly influence PWV (Yamashina et al. 13 m 171 0.999 3
2003; Mitchell et al. 2004; Schiffrin 2004; Foo and Lim Subj. subject, CC correlation coefficient, # number of data pairs
2006). These results suggest that PWV can only be used
for measurement of relative BP changes as it has been
shown by a number of studies in human beings and
Table 2 Gender, height, and correlation coefficients of volunteers
animals (Ochiai et al. 1999; Barschdorff and Erig 1998).
(group 2)
However, determination of the individual the PWV–BP
relation and calibration of the system would allow the Subj. Sex Height CC # Subj. Sex Height CC #
(cm) (cm)
measurement of the absolute BP using the indirect method
using PTT. This procedure is time consuming and not 1 m 191 0.875 6 26 m 181 0.739 6
feasible in most of the situations. Therefore, we devel- 2 m 180 0.931 6 27 m 165 0.985 4
oped a one-point calibration of the PWV–BP relation, 3 m 187 0.852 6 28 f 161 0.699 6
which needs only one measurement of BP using a cuff- 4 m 177 0.781 6 29 f 163 0.724 6
based reference method. 5 f 161 0.987 6 30 f 162 0.956 6
The aim of the present study was (1) to develop a PWV– 6 f 169 0.977 6 31 f 165 0.975 5
BP function on the basis of the physiological properties of 7 m 185 0.986 3 32 m 186 0.951 5
arterial walls and (2) to test if a one-point calibration of the 8 m 173 0.968 5 33 m 172 0.986 6
PWV–BP relation offers an adequate measure of the 9 f 163 0.855 5 34 m 193 0.888 5
absolute SBP. 10 m 183 0.958 6 35 m 160 0.905 5
11 m 183 0.999 6 36 m 183 0.915 5
12 f 163 0.978 4 37 f 160 0.995 6
Methods and materials 13 f 171 0.994 5 38 f 164 0.962 6
14 m 197 0.998 5 39 f 171 0.854 5
Subjects 15 f 167 0.992 5 40 f 178 0.991 5
16 f 176 0.99 5 41 f 168 0.908 6
We included a total of 63 subjects (see Tables 1, 2). All
17 f 165 0.969 6 42 m 177 0.952 3
subjects underwent a physical examination on a bicycle
18 m 182 0.952 6 43 f 177 0.928 6
ergometer with the aim the induce blood pressure
19 m 189 0.925 6 44 f 178 0.807 4
increases.
20 m 183 0.94 6 45 m 180 0.92 4
Group 1 consisted of 13 persons (6 females, 7 males)
21 m 173 0.972 6 46 m 185 0.885 6
who served for the determination of the PWV–BP function.
22 m 187 0.999 3 47 m 169 0.998 4
To test for the applicability of this function for measure-
23 m 182 0.975 6 48 m 174 0.925 6
ment of absolute SBP a second group of 50 volunteers (21
24 f 168 0.976 6 49 f 157 0.92 5
females, 29 males, group 2) was investigated. The main
25 m 168 0.986 6 50 m 187 0.985 6
exclusion criterion for all subjects was cardiovascular
diseases, which were potent to influence the ECG or Subj subject, CC correlation coefficient, # number of data pairs
123Eur J Appl Physiol
plethysmography signal and thereby impeding an accurate this distinct time point was used for the one-point cali-
detection of the PTT. bration of the PWV–BP function.
All subjects gave their written informed consent to Data collection BP was measured by cuff (BPcuff) at the
participate in the study. The local ethical commission end of each level of exercise (steady-state conditions).
approved of the study (EA1/127/06). Cycling was stopped for 1 min during the measurement
to reduce disturbances due to the movements. The
Equipment measurement time was marked in the SOMNOscreenTM.
BP calculated from PTT (BPPTT) was obtained contin-
Exercise was performed on a bicycle ergometer EGT 1000 uously for each heart cycle after calibration in the
(ELMED, Zimmer Elektromedizin GmbH in Neu-Ulm, software. BP values were averaged using a 5-value
Germany). The electrocardiogram (ECG) and the fin- moving window to reduce the influence of artifacts (e.g.,
ger plethysmography curve were recorded with the SOM- changes caused by breathing). Corresponding values of
NOscreenTM polysomnography device (SOMNOmedics BPPTT and BPcuff were used for the statistical compar-
GmbH, Randersacker, Germany). The determination of ison of methods.
PTT and calculation of PWV and BP was performed with
the DOMINO-Software (DOMINO 2.2.0 supplied with the Determination of PTT
SOMNOscreenTM). To obtain the ECG, a modified lead
after Nehb was applied. Two bipolar electrodes were fixed: PTT is defined as the time delay between the R-wave of the
parasternal 2. ICR, right, and 5. ICR, left. Another elec- ECG and the arrival of the pulse wave in the periphery
trode was affixed to the lower arm and served for the (finger). The R-wave was detected from a chest lead of the
electrical ground. The plethysmography signal was ECG (Nehb) using amplitude and slope criteria. The arrival
obtained using a probe for finger plethysmography/pO2 of the pulse wave was defined by the peak value of the
(SOMNOmedics GmbH, Randersacker, Germany). The differentiated signal, which corresponds to the steepest part
cuff of the sphygmomanometric devise was placed at the of the ascent of the plethysmography signal (Fig. 1).
contra lateral upper arm. The PWV was calculated using the following formula
(Davies and Struthers 2003):
Measurement procedure BDC height ðcmÞ
PWV ðcm/ms) ¼
PTT ðmsÞ
Exercise protocols
with BDC = body correlation factor, and height = body
Group 1 The maximum load and size of the incremental length. BDC is 0.5 for adults when taken the finger for
increase of exercise in this group depended on the detection of the peripheral pulse wave as used in the
physical abilities of the subjects and their anthropomet-
ric data. Increment was either 25 or 50 W. We obtained
3–6 data pairs per subject (Table 1).
Group 2 The subjects underwent a standardized incre-
mental load on a bicycle ergometer. The increment was
0.5 W/kg BM. Five load steps were performed up to
2.5 W/kg BM.
Calibration procedure
Groups 1 and 2 Before starting exercise on the bicycle
ergometer, volunteers relaxed in a sitting position. Then
the SOMNOscreenTM was started. BP was measured by a
calibrated sphygmomanometric aneroid device. A single
sphygmomanometric measurement (cuff) was performed
to obtain BPcal. The point in time was indicated by
pressing the marker button of the SOMNOscreenTM. This
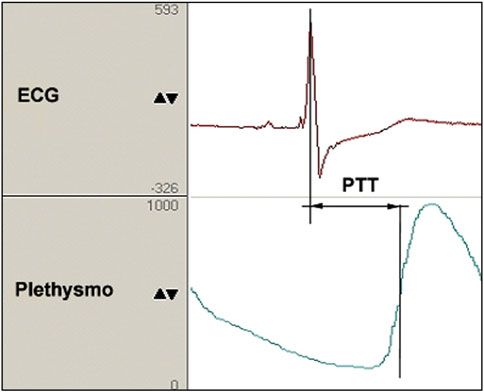
Fig. 1 Original traces of the electrocardiogram (ECG, upper trace)
procedure allowed a correct time alignment of BP mea-
and peripheral pulse wave (Plethysmo) showing the detection of
sured by cuff (BPcal) and BP measured using the PTT R-wave and pulse wave arrival and the calculation of the pulse
(BPPTT,cal). The difference between BPPTT,cal and BPcal at transition time (PTT)
123Eur J Appl Physiol
present study. This parameter is based on several studies Results
showing a highly significant correlation between arm span
and body height and small absolute differences between PWV–BP relation
both measures (Versluis et al. 1999; Nygaard 2008). The
BDC corresponds to the distance from sternal notch to the Applying the algorithm for the calculation of the SBP
tip of the middle finger. (including the one-point-calibration) to data of the first
group resulted in a significant correlation between BPPTT
Statistics and BPcuff. Individual correlation coefficients (n = 13)
varied between r = 0.75 and r = 0.99 (see Table 1). The
The relation between BPcuff and BPPTT was examined using correlation coefficient for all data of the 13 volunteers was
linear regression analysis. Correlation coefficients for BPcuff r = 0.89 after correction for repeated measurements
versus BPPTT were calculated for individuals as well as for (p \ 0.05, n = 58, Fig. 2).
the whole group. The latter was corrected for multiple
measurements according to the formula by Bland and Alt- Application of the PWV–BP function
man (1995). The bias was estimated according the procedure
suggested by Hopkins (2004). The table of variance was The created function was used to calculate BP values after
calculated using ‘‘R: A Language and Environment for individual correction for the offset in SBP in a group of 50
Statistical Computing’’, package ‘‘hh’’, (R Development volunteers. In this group, load was increased in 5 steps
Core Team 2010). In addition, a Bland–Altman plot was resulting, theoretically, in 300 measurements. However,
done. In the Bland–Altman plot, the mean value calculated the number was reduced due to muscle exhaustion or
from corresponding BP values obtained from both methods reaching stop criteria (n = 25). Further eight measure-
is plotted against the corresponding difference of the mean ments were lacking because of technical disturbances in the
BP minus the BPPTT. The agreement limits were defined by ECG and/or finger plethysmography. At the end, 267 data
mean ± 1.96 of the standard deviation (SD) of the differ- pairs were analyzed. Figure 3 shows the plot of BPcuff and
ences. The plot helps to assess the disagreement between the BPPTT and the regression for this group. The individual
two methods of BP measurement (Bland and Altman 1986). (n = 50) correlation coefficients of BPcuff versus BPPTT
varied between r = 0.69 and r = 0.99 (see Table 2). The
Model for the PWV–BP relation correlation coefficient for data of all 50 volunteers and
measurements was r = 0.83 after correction for repeated
An empiric mathematical function was created to fit the data measurements (n = 267, p \ 0.05).
of PWV and SBP obtained from 13 subjects of group 1. The
function consists of three terms: (1) an exponential term, (2)
a second non-linear term, and (3) a correction constant,
which is the difference of the BPPTTcal and the BPcal mea-
sured by the reference cuff method. This correction corre-
sponds to a one-point calibration and shifts the curve to the
reference BP. The following function was obtained:
BPPTT ¼ P1 PWV eðP3PWVÞ þ P2 PWVP4
ðBPPTT;cal BPcal Þ
with the parameters P1 = 700, P2 = 766,000, P2 = -1,
and P4 = 9, BPPTT,cal as the calculated BP (from PTT)
corresponding to the BP measured by the reference
method, and BPcal as the BP measured at a distinct time at
the beginning of the experiment using the reference method
(cuff). The parameters P1–P4 were estimated by least
square fitting of the function to the data of 13 subjects (see
‘‘Subjects’’). The non-linear regression coefficient was
r2 = 0.626. Figure 2 depicts the individual graphs of the Fig. 2 Graphical demonstration of the two components of the
two components of the function, of the resulting function, empiric PWV–BP function (1st and 2nd component) and the resulting
function without correction (dashed line), and with correction
the original data, and the effect of the one-point calibration.
(dashed ? dotted line) using one-point calibration (for details see
The algorithm used is matter of a patent (11/364 174 US ‘‘Methods’’ section). Filled dots represent the measured data (from
2006/0217616 A1, 7374542). group 1)
123Eur J Appl Physiol
The Bland–Altman plot of the data shows differences of
about 20 mmHg between both methods.
In the present paper, the relation between PWV and
measured SBP followed a non-linear function. Similar non-
linear relations between BP and brachial–ankle PWV were
described by Yamashina et al. 2003 in human beings. Other
authors obtained a non-linear relationship between PVW
and BP, which was inverted to that of the above cited
studies (Chen et al. 2009; Zheng and Murray 2009). Linear
as well as non-linear PTT-BP functions have been descri-
bed in isolated canine common carotid arteries (Callaghan
et al. 1984), while a number of authors reported linear
relations (Geddes et al. 1981; Payne et al. 2006).
The innovation of the presented method is the non-linear
algorithm and the one-point calibration. Latter reduces the
Fig. 3 Plot of systolic blood pressure measured by cuff (BPcuff)
versus systolic blood pressure calculated from the pulse transit time influence of the structural properties of arteries by shifting
(BPPTT) of group 2. The straight line represents linear regression (see the PWV–BP relationship along the y-axis. Normally,
inserted formula) individual age and/or disease-dependent differences in the
arterial stiffness do not allow calculating absolute BP
values. This difficulty can only be avoided by creating
individual calibration points. Indeed, high correlation
between BP derived from the PTT and SBP as well as
errors smaller than 10% were observed using an intermitted
calibration of the SBP (Chen et al. 2000). However, this
procedure seems not to be practicable under clinical con-
ditions. The one-point calibration requires only one BP
measurement using a reference method (cuff) in the
beginning of the patient’s investigation. It has to be con-
sidered that patients may differ more or less in regard to the
steepness of their PWV–BP relation. Therefore, the one-
point calibration represents a compromise between clinical
practicability and the need for a complete calibration curve.
Nevertheless, the application of the PWV–BP function to
the data of the first group serving for the creation of the
Fig. 4 Bland–Altman plot of the systolic blood pressure (BP) data of PWV–BP relation resulted in highly significant individual
50 volunteers (group 2) obtained during cycling with increasing load
correlation coefficients.
(for details see ‘‘Methods’’ section). 18 of 276 pairs are located
beyond the agreement limits (mean ± 1.96 SD). Mean represents the To test if the method presented here leads to clinically
average of all differences calculated from (BPcuff ? BPPTT)/2 - useful determinations of the absolute SBP, a group of 50
BPPTT. The plot gives an idea about the disagreement between the volunteers were investigated. Their individual correlation
two measures
coefficients were significantly high and the values were
similar to those that of the first group. While differences
between BPPTT and mean BP did not exceed 20 mmHg in
Figure 4 shows the Bland–Altman plot of the data. The the lower pressure range (up to 160 mmHg), the scatter
analysis reveals agreement limits of meanSBPPTT ;SBPCUFF ± increased in the upper BP range. Individual differences in
19.8 mmHg. Higher BP values were associated with a the PTT–BP relation can be responsible for this effect.
greater scatter of the data. Another reason may be the higher frequency of distur-
bances of the ECG lead and the plethysmography signal
during increased load and motor activity on the bicycle
Discussion ergometer. Such effects have bigger impacts on the PWV
calculation when the PTT is short as during high load and
The present study shows that the SBP calculated from the high SBP periods. To prevent a significant influence of,
pulse transit time using a one-point calibration correlates e.g., breathing disturbances, the calculated PTTs were
significantly with the SBP measured by the cuff method. averaged for five cycles in the present study.
123Eur J Appl Physiol
The calculation of PTT from the ECG (R-spike) and the The present study suggests the usefulness of BP mea-
peripheral plethysmographic signal has the advantage of surement by using the PTT for continuous recording of the
good availability of both signals under several clinical SBP. Further studies have to be performed to check if this
situations when the ECG and the oxygen saturation are method is suitable for the measurement of SBP in patients
monitored, for example, during sleep. The ECG signal was under clinical conditions.
used as the proximal timing point because it is easy to PortapresÒ, FinapresÒ and similar method/equipments
detect and shows lesser artifacts compared to the phono- based on Penaz’s principle can also be used for non-
cardiogram. On the other hand, PTT calculated from the invasive measurement of the systemic blood pressure.
ECG includes the pre-ejection period (PEP), which is Their advantage is the continuous registration of blood
the time between the onset of electrical cardiac activity and pressure. These methods have been largely applied in
the start of mechanical ventricular ejection. It has recently scientific and clinical investigations. Several studies
been shown that PEP contributes significantly to the PTT. showed that these systems also have disadvantages. The
This was shown in studies where BP was varied over a absolute blood pressure measured using this technique can
wide range using several pharmacological agents and in differ compared to intra-arterial and cuff-based methods
short-term physical stress tests, respectively (Payne et al. due to many reasons (Eckert and Horstkotte 2002; Mol-
2006; Muehlsteff et al. 2006). The data also show that PEP hoek et al. 1984; Kugler et al. 1997; Kermode et al.
accounts for a variable proportion of PTT suggesting that 1989). Physical and physiological factors influence the
the PTT estimated from ECG does not only reflect arterial measurement (Imholz et al. 1998). Further, the equipment
stiffness (Payne et al. 2006). is cost intensive, which limits the widespread use in the
One limitation of the present study is the use of the cuff clinic. The current system for calculation of the SBP does
method for the reference BP which cannot be considered as not require additional hardware, for example, in most of
the ‘‘Gold standard’’. This is mentionable, since sphyg- the diagnostic or therapeutic measurements in the sleep
momanometric measurements have inaccuracies compared laboratory. ECG and finger plethysmography are routine
with arterial BP measurements (Brown et al. 1994; Tur- methods (monitoring). The presented algorithm allows
janmaa 1989; Rebenson-Piano et al. 1987; Van Bergen calculating exclusively the SBP in the present study. This
et al. 1954). Possibly, such inaccuracies contribute to the is a limitation, since diastolic and mean BP values are
scatter of the plots in the present study. Remarkably, a also of clinical interest.
recent clinical study, comparing the BP measured by PTT In conclusion, the results show that the created PWV–
with that of an invasive measurement of the arterial blood BP function, including a one-point calibration, produces
pressure, demonstrated similar results in comparison with significant correlation between BP derived from the PWV
the present study (Bartsch et al. 2010). The differences and the SBP measured by sphygmomanometry. Although
shown in the Bland–Altman plot extended to about differences in SBP between both methods reached values
15 mmHg in patient without cardiac arrhythmias and up to 20 mmHg, we think that the results form a base for
hypotension, while the 1.96 SD was clearly greater further studies with the aim to evaluate the applicability
([25 mmHg) in a group including patients with arrhyth- under clinical conditions.
mias and hypotension. This, on the other hand, suggests
that the cuff methods used in the present study does not Acknowledgments The authors thank Prof. P. Martus for his sup-
port in statistical analysis.
offer serious disadvantages versus intra-arterial measure-
ments in this context. Conflict of interest There are no conflicts of interest for the authors
The 1.96 SD of about 20 mmHg in the present study is Heiko Gesche, Detlef Grosskurth, and Andreas Patzak. Gert Küchler
debatable in sense of the usability of the PTT method. holds the patent cited in the manuscript and is owner of the Som-
nomedics GmbH. There was no financial support from any company.
Whether such a variability of differences is clinically
acceptable depends on the application of these methods.
Interestingly, mean values of BP calculated from PTT and
of BP measured intra-arterially did not differ in a group of
References
40 volunteers (19,200 data points) (Bartsch et al. 2010).
Thus, long-term measurement and calculation of mean BP Barschdorff D, Erig M (1998) [Continuous blood pressure monitoring
via PTT gives reliable values. For short-term investiga- during stress ECG] Kontinuierliche Blutdruckbestimmung wah-
tions, as performed in the present study, and for evaluation rend des Belastungs-EKG. Biomed Tech (Berl) 43:34–39
of transient events, the advantages of the continuous, non- Bartsch S, Ostojic D, Schmalgemeier H, Bitter T, Westerheide N,
Eckert S, Horstkotte D, Oldenburg O (2010) Validation of
invasive, and non-expensive method via PTT has to be continuous blood pressure measurements by pulse transit time: a
weighted with the disadvantage of higher variability of comparison with invasive measurements in a cardiac intensive
calculated values. care unit. Dtsch Med Wochenschr 135:2406–2412
123Eur J Appl Physiol
Bland JM, Altman DG (1986) Statistical methods for assessing reflection with advancing age in healthy men and women: the
agreement between two methods of clinical measurement. Framingham Heart Study. Hypertension 43:1239–1245
Lancet 1:307–310 Molhoek GP, Wesseling KH, Settels JJ, van Vollenhoven E, Weeda
Bland JM, Altman DG (1995) Calculating correlation coefficients HW, de Wit B, Arntzenius AC (1984) Evaluation of the Penaz
with repeated observations: part 2—Correlation between sub- servo-plethysmo-manometer for the continuous, non-invasive
jects. BMJ 310:633 measurement of finger blood pressure. Basic Res Cardiol 79:
Brown MA, Reiter L, Smith B, Buddle ML, Morris R, Whitworth JA 598–609
(1994) Measuring blood pressure in pregnant women: a Muehlsteff J, Aubert XL, Schuett M (2006) Cuffless estimation of
comparison of direct and indirect methods. Am J Obstet Gynecol systolic blood pressure for short effort bicycle tests: the
171:661–667 prominent role of the pre-ejection period. Conf Proc IEEE Eng
Callaghan FJ, Babbs CF, Bourland JD, Geddes LA (1984) The Med Biol Soc 1:5088–5092
relationship between arterial pulse-wave velocity and pulse Nygaard HA (2008) Measuring body mass index (BMI) in nursing
frequency at different pressures. J Med Eng Technol 8:15–18 home residents: the usefulness of measurement of arm span.
Campbell NR, Chockalingam A, Fodor JG, McKay DW (1990) Scand J Prim Health Care 26:46–49
Accurate, reproducible measurement of blood pressure. CMAJ Ochiai R, Takeda J, Hosaka H, Sugo Y, Tanaka R, Soma T (1999)
143:19–24 The relationship between modified pulse wave transit time and
Chen W, Kobayashi T, Ichikawa S, Takeuchi Y, Togawa T (2000) cardiovascular changes in isoflurane anesthetized dogs. J Clin
Continuous estimation of systolic blood pressure using the pulse Monit Comput 15:493–501
arrival time and intermittent calibration. Med Biol Eng Comput Payne RA, Symeonides CN, Webb DJ, Maxwell SR (2006) Pulse
38:569–574 transit time measured from the ECG: an unreliable marker of
Chen Y, Wen C, Tao G, Bi M, Li G (2009) Continuous and beat-to-beat blood pressure. J Appl Physiol 100:136–141
noninvasive blood pressure measurement: a novel modeling Pruett JD, Bourland JD, Geddes LA (1988) Measurement of pulse-
methodology of the relationship between blood pressure and wave velocity using a beat-sampling technique. Ann Biomed
pulse wave velocity. Ann Biomed Eng 37:2222–2233 Eng 16:341–347
Davies JI, Struthers AD (2003) Pulse wave analysis and pulse wave R Development Core Team (2010) R foundation for statistical
velocity: a critical review of their strengths and weaknesses. computing, Wien, Austria. http://www.R-project.org
J Hypertens 21:463–472 Rebenson-Piano M, Holm K, Powers M (1987) An examination of the
Eckert S, Horstkotte D (2002) Comparison of Portapres non-invasive differences that occur between direct and indirect blood pressure
blood pressure measurement in the finger with intra-aortic measurement. Heart Lung 16:285–294
pressure measurement during incremental bicycle exercise. Schiffrin EL (2004) Vascular stiffening and arterial compliance.
Blood Press Monit 7:179–183 Implications for systolic blood pressure. Am J Hypertens
Foo JY, Lim CS (2006) Pulse transit time as an indirect marker for 17:39S–48S
variations in cardiovascular related reactivity. Technol Health Turjanmaa V (1989) Determination of blood pressure level and changes
Care 14:97–108 in physiological situations: comparison of the standard cuff method
Geddes LA, Voelz M, James S, Reiner D (1981) Pulse arrival time as with direct intra-arterial recording. Clin Physiol 9:373–387
a method of obtaining systolic and diastolic blood pressure Van Bergen FH, Weatherhead DS, Treloar AE, Dobkin AB, Buckley
indirectly. Med Biol Eng Comput 19:671–672 JJ (1954) Comparison of indirect and direct methods of
Hopkins WG (2004) Bias in Bland–Altman but not regression validity measuring arterial blood pressure. Circulation 10:481–490
analyses. Sportscience 8:42–46 Versluis RG, Petri H, van de Ven CM, Scholtes AB, Broerse ER,
Imholz BP, Wieling W, van Montfrans GA, Wesseling KH (1998) Springer MP, Papapoulos SE (1999) Usefulness of armspan and
Fifteen years experience with finger arterial pressure monitoring: height comparison in detecting vertebral deformities in women.
assessment of the technology. Cardiovasc Res 38:605–616 Osteoporos Int 9:129–133
Kermode JL, Davis NJ, Thompson WR (1989) Comparison of the Wippermann CF, Schranz D, Huth RG (1995) Evaluation of the pulse
Finapres blood pressure monitor with intra-arterial manometry wave arrival time as a marker for blood pressure changes in
during induction of anaesthesia. Anaesth Intensive Care 17: critically ill infants and children. J Clin Monit 11:324–328
470–475 Yamashina A, Tomiyama H, Arai T, Koji Y, Yambe M, Motobe H,
Kugler J, Rollnik J, Schmitz N (1997) Retest-reliability and Glunizia Z, Yamamoto Y, Hori S (2003) Nomogram of the
convergent validity of noninvasive blood pressure determination: relation of brachial–ankle pulse wave velocity with blood
arm sphygmomanometry vs. Penaz-method. Int J Clin Monit pressure. Hypertens Res 26:801–806
Comput 14:251–254 Zheng D, Murray A (2009) Non-invasive quantification of peripheral
Mitchell GF, Parise H, Benjamin EJ, Larson MG, Keyes MJ, Vita JA, arterial volume distensibility and its non-linear relationship with
Vasan RS, Levy D (2004) Changes in arterial stiffness and wave arterial pressure. J Biomech 42:1032–1037
123You can also read