Explosion Pressure and Minimum Explosible Concentration Properties of Metal Sulfide Ore Dust Clouds
←
→
Page content transcription
If your browser does not render page correctly, please read the page content below
Hindawi
Journal of Chemistry
Volume 2020, Article ID 7980403, 12 pages
https://doi.org/10.1155/2020/7980403

Research Article
Explosion Pressure and Minimum Explosible Concentration
Properties of Metal Sulfide Ore Dust Clouds

 Yun-zhang Rao,1 Chang-shun Tian ,1 Wei Xu,1 Chun-yu Xiao,1 Bo-yun Yuan,2 and Yao Yu1
 1
 Faculty of Resources and Environmental Engineering, Jiangxi University of Science and Technology, Ganzhou 341000, China
 2
 Jiangle County Natural Resources Bureau, Jiangle 353300, China

 Correspondence should be addressed to Chang-shun Tian; 15581044@qq.com

 Received 18 September 2019; Revised 14 December 2019; Accepted 6 January 2020; Published 30 January 2020

 Academic Editor: Hakan Arslan

 Copyright © 2020 Yun-zhang Rao et al. This is an open access article distributed under the Creative Commons Attribution License,
 which permits unrestricted use, distribution, and reproduction in any medium, provided the original work is properly cited.
 The explosion pressure and minimum explosible concentration (MEC) properties of metal sulfide ore dust clouds are valuable for
 the prevention and control of metal sulfide ore dust explosions. In this study, a 20 L explosion sphere vessel was used to investigate
 the effect of sulfur content, particle size, and concentration on the explosion pressure and minimum explosible concentration of
 metal sulfide ore dust clouds. Four samples with different sulfur contents were selected (30%–40%, 20%–30%, 10%–20%, and 0%–
 10%). Before and after the explosion, samples were tested by X-ray diffraction. The results indicate that the metal sulfide ore dust is
 explosive dust with St1 grade explosion pressure. With an increase in concentration, the maximum explosion pressure increased at
 first and then decreased. With an increase in sulfide content, the explosion pressure of metal sulfide ore dust increased, while the
 minimum explosible concentration decreased. As particle size decreased, the MEC also decreased. The sulfur content, particle size,
 and concentration of metal sulfide ore dust were the main factors affecting the explosion hazard.

1. Introduction The explosion characteristic parameters of dust mainly
 include the maximum explosion pressure (Pmax), minimum
Metal sulfide ores are widely applied in industrial produc- explosible concentration (MEC), maximum explosion
tion of products, such as jewelry, automobile parts, and pressure rise rate ((dP/dt)max), and explosion index (Kst).
electronic equipment. The most common metal sulfide ores Among them, Pmax, (dP/dt)max, and Kst are used to char-
are pyrite. In addition, sulfide ores include chalcopyrite acterize the severity of dust explosion consequences, whereas
(copper ore), molybdenite (molybdenum ore), sphalerite the MEC is used to characterize the possibility of dust ex-
(zinc ore), galena (lead ore), and cinnabar (mercury ore) [1]. plosions [9]. Many studies have experimentally considered
Because of the chemical activity of sulfur and iron and the the explosion parameters of dust and factors influencing
variable valence [2], they can readily undergo spontaneous dust explosion parameters.
combustion and even explosion. Furthermore, a lot of
sulfide dust is dispersed into the air to form dispersed gas-
solid mixtures, and satisfactory conditions can lead to a 1.1. Effect of Particle Size. A sulfide dust explosion is less
significant explosion risk [3–6]. In recent years, an increased severe than the explosion of carbonaceous dusts, such as
frequency in metal sulfide ore dust explosion accidents has cornstarch and wheat flour. Compared with other com-
resulted in injuries and losses to life and property in Europe, bustible dusts in underground mines, sulfide dust is also less
Canada, South Africa, Australia, the former Soviet Union, hazardous than bituminous coal dust and higher-grade oil
China, and other countries, as displayed in Table 1 [7, 8]. shale dust [10]. Pyrite has been found to be more explosible
However, studies on the dust explosion of metal sulfide ores than pyrrhotite, and fine particles make a significant con-
are limited. Therefore, studying explosion characteristics of tribution to explosibility [8]. The risk and strength of the
metal sulfide ore dust is important for preventing and explosion of sulfur dust decrease with increasing particle size
controlling major hazardous accidents in various industries. [11]. With a decrease in particle size, the measured MEC
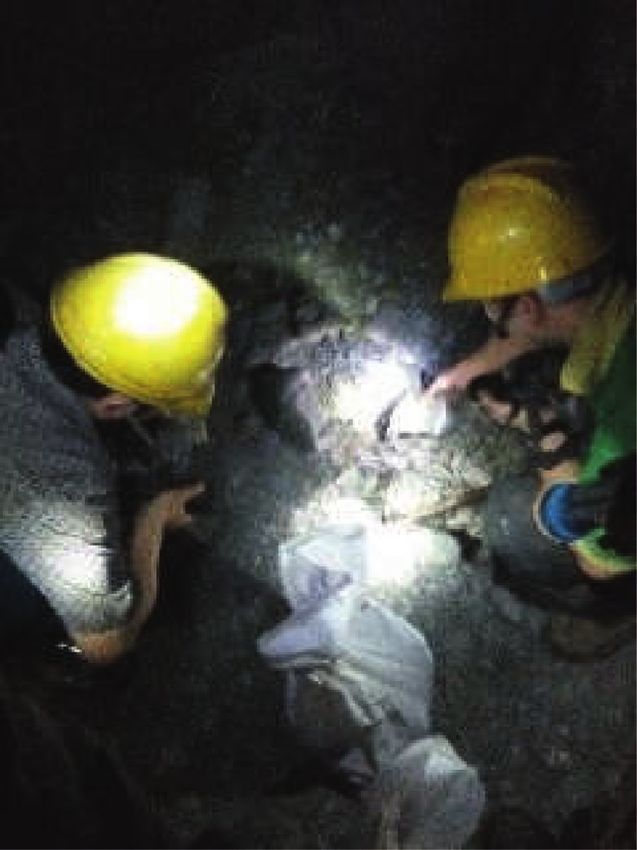
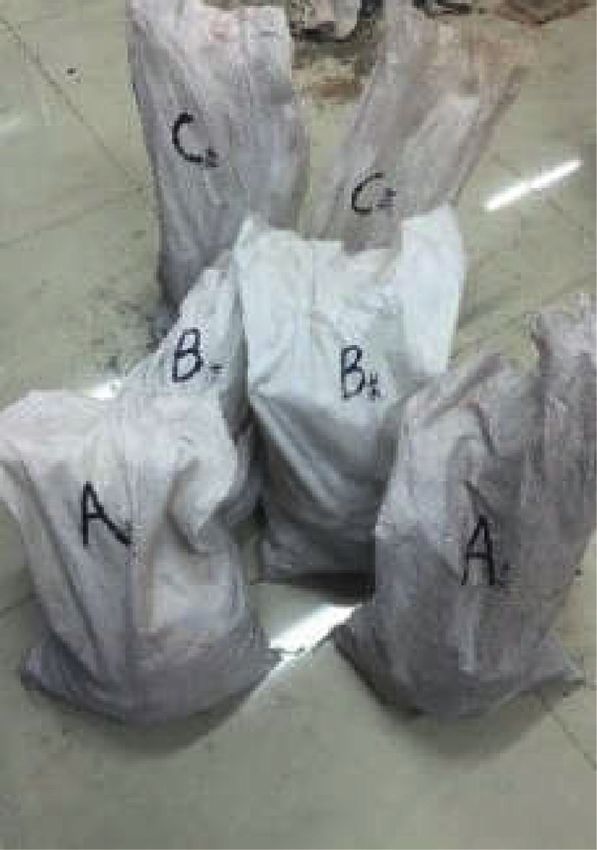
2 Journal of Chemistry

 Table 1: Reported cases of sulfide dust explosions. 2. Materials and Experimental Methods
Date Country Fatalities Injuries
 2.1. Materials and Characterization. Metal sulfide ores
1924 USA 4 8 (pyrite, FeS2) were obtained from Dongxiang Copper
1926 USA 3 1
 Mine, Jiangxi Province, China, mainly because many
1960s Canada 2 0
1969 Sweden 2 2
 accidents of sulfide ore dust combustion and explosion
1970∼1974 China 5 10 have been reported in the mine [24]. To ensure accuracy of
1978 China 4 0 sampling, multiple times and multipoint sampling
1979 China 4 0 methods were adopted. To prevent or reduce oxidation
1985 Canada 1 2 during transportation, a polyethylene film was used to
2002 China 2 0 wrap the sulfide ores, as shown in Figure 1. The sulfur
2004 China 3 0 content of the ores was determined by the combustion
 neutralization method and was as per the GB/T 2462-1996
becomes lower, and the measured MEC has an approximate standard [25]. The samples were burnt in an air flow at
linear relation with particle size [12]. The influence of dust 850°C, and the sulfur in the sulfur monomer and sulfide
particle size on Pmax and (dP/dt)max is relatively small be- was converted into sulfur dioxide gas and absorbed and
cause of the condensation between the heated volume ex- oxidized into sulfuric acid using a hydrogen peroxide
pansion of sulfur particles and sulfur droplets [13]. At the solution. Methyl red-methylene blue was used as an in-
same dust concentration, Pmax and Kst all increase with dicator, and sodium hydroxide standard titration solution
decreasing particle size [14]. Irregularly shaped dust has a was used for titration. The samples were divided into
lower MIE compared to spherical-shaped dust because of the ultra-high sulfur ores A (sulfur content 30–40%), high
higher specific surface area of irregularly shaped dust, which sulfur ores B (sulfur content 20–30%), medium sulfur ores
affects dust cloud dynamics and leads to a lower resistance to C (sulfur content 10–20%), and low sulfur ores D (sulfur
thermal conduction [15]. For selected nanopowders, there content 0–10%).
does not seem to be an explosion difference between dif- The ores were crunched in the laboratory. To reduce
ferent particle sizes because the characteristic diameters are oxidation of the surfaces during crushing, the ores were not
mainly affected by agglomeration; however, for microsized scrapped too finely (Figure 2). The crushed ores were
aluminum powders, the explosion characteristics decrease screened through sieves with pore sizes of 10 mm and
with an increase in particle size [16–18]. 1.25 mm. To avoid the influence of water content on
 grinding, the crushed ore samples were dried at 40°C for
 24 h. An XZM-100 grinder (Wuhan Prospecting Machinery
1.2. Effect of Sulfur Content. When the sulfur content of the Factory, China) was used to finely crush the ores. The ores
sulfide dust cloud increases, more sulfur gas is produced by were crushed through 200 mesh (75 μm), 300 mesh
heating during ignition, heat is more sufficiently released (48 μm), and 500 mesh (25 μm) sieves (Jiufeng Sieve, China;
from sulfur combustion, and the MIE required for ignition implementing Standards of GB/T 6003.1-2012 [26]). The
and explosion of sulfide dust is reduced [19, 20]. samples were numbered A200, A300, A500, B200, B300,
 B500, C200, C300, C500, D200, D300, and D500. They were
 collected and put into polyvinyl chloride bags for further
1.3. Effect of Concentration. Pmax and Kst increase at first and analysis.
then decrease with increasing mass concentration [21, 22]. The particle sizes of the four samples (A, B, C, and D)
For Pmax and (dP/dt)max of sulfur dust, the effect of dust mass were tested using a Winner 2000 laser particle size analyzer.
concentration is stronger than that of ignition energy, and The results are shown in Figure 3. D50 (the particle size,
the effect of ignition energy is stronger than that of particle whose cumulative distribution of particles is 50%) was used
size [11]. The effect of rubber dust mass concentration on as the average particle size of the sample, supplemented by
Pmax and Kst is obvious. Pmax and Kst increase at first and the analysis of the proportion of the main particle size
then decrease with increasing mass concentration [23]. range in each group of samples. As we can see from Fig-
 The explosion of sulfide dust is a complex unsteady gas- ure 3, the proportion of particle sizes less than 10 μm is the
solid two-phase dynamic process [23]. Therefore, it is im- largest as it exceeds 50%. The mineral dust of the particle
portant to study the explosion parameters of metal sulfide size can be stably suspended in air to form stable dust
ore dust during explosion to guide the prevention and clouds.
control of mine disasters caused by dust explosions. In this The main mineral components of the four samples were
study, four metal sulfide ore dusts were investigated using a identified by Empyrean X-ray diffraction (XRD), and the
20 L explosion sphere vessel to examine the Pmax and MEC of results are shown in Figure 4. According to the identification
metal sulfide ore dust clouds and factors influencing dust results, a quantitative test and analysis of S, Fe, Si, and other
explosion parameters. Comprehensive experimental data elements were carried out; the analysis results are shown in
and phenomenon analysis of the explosion of sulfide mine Table 2. It can be seen from Figure 4 and Table 2 that all the
dust clouds are provided, and the mechanisms influencing four ore samples contain pyrite (FeS2) and silica (SiO2).
sulfide mine dust cloud explosions are revealed based on Among them, pyrite (FeS2) is the main component leading
existing theories. to fire and explosion in vulcanized mines [27].

Journal of Chemistry 3

 Adhesive
 tape

 Polyethylene film
 (a) (b) (c)

 Figure 1: Photos illustrating the field sampling steps. (a) Multipoint sampling; (b) wrap and seal; (c) mark ore sample.

 (a) (b) (c)

 (f) (e) (d)

 Figure 2: Coarse crushing process of ore samples.

2.2. Experimental Methods. Explosion pressure and MEC 10 kJ energy located in the center of the explosion chamber
are important parameters to characterize the severity of dust was ignited after a time delay of 60 ms. Furthermore, the
explosion consequences. The explosion characteristic pa- explosion pressure of metal sulfide ore dust was recorded
rameters of the metal sulfide dust ore clouds were investi- using a pressure sensor, and the trend of the explosion
gated using a 20 L explosion sphere vessel (TD-20L DG, pressure over time was recorded using a data acquisition
Safety Engineering Research Center of Northeastern Uni- system.
versity, China; implementing Standards of GB/T 16425-
1996, ISO 6184/1-1985, and ASTM E 1226-2005 [28–30]),
which comprised a 20 L stainless steel spherical container, a 2.2.1. Preparation of Ignition Head. The explosion sphere
0.6 L dust container, a dust dispersion system, a pressure vessel usually uses a chemical ignition head as the detonating
detection system, an automatic ignition system, a wireless source [32], but electric sparks are generated by a discharge
data transmission system, and a data acquisition system device as the detonating source. Among them, the explosion
(Figure 5). The explosion chamber was partially vacuumed pressure of the chemical ignition head is unstable, which
to 0.04 MPa, and the dispersing air pressure was set to needs to be checked before use. A high-frequency inter-
2.1 MPa [31]. After opening the solenoid valve, the air and ference exists in the electric spark discharge, which needs to
metal sulfide ore dust were dispersed into the explosion be filtered, and the high energy electric spark ignition circuit
chamber through high-pressure gas; a chemical igniter of needs to be improved [33]. Through comprehensive
4 Journal of Chemistry

 100 concentrations (60, 250, 500, 750, 1000, and 1500 g/m3) were
 set as the reference points of explosion pressure for the metal
 80 sulfide ore dust clouds test. The Pmax, (dP/dt)max, and Kst of
 each data point were obtained by the test. The explosibility of
 Cumulative volume (%)

 60
 the metal sulfide ore dust can be judged by analyzing these
 three explosion pressure parameters of each base point. If
 the above concentration range is explosive, the dust can
 40
 explode, and the MEC test can be carried out. Otherwise, it is
 considered that the ignition energy of 10 kJ is insufficient to
 20 ignite the sulfide dust in the range of 1500 g/m3, and the
 metal sulfide ore dust is regarded as inert dust which is not
 0 explosive [35].

 0.1 1 10 100 1000 2.2.3. Test on MEC of Metal Sulfide Ore Dust Clouds.
 Particle size (μm)
 The MEC of metal sulfide ore dust clouds was analyzed for
 A 500 B 300 C 200 the explosive test group. By referring to GB/T 16425-1996
 A 300 B 200 D 500 [28], the explosible concentration was gradually narrowed to
 A 200 C 500 D 300 the interval between the MEC and the maximum unex-
 B 500 C 300 D 200 ploded concentration in the explosion pressure test. First,
 Figure 3: The particle size analysis curves of ore samples. the maximum unexploded concentration was taken as the
 lower limit of the interval, and the integer times of 10 g/m3
 were taken to increase the test sample. When the pressure
comparison, we used the checked chemical ignition head as
 value of a certain concentration (C1) was equal to or greater
the detonating source in this study, and the fabrication
 than 0.15 MPa, the dust concentration was reduced to the
method used was as per the ISO-6184/1-1985 standard [29].
 range of 10 g/m3. If the pressure value of a certain con-
 Barium nitrate and barium dioxide were ground and
 centration (C2) was less than 0.15 MPa, repeated tests were
passed through a 200 mesh using a mortar and screened and
 needed until the three test results are less than 0.15 MPa, and
dried in a thermostatic box. Zirconium powder was flam-
 then the MEC of this sample group was between C2 and C1.
mable, so the zirconium powder stored in water was placed
in a constant temperature box. The zirconium powder was
dried at 105°C until it evaporated, and then, the temperature
 3. Results and Discussion
was adjusted to 80°C to dry the caked zirconium powder into 3.1. Test Results of Explosion Strength of Metal Sulfide Ore Dust
powder. After mixing the zirconium powder, barium nitrate Clouds. According to the experimental design, explosive
and barium peroxide in the proportion of 4 : 3 : 3 (referring pressure tests were carried out for the high sulfur group (B),
to equation (1)), weighing 2.4 g and being wrapped with medium sulfur group (C), and low sulfur group (D). Sample
around a lead wire, were used to produce an ignition head of A500 of the ultra-high sulfur group (A) was added because
10 kJ (as presented in Figure 6). Five of the ignition heads the sulfur content of the ultra-high sulfur group was higher
with the same ignition energy were randomly selected for the than 30%, which reached the sulfur concentration standard.
blank test (only ignition head, without dust injection). The The additional A500 sample was mainly used for compar-
measured explosion pressures of the ignition head are 0.1, ative analysis. A total of 10 groups were tested. By applying
0.11, 0.11, 0.12, and 0.12 MPa, which are all in the range of the explosion pressure tests, we obtained three parameters of
0.11 ± 0.01 MPa, and the ignition head meets the require- the explosive pressure of mineral sulfide ore dust. The ex-
ments of a 10 kJ ignition energy in GB/T 16425-1996 [28]. perimental results are listed in Tables 4–7.
Similarly, the ignition heads of 1 kJ, 2 kJ, 3 kJ, 4 kJ, 6 kJ, 8 kJ,
9 kJ, and 12 kJ were made for test, one ignition head under
each energy was randomly selected for blank experiment, 3.1.1. Classification of Explosion Pressure of Metal Sulfide Ore
and the characteristics of ignition head explosion with Dust Clouds. The explosion pressure of dust can be deter-
different energy are shown in Table 3. mined by the method of ISO6184/1-1985. Tables 4–7 show
 that the explosion index of each test group is not more than
 Zr + 0.26Ba NO3 2 + 0.4BaO2 + 0.14O2 0.67BaO + ZrO2
 ® (1) 8 MPa·m·s− 1, and the (dP/dt)max is not more than
 + 0.26N2 30 MPa·s− 1, which obviously conforms to the standard of St1
 (Kst � 0–20 MPa·m·s− 1; (dP/dt)max � 0–73.7 MPa·s− 1) [29].
 Therefore, for metal sulfide ore dust with a sulfur content of
 less than 37.9%, the explosion intensity is in the St1 grade,
2.2.2. Test on Explosion Pressure of Metal Sulfide Ore Dust
 which indicates weak explosive dust [29].
Clouds. The MEC of common dust is mainly concentrated
in the range from 20 to 60 g/m3, and the upper explosive
limit is concentrated in the range of 2000 to 6000 g/m3. 3.1.2. Effect of Dust Cloud Concentration on Pmax of Metal
Combined with the explosive limit range of common dust Sulfide Ore Dust Clouds. The fitting curve of explosive
and referring to GB/T 16426-1996 [34], six basic pressure for all of the metal sulfide ore dusts examined is
Journal of Chemistry 5

 6000 6000

 5000 5000

 4000 4000
 Intensity/counts

 Intensity/counts
 3000 3000

 2000 2000

 1000 1000

 0 0
 10 20 30 40 50 60 70 80 90 10 20 30 40 50 60 70 80 90
 2θ (°) 2θ (°)
 Al2Si2O5(OH)4 FeCO3 Al2Si2O5(OH)4
 SiO2 FeS2 SiO2
 FeS2

 (a) (b)
 15000
 6000

 12000
 5000
 Intensity/counts
 Intensity/counts

 4000 9000

 3000
 6000
 2000

 3000
 1000

 0 0
 10 20 30 40 50 60 70 80 90 10 20 30 40 50 60 70 80 90
 2θ (°) 2θ (°)
 Al2Si2O5(OH)4 FeCO3 SiO2 FeS2
 SiO2 FeS2 FeCO3 CaCO3

 (c) (d)

Figure 4: XRD spectra of four types of metal sulfide ore samples. (a) Class A ore sample; (b) Class B ore sample; (c) Class C ore sample; (d)
Class D ore sample.

 Table 2: Elemental composition of four types of metal sulfide ore dusts.
Sample type Fe S Si Al Cu Mn Zn Ti Ca K Other elements
A 38.71 34.33 3.75 1.67 0.88 0.50 0.32 0.04 0.07 0.03 19.70
B 35.90 26.95 4.55 1.46 1.06 0.39 0.15 0.05 0.09 0.00 29.40
C 24.07 19.58 16.82 6.10 0.44 0.13 0.03 0.10 0.09 1.11 31.53
D 20.43 7.65 12.02 4.05 0.47 0.82 0.06 0.10 0.14 0.87 53.39

summarized in Figure 7. In the A500 group, even at a lower analysis and fitting curves show that the Pmax of sulfide dust
concentration range of 60 g/m3, Pmax reached 0.16 MPa, and, increases rapidly in the range of 60–500 g/m3, but after the
at a higher concentration range of 1500 g/m3, did not peak concentration exceeds 500 g/m3, the rising trend of Pmax is
either, indicating that the metal sulfide ore dust in this group relatively smoother. Even when the concentration reaches
readily explodes as compared with that in the other groups. 1500 g/m3, the explosion pressure does not reach the peak
In the A500, B200, B300, B500, and C200 groups, the value, and the corresponding explosion pressure is
6 Journal of Chemistry

 Safety limit switch
 Operating handle

 Sphere outer layer
 Circulating water outlet
 Sphere inner layer

 Vacuum meter Ignition electrode

 Pressure sensor

 Observation window
 Purge inlet
 Powder storage tank
 Circulating water inlet

 Electric contact air pressure gauge
 Gas powder two-phase valve

 Base
 Dispersion valve

 Figure 5: 20 L explosion sphere vessel schematic diagram and physical diagram.

 (a) (b) (c)

 Figure 6: Fabrication of ignition heads: (a) powder charge; (b) shear cut; (c) end product.

 Table 3: Characteristics of ignition head explosion with different energy.
Ignition head energy (kJ) Ignition head powder quantity (g) Pmax (MPa) (dP/dt)max (MPa·s− 1) Kst (MPa·m·s− 1)
1 0.24 0.013 5.20 1.41
2 0.48 0.031 7.09 1.92
3 0.72 0.046 5.67 1.54
4 0.96 0.050 6.61 1.80
6 1.44 0.069 6.14 1.67
8 1.92 0.090 9.92 2.69
9 2.16 0.095 8.97 2.44
10 2.40 0.120 8.03 2.18
12 2.88 0.130 13.23 3.59

0.33 MPa, the sulfur content of group A 500 exceeds 30%, explosion sphere vessel is sufficient, and the dust clouds
and its properties belong to the sulfur concentrate. The Pmax formed do not reach the saturated concentration; therefore,
values of B200, B300, B500, and C200 groups increase first with increasing concentration, the Pmax also increases [36].
and then decrease with increasing concentration. This is When the suspended dust clouds tend to become saturated,
because when the concentration is low, the air in the 20 L there exists an optimum concentration to make the Pmax
Journal of Chemistry 7

 Table 4: Summary of explosion pressure data for A group.
 Sulfur content D50 Concentration Pmax (dP/dt)max Whether or not
Sample type Kst (MPa·m·s− 1)
 (%) (μm) (g·m− 3) (MPa) (MPa·s− 1) to explode
A500-1 60 0.16 15.59 4.23 Yes
A500-2 250 0.22 18.89 5.13 Yes
A500-3 500 0.29 15.12 4.10 Yes
 37.90 4.829
A500-4 750 0.29 17.48 4.74 Yes
A500-5 1000 0.30 27.87 7.56 Yes
A500-6 1500 0.33 19.37 5.26 Yes

 Table 5: Summary of explosion pressure data for B group.
 Sulfur content D50 Concentration Pmax (dP/dt)max Whether or not
Sample type Kst (MPa·m·s− 1)
 (%) (μm) (g·m− 3) (MPa) (MPa·s− 1) to explode
B200-1 60 0.14 16.06 4.36 No
B200-2 250 0.15 28.34 7.69 Yes
B200-3 500 0.18 14.64 3.97 Yes
 25.68 9.467
B200-4 750 0.19 15.59 4.32 Yes
B200-5 1000 0.25 12.28 3.33 Yes
B200-6 1500 0.19 25.03 6.80 Yes
B300-1 60 0.11 8.03 2.18 No
B300-2 250 0.15 16.06 4.36 Yes
B300-3 500 0.16 14.17 3.85 Yes
 26.18 6.185
B300-4 750 0.19 12.28 3.33 Yes
B300-5 1000 0.24 14.64 3.97 Yes
B300-6 1500 0.22 16.06 4.36 Yes
B500-1 60 0.11 7.09 1.29 No
B500-2 250 0.15 20.31 5.51 Yes
B500-3 500 0.19 25.51 6.92 Yes
 25.60 3.563
B500-4 750 0.20 25.03 6.80 Yes
B500-5 1000 0.21 11.81 3.21 Yes
B500-6 1500 0.18 13.23 3.59 Yes

 Table 6: Summary of explosion pressure data for C group.
 Sulfur content D50 Concentration Pmax (dP/dt)max Whether or not
Sample type Kst (MPa·m·s− 1)
 (%) (μm) (g·m− 3) (MPa) (MPa·s− 1) to explode
C200-1 60 0.13 11.81 3.21 No
C200-2 250 0.12 11.81 3.21 No
C200-3 500 0.13 12.28 3.33 No
 17.12 9.287
C200-4 750 0.16 12.28 3.33 Yes
C200-5 1000 0.15 12.75 3.46 Yes
C200-6 1500 0.12 13.23 3.59 No
C300-1 60 0.12 11.81 3.21 No
C300-2 250 0.12 10.86 2.95 No
C300-3 500 0.13 12.28 3.33 No
 15.46 6.098
C300-4 750 0.14 12.75 3.46 No
C300-5 1000 0.12 12.75 3.46 No
C300-6 1500 0.10 14.64 3.97 No
C500-1 60 0.11 7.56 2.05 No
C500-2 250 0.12 11.34 3.08 No
C500-3 500 0.13 12.28 3.33 No
 15.96 3.313
C500-4 750 0.11 11.81 3.21 No
C500-5 1000 0.13 12.28 3.33 No
C500-6 1500 0.13 15.59 4.23 No

reach its peak value. As the concentration continues to particles and the flame propagation of the explosion, and the
increase, the air in contact with the dust particle unit area is Pmax is also reduced. When the concentration exceeds the
gradually reduced, leading to the explosion of the dust upper explosion limit, the amount of air in the device is
8 Journal of Chemistry

 Table 7: Summary of explosion pressure data for D group.
 Sulfur content D50 Concentration Pmax (dP/dt)max Whether or not
Sample type Kst (MPa·m·s− 1)
 (%) (μm) (g·m− 3) (MPa) (MPa·s− 1) to explode
D200-1 60 0.12 9.45 2.56 No
D200-2 250 0.12 14.17 3.85 No
D200-3 500 0.11 13.23 3.59 No
 9.18 9.511
D200-4 750 0.11 13.23 3.59 No
D200-5 1000 0.12 11.34 3.08 No
D200-6 1500 0.098 15.59 4.23 No
D300-1 60 0.13 21.73 5.90 No
D300-2 250 0.13 15.12 4.10 No
D300-3 500 0.13 18.89 5.13 No
 9.74 7.158
D300-4 750 0.12 20.78 5.64 No
D300-5 1000 0.13 19.84 5.39 No
D300-6 1500 0.13 12.28 3.33 No
D500-1 60 0.12 10.86 2.95 No
D500-2 250 0.10 19.84 5.39 No
D500-3 500 0.12 26.92 7.31 No
 8.45 5.039
D500-4 750 0.13 19.37 5.26 No
D500-5 1000 0.13 25.98 7.05 No
D500-6 1500 0.11 21.26 5.77 No

 0.35
 Maximum explosion pressure (MPa)

 0.30

 0.25

 0.20

 0.15

 0.10

 0 200 400 600 800 1000 1200 1400 1600
 Concentration (g/m3)
 A500 C200 D300
 B200 C300 D500
 B300 C500 Critical line
 B500 D200
 Figure 7: Maximum explosion pressure fitting curve of the explosive test group.

insufficient, the dust particles can only be ignited or def- 264–1588 g/m3, 239–1676 g/m3, and 659–1029 g/m3 for the
lagrated in a small range, and the flame conduction of the B200, B300, B500, and C200 groups, respectively:
explosion is blocked, and the dust is nonexplosive. A500 y � 5.442e − 7x4 − 8.067e − 6x3 − 7.954e − 4x2
 The Pmax values of the C300, C500, D200, D300, and (2)
D500 groups were less than 0.15 MPa, and the fitting curve + 0.02304x + 0.1316 R2 � 0.9884,
was below the critical line (critical line is the Pmax � 0.15 MPa
line). When the ignition energy is 10 kJ and the Pmax of dust B200 y � − 2.584 − 6x4 + 1.273e − 4x3 − 1.84e − 3x2
≥0.15 MPa, it is considered that the dust was explosive, as
shown in [28]. MATLAB was used to fit the above data of the + 0.0126x + 0.1254 R2 � 0.9638,
A500, B200, B300, B500, and C200 groups to the fourth- (3)
degree polynomial, and the corresponding fitting
curve equation and correlation coefficient were obtained. B300 y � − 3.389e − 6x4 + 1.865e − 4x3 − 3.213e − 3x2
The equations are given in formulas (2)–(6). The correlation
 + 0.02454x + 0.08521 R2 � 0.9992,
coefficient is high. We can thus use them to calculate the
explosion concentration range, which was 151–1554 g/m3, (4)
Journal of Chemistry 9

 B500 y � − 3.163e − 7x4 + 2.228e − 5x3 − 8.033e − 4x2 dust explosion in mines with high sulfur concentrations. The
 results of the tests are shown in Table 8.
 + 0.01554x + 0.09178 R2 � 0.9952,
 (5)
 3.2.1. Classification of Explosion Sensitivity of Metal Sulfide
 C200 4 3
 y � 1.77e − 6x − 1.186e − 4x + 0.002453x 2 Ore Dust Clouds. According to the classification standard
 (6) JIS Z8817:2002 of the Japanese Industrial Standards
 − 0.0155x + 0.1463 R2 � 0.9447. Committee [37], the dust explosion sensitivity is divided
 into three grades according to the MEC, as shown in
 Table 9.
3.1.3. Effect of Sulfur Content on Pmax of Metal Sulfide Ore From Table 8, the MEC of the metal sulfide ore dust
Dust Clouds. As shown in Tables 5–7, the Pmax of group B with sulfur contents less than 26.18% is higher than 100 g/
with high sulfur content ranges from 0.11 MPa to 0.25 MPa, m3, and the explosion sensitivity is weak. It is necessary to
and that of group C with a medium sulfur content ranges form a higher dust cloud concentration before it can be
from 0.1 MPa to 0.16 MPa. Except for group C200 with high ignited to explode. However, the explosion sensitivity of the
sulfur content, both C300 and C500 groups are nonex- metal sulfide ore dust is changeable. According to the A500
plosive. The Pmax of group D with low a sulfur content group test, when the sulfur content is higher than 37.9%,
ranges from 0.098 MPa to 0.13 MPa, indicating charac- explosion can still occur at a base concentration of 60 g/m3,
teristics of nonexplosive dust. Metal sulfide ore dust with indicating that the MEC is lower than this concentration,
sulfur content higher than 17.12% can explode under an and the explosion sensitivity changes from weak to
ignition energy of 10 kJ, whereas sulfide dust with a sulfur medium.
content lower than 15.96% can not explode under an ig-
nition energy of 10 kJ. This shows that the critical sulfur
content of metal sulfide ore dust cloud explosions under an 3.2.2. Effect of Particle Size and Sulfur Content on the MEC of
ignition energy of 10 kJ is between 16 and 17%. Thus, when Metal Sulfide Ore Dust Clouds. In this test, the MEC of metal
the sulfur content of metal sulfide ore dust is higher than sulfide ore dust clouds was mainly restricted by sulfur
the critical sulfur content, it is classified as explosive dust, content and particle size. Table 8 shows that the MEC of the
and when it is lower than the critical sulfur content, it is C300 group is 640 g/m3, which is more than 400 g/m3 and
classified as nonexplosive dust. higher than that of the high sulfur group. The lower sulfur
 The results show that the color of the metal sulfide ore content weakens the explosion of sulfide dust. The lower the
dust changes from light gray to dark with increasing sulfur ignition sensitivity, the higher the MEC. For the high sulfur
content before explosion. The metal sulfide ore dust after group, the sulfur contents of the B200, B300, and B500
explosion is red and becomes darker with increasing groups are 25.68%, 26.18%, and 25.60%, respectively. The
sulfur content. As shown in Table 2, through elemental error of the sulfur content in these groups is less than 0.5%,
analysis of the metal sulfide ore dust before explosion, we which can, thus, be regarded as having the same sulfur
found that the proportion of Fe elements in the metal content. Although the MEC of B500 is about 30 g/m3 lower
sulfide ore dust is largest and that an increase in the sulfur than that of B200 in the high sulfur group, the MEC is not
content in all test groups resulted in a greater proportion completely decreased with decreasing particle size. However,
of Fe elements. Therefore, the main participants in the the MEC of the B300 group with a particle size of 6.185 μm is
explosion are the sulfur compounds in the metal sulfide approximately 150 g/m3. These results show that when the
ore dust. Because Fe2+ in the sulfur compounds in the particle size is less than 10 μm, the explosion sensitivity of
metal sulfide ore dust is oxidized during explosion, oxides sulfide dust is strongest, and the MEC is lowest when the
of Fe3+ are generated, which make the powder of the metal particle size is less than 10 μm.
sulfide ore dust after the explosion brown. As the content The cause for these patterns is that when the particle size
of Fe increases with increasing sulfur content, and the is high, more ore dust particles settle after powder spraying
color of the metal sulfide ore dust after the explosion to form unstable ore dust clouds. Wang. et al. [38] hy-
becomes more red. To verify this experimental phe- pothesized that as dust particle size decreases, its specific
nomenon, we characterized the explosion product. The area increases, the total contact area with oxygen in the air
characterization results are shown in Figure 8. Fe2O3 was increases, and the diffusion time of oxygen to the surface of
present in the product, which is consistent with the the dust particles decreases, the phenomenon of insufficient
analysis results. combustion in dust particles due to anoxia is effectively
 weakened, and combustion is accelerated. Therefore, as
 particle size decreases, MEC also decreases. When the
3.2. Test Results of the MEC of Metal Sulfide Ore Dust Clouds. particle size is small enough (less than 10 μm), the ore dust
The results of Tables 5–6 show that the B200, B300, B500, can form stable mine dust clouds, which are, however, re-
and C200 groups can explode at a certain dust concentra- stricted by the powder spraying effect. The optimal particle
tion. Therefore, the above four groups were tested, and the size can form favorable dust turbulence, increasing the
MECs were obtained. The results provide a basis for con- propagation efficiency of the explosion flame and reducing
trolling sulfide dust concentration and preventing sulfide the corresponding MEC.
10 Journal of Chemistry

 3500

 3000

 2500

 Intensity/counts
 2000

 1500

 1000

 500

 0
 10 20 30 40 50 60 70 80 90
 2θ (°)
 SiO2 ZrO2
 FeS2 Fe2O3
 BaZrO3

 Figure 8: XRD spectra of the explosion product of the metal sulfide ore dust.

 Table 8: MEC of the metal sulfide ore dust clouds.
Sample type Sulfur content (%) Dust particle size D50 (μm) MEC (g/m3)
B200 25.68 9.467 230
B300 26.18 6.185 150
B500 25.60 3.563 200
C200 17.12 9.287 640

 Table 9: Classification of dust explosion sensitivity.
 3
Cmin (g/m ) ≥100 45∼100 ≤45
Explosion sensitivity Weak Medium Strong

4. Conclusions explosion will occur in the low sulfur group, indi-
 cating that the low sulfur group is inertial dust.
The main results of the study are as follows: (4) The explosion sensitivity of metal sulfide ore dust is
 (1) By analyzing the (dP/dt)max and Kst of metal sulfide proportional to the sulfur content. The higher the
 ore dust clouds, we classified the explosive intensity sulfur content, the stronger the explosion sensitivity.
 of metal sulfide ore dust clouds. The results show that (5) The MEC of the metal sulfide ore dust is inversely
 metal sulfide ore dust clouds are of St1 grade and proportional to the sulfur content, i.e., the higher the
 weak explosive dusts. sulfur content, the lower the MEC. When the particle
 (2) With increasing concentration, the Pmax of the ex- size is less than 10 μm (the optimum particle size is
 plosive test group increased at first and then de- approximately 6.185 μm), the corresponding MEC is
 creased, whereas the Pmax of the unexploded test lowest at approximately 150 g/m3. As particle size
 group showed a discrete distribution, and no obvious decreases, MEC also decreases.
 trend was noted. (6) The results are valuable for the prevention and
 (3) The critical sulfur content for explosion in the metal control of metal sulfide ore dust explosions. How-
 sulfide ore dust clouds under 10 kJ ignition energy is ever, explosion dynamics and thermodynamics are
 approximately 16–17%. Metal sulfide ore dust with a not analyzed. We will overcome these limitations in
 sulfur content higher than the critical one is ex- future studies.
 plosive dust, and metal sulfide ore dust with a lower
 sulfur content than the critical one is nonexplosive Data Availability
 dust. The analysis results show that the explosion of
 the ultra-high sulfur group is strongest. Explosion The data used to support the findings of this study are in-
 may occur in the middle sulfur group, and no cluded within the article.
Journal of Chemistry 11

Conflicts of Interest [16] Q. Li, B. Lin, W. Li, C. Zhai, and C. Zhu, “Explosion char-
 acteristics of nano-aluminum powder-air mixtures in 20L
The authors declare that they have no conflicts of interest. spherical vessels,” Powder Technology, vol. 212, no. 2,
 pp. 303–309, 2011.
Acknowledgments [17] J. Zhang, P. Xu, L. Sun, W. Zhang, and J. Jin, “Factors
 influencing and a statistical method for describing dust ex-
This work was sponsored by the National Natural Science plosion parameters: a review,” Journal of Loss Prevention in
Foundation of China (51874149 and 51364010). The authors the Process Industries, vol. 56, pp. 386–401, 2018.
are also thankful to the Associate Professor Sheng-nan Ou, [18] M. Mittal, “Explosion characteristics of micron- and nano-
University of Science and Technology Beijing for assistance size magnesium powders,” Journal of Loss Prevention in the
 Process Industries, vol. 27, no. 1, pp. 55–64, 2014.
with 20 L explosion sphere vessel analysis.
 [19] Y. Z. Rao, Z. J. Liu, X. M. Hong, M. S. Yang, and B. Chen,
 “Effect of sulfur content on minimum ignition energy of
References sulfide dust clouds,” Metal Mine, vol. 47, no. 4, pp. 173–177,
 2018.
 [1] D. K. Nordstrom, Sulfide Mineral Oxidation, Geological
 [20] H. L. Shang, F. C. Yang, R. M. Xiang et al., “Influence of
 Survey, Boulder, Co, USA, 2011.
 particle size polydispersity on coal dust explosibility,” Journal
 [2] R. Walker, A. D. Steele, and D. T. B. Morgan, “Pyrophoric
 nature of iron sulfides,” Industrial & Engineering Chemistry of Loss Prevention in the Process Industries, vol. 56, pp. 444–
 Research, vol. 35, no. 5, pp. 1747–1752, 1996. 450, 2018.
 [3] X. Sun, Y. Z. Rao, C. Li, and S. Ma, “Test study on minimum [21] X. X. Ma, Y. Yu, Q. W. Zhang, Y. H. Li, and F. F. Liu,
 ignition temperature of sulfide ore dust cloud,” Metal Mine, “Experimental study on the impact of the concentration on
 vol. 6, pp. 175–179, 2017. the explosion characteristic feaures of rubber,” Journal of
 [4] T. Chen, Q. Zhang, J. Wang, L. Liu, and S. Zhang, “Flame Safety and Environment, vol. 17, no. 4, pp. 1313–1316, 2017.
 propagation and dust transient movement in a dust cloud [22] Y. S. Zhao, J. Q. Fan, J. P. Bai, C. Zeng, and Y. Wang, “In-
 explosion process,” Journal of Loss Prevention in the Process fluence of dust concentration on flow field characteristics of
 Industries, vol. 49, pp. 572–581, 2017. sulfur dust during dispersion process in 20L spherical tank,”
 [5] E. Danzi and L. Marmo, “Dust explosion risk in metal Journal of Safety Science and Technology, vol. 14, no. 7,
 workings,” Journal of Loss Prevention in the Process Industries, pp. 48–52, 2018.
 vol. 61, pp. 195–205, 2019. [23] C. C. Wu, The Theoretical Basis and Application of the
 [6] S. Azam and D. P. Mishra, “Effects of particle size, dust Combustion and Explosion, Chemical Industry Press, Beijing,
 concentration and dust-dispersion-air pressure on rock dust China, 2016.
 inertant requirement for coal dust explosion suppression in [24] H. Liu, C. Wu, F. Q. Yang, W. Pan, and M. Li, “Detection of
 underground coal mines,” Process Safety and Environmental spontaneous combustion of sulfide ores with infrared thermal
 Protection, vol. 126, pp. 35–43, 2019. imaging method,” Journal of Central South University (Science
 [7] Y. Z. Rao, Studies on Mechanism and Contral Technology of and Technology), vol. 42, no. 3, pp. 1425–1430, 2011.
 Sulphide Dust Explosion, Central South University, Changsha, [25] GB/T 2462, China Standards, Pyrites and Concentrate
 China, 2018. Determination of Effective Sulfur Content Combustion
 [8] R. Soundararajan and P. R. Amyotte, “Explosibility hazard of Neutralization Method, State Bureau of Technical Super-
 iron sulphide dusts as a function of particle size,” Journal of vision, Beijing, China, 1992.
 Hazardous Materials, vol. 51, no. 1–3, pp. 225–239, 1996. [26] GB/T 6003.1, China Standards, Test Sieves—Technical Re-
 [9] A. H. Liu, J. Y. Chen, and X. F. Huang, “Explosion parameters quirements and Testing—Part 1: Test Sieves of Metal Wire
 and combustion kinetics of biomass dust,” Bioresource Cloth, Standardization Administration of China, Beijing,
 Technology, vol. 294, Article ID 122168, 2019. China, 2012.
[10] Q. Liu and P. D. Katsabanis, “Hazard evaluation of sulphide [27] R. Soundararajan, Characterization of the Dust Explosility of
 dust explosions,” Journal of Hazardous Materials, vol. 33, the Iron Sulphides: FeS and FeS2, Ph.D. thesis, Technical
 no. 1, pp. 35–49, 1993. University of Nova Scotia, Halifax, Canada, 1995.
[11] Y. Q. Yu and J. C. Fan, “Research on explosion characteristics [28] GB/T 16425, China Standards, Determination for Minimum
 of sulfur dust and risk control of the explosion,” Procedia Explosive Concentration of Dust Clouds, State Bureau of
 Engineering, vol. 84, pp. 449–459, 2014. Technical Supervision, Beijing, China, 1996.
[12] J. Yuan, W. Huang, B. Du, N. Kuai, Z. Li, and J. Tan, “An [29] IX-ISO ISO: 6184/1, Explosion Protection Systems-Part 1:
 extensive discussion on experimental test of dust minimum Determination of Explosion Indices of Combustible Dusts in
 explosible concentration,” Procedia Engineering, vol. 43, Air, International Organization for Standardization,
 pp. 343–347, 2012. Switzerland, 1985.
[13] J. Q. Fan, J. P. Bai, Y. S. Zhao, W. C. Yuan, Y. L. Wang, and [30] ASTM E 1226, USA Standards, Test Method for Pressure and
 F. Xiang, “Experimental study of factors influencing explosion Rate of Pressure Rise for Combustible Dusts, American Society
 characteristics of sulfur dust,” China Safety Science Journal, for Testing and Materials, West Conshohocken, PA, USA,
 vol. 28, no. 2, pp. 81–86, 2018. 2005.
[14] Y. R. He, S. B. Zhu, M. X. Li, Q. Q. Wu, Y. Cao, and Z. Zhou, [31] Q. Li, K. Wang, Y. Zheng, X. Mei, and B. Lin, “Explosion
 “Experimental study and numerical simulation of effect of severity of micro-sized aluminum dust and its flame propa-
 coal particle size on dust cloud explosion,” China Safety gation properties in 20 L spherical vessel,” Powder Technology,
 Science Journal, vol. 27, no. 1, pp. 53–58, 2017. vol. 301, pp. 1299–1308, 2016.
[15] P. Bagaria, S. Prasad, J. Z. Sun, R. Bellair, and C. Mashuga, [32] R. Cui and W. Y. Cheng, “Influence of ignition energy on
 “Effect of particle morphology on dust minimum ignition explosion behavior of pulverized coal,” Safety in Coal Mines,
 energy,” Powder Technology, vol. 355, pp. 1–6, 2019. vol. 4, no. 4, pp. 16–19, 2017.
12 Journal of Chemistry

[33] C. L. Ren, Experimental Investigation and Numerical Simu-
 lation of Minimum Ignition Energy of Dust Cloud, North-
 eastern University, Shenyang, China, 2011.
[34] GB/T 16426, China Standards, Determination for Maximum
 Explosion Pressure and Maximum Rate of Pressure Rise of Dust
 Clouds, 1996.
[35] Q. Z. Li, C. Zhai, H. J. Wu, B. Q. Lin, and C. J. Zhu, “In-
 vestigation on coal dust explosion characteristics using 20L
 explosion sphere vessels,” Journal of China Coal Society,
 vol. 36, no. Supp. 1, pp. 119–124, 2011.
[36] D. Wu, W. Ferens, and K. M. Czajka, “Explosion study on the
 minimum ignition temperature of coal dust clouds in oxy-
 fuel combustion atmospheres,” Journal of Hazardous Mate-
 rials, vol. 84, pp. 330–339, 2014.
[37] JIS Z 8817, Japanese Standards, Test Method for Minimum
 Explosible Concentration of Combustible Dusts, Japanese
 Industrial Standards Committee, Tokyo, Japan, 2002.
[38] L. Y. Wang, R. Q. Lyu, and H. B. Deng, “Study on charac-
 teristics of explosion and explosion suppression for magne-
 sium–aluminum alloy dust with different particle size,”
 Journal of Safety Science and Technology, vol. 13, no. 1,
 pp. 34–38, 2017.
You can also read