Basingstoke and Deane - Equality and Diversity Information 2019
←
→
Page content transcription
If your browser does not render page correctly, please read the page content below
Basingstoke and Deane
Equality and Diversity Information
              2019

                                     1
Overview
The following information has been collected to improve the council’s understanding of
Basingstoke and Deane’s local communities. This data is used to better target services and to
inform service provision in the local area. The council is also required to publish this information
annually as part of the specific ‘Public Sector Equality Duty’, which forms part of the Equality Act
2010 (for more information go to http://www.basingstoke.gov.uk/browse/community-and-
living/equality-and-diversity).
This document provides an overview of the local population in the borough and brings together
information on each of the nine ‘protected characteristics’ identified in the Equality Act 2010,
namely:
Age
Disability
Race
Sex
Gender reassignment
Marriage and civil partnership
Pregnancy and maternity
Religion or belief (or lack of belief)
Sexual orientation
It also provides general information on health inequalities, unemployment and equality and
diversity information relating to service provision. This includes:
Information about the council’s activities with protected characteristics groups.
Access to services and research with service users from protected characteristics groups.
Customer satisfaction and equality performance monitoring.
Records of how the council has paid due regard to the general aims of the Public Sector
Equality Duty when making decisions about the services it offers.
Policies, plans and programmes that address equality concerns raised by service users.
General information on the council’s potential and actual service users.
2Key findings
Some of the key findings from the research are listed below (specific percentages are detailed in
the main body of the report). These trends have implications for the design and provision of all
services in the local area (e.g. council, education, health etc.):
Age
The borough has a higher percentage of children under 15 and middle-aged adults than any
other broad age groups.
There are lower percentages of people in their late-teens and early twenties, which reflect the
absence of a higher education establishment in the borough.
The number and percentage of residents of post-retirement age (65 and over) has gradually
increased in recent years and is projected to continue to rise in the future.
Disability
Approximately one fifth of households in Basingstoke and Deane had one or more persons
with a long-term health problem or disability in 2011.
Race
The percentage of ethnic minority groups in the borough almost doubled from 2001 to 2011.
The groups that saw the highest growth were Asian/Asian British residents, however a change
in definition added to this growth.
There has been a consistent growth of the Indian community in the borough over recent
decades and numbers more than doubled from 2001 to 2011. More recently, there has been
an expansion of Polish and Nepalese communities.
The 2011 Census showed that there is variation in the proportion of the population in different
ethnic groups by age. For example the White Irish population has a much older age structure
than the Mixed/multiple ethnic group population.
Sex
The local population is made up of approximately half males and half females.
Below the age of 20, the percentage of males in the borough is slightly higher than that of
females. Above the age of 65, the percentage of females is slightly higher than that of males.
Gender reassignment
Local information on transgender individuals to date is limited. The council works with the local
LGBTQ+ Forum to better understand the numbers and needs of this group.
Marriage and civil partnership
From 2001 to 2011, there was a slight increase in the percentage of adults who were divorced
and a marginal decline in the percentage of residents who were married.
Single residents, who have never been in a legal relationship, form an increasing percentage of
the adult population.
The proportion of households occupied by only one person has increased, whilst the proportion
occupied by families has declined slightly.
Pregnancy and maternity
Over the last decade, the number of births in the borough has decreased 2.5%. The number of
births in 2017 was the lowest recorded since 2006.
The number of conceptions to females aged under 18 in the borough has been in general
decline over the last ten years.
Almost a quarter of all births in the borough in 2017 were to non-UK born mothers.
3Religion or belief (or lack of belief)
From 2001 to 2011, the percentage of people who describe themselves as Christian has
declined slightly and there has been an increase in the percentage of people that stated that
their religion was ‘other than Christian’.
The percentage of residents who stated they had no religion at 2011 was almost double that in
2001. The percentage of residents who stated they had no religion almost doubled from 2001
to 2011.
Older residents were more likely to describe themselves as Christian, whilst younger residents
were more likely to follow other religions or not have a religion.
Sexual orientation
The exact numbers of residents who describe their sexual orientation as Lesbian, Gay or
Bisexual is still unclear, which is largely due to under-reporting of information. The council
works with the local LGBTQ+ Forum to better understand the numbers and needs of this
group.
41. Age
The latest official Mid-Year Estimates (for 2017), produced by the Office for National Statistics
(ONS), provide an age profile of the borough’s population, which can be compared with the
profiles for South East England, and for England and Wales as a whole.
Source: 2017 Mid-Year Estimates, ONS
It is clear that the borough has a higher percentage of children under 15 and middle-aged
adults. There are lower percentages of people in their late-teens/early twenties (reflecting the
absence of a higher education establishment in the borough), and in the post-retirement
groups. The percentage of residents aged 65 and over stands at 16.9% of the total borough
population, which has increased over the last 16 years from the 2001 Census figure of 12.4%.
This can also be expressed in terms of broad age groups:
20.1% of residents in Basingstoke and Deane are under 16
higher than Hampshire (18.4%), South East (19.1%) or England and Wales (19.1%)
averages;
62.9% of residents in Basingstoke and Deane are aged 16 to 64
higher than Hampshire (60.4%), South East (61.8%) or England and Wales (62.8%)
averages;
16.9% of residents in Basingstoke and Deane are aged 65+
lower than Hampshire (21.2%), South East (19.1%) or England and Wales (18.2%)
averages;
2.0% of residents in Basingstoke and Deane are aged 85+
5 lower than Hampshire (3.0%), South East (2.8%) or England and Wales (2.4%)
averages.
Population projections for Basingstoke and Deane suggest that the population will continue
to age, with the number of people aged 65 and over expected to increase by 64.8% (18,940
people) from 2016 to 2041, whilst the percentage age 65 and over increases by 49.5%
(from 16.7% to 24.9%).
2. Disability
The latest available Census data from 2011, together with more recent claimant counts for key
benefits and allowances, provide an indication of the numbers of people in the borough who
are disabled or of poor health. Where possible, this information has been compared to county
wide, regional and national data:
Disability Statistics
21.2% of households (14,663) in Basingstoke and Deane had one or more persons with a
long-term health problem or disability at 2011 Census
lower than Hampshire (23.4%), South East (23.6%) or England and Wales (26.0%);
5.6% of residents (9,326) in Basingstoke and Deane described themselves as suffering
from a long-term health problem or disability which limited day-to-day activities a lot
at 2011 Census
lower than Hampshire (6.7%), South East (6.9%) or England and Wales (8.5%);
The percentage that described themselves as suffering from a long-term health
problem or disability which limited day-to-day activities a lot at the 2011 Census
increased with age. 1.4% of residents (469) in Basingstoke and Deane aged 0 to 15 and
20.1% of residents (4,890) aged 65 and over described themselves in this way.
Aged 0 to 15 figures are similar to Hampshire (1.4%), South East (1.4%) or England
and Wales (1.6%), whilst the aged 65 and over figures are lower than Hampshire
(21.2%), South East (22.6%) or England and Wales (27.3%);
8.0% of residents (13,402) in Basingstoke and Deane described themselves as
suffering from a long-term health problem or disability which limited day-to-day
activities a little at 2011 Census
lower than Hampshire (9.1%), South East (8.8%) or England and Wales (9.4%);
25.1% of residents aged 65 and over (6,056) in Basingstoke and Deane described
themselves as suffering from a long-term health problem or disability which limited
day-to-day activities a little at 2011 Census
lower than Hampshire (25.2%), South East (25.3%) or England and Wales (26.3%);
1.8% of residents (2,988) in Basingstoke and Deane provided 50 or more hours unpaid
care a week at 2011 Census, 34.5% of these residents (1,031) were aged 65 and over;
6 lower than Hampshire (2.0%), South East (2.0%) or England and Wales (2.4%);
1.0% of residents (1,697) in Basingstoke and Deane provided 20 to 49 hours unpaid
care a week at 2011 Census, 21.0% of these residents (356) were aged 65 and over;
lower than Hampshire (1.1%), South East (1.1%) or England and Wales (1.4%);
6.3% of residents (10,548) in Basingstoke and Deane provided 1 to 19 hours unpaid
care a week at 2011 Census, 16.1% of these residents (1,703) were aged 65 and over;
lower than Hampshire (7.0%), South East (6.7%) or England and Wales (6.5%).
Benefits and Allowances
2.1% (3,680) of residents in Basingstoke and Deane were claiming Disability Living
Allowance (DLA) at May 2018
similar to Hampshire (2.2%), and lower than South East (2.5%) or England and
Wales (2.9%);
1.7% (3,030) of residents in Basingstoke and Deane were claiming Personal
Independence Payments (PIP) at May 2018
similar to Hampshire (1.8%), and lower than South East (1.9%) or England and
Wales (2.8%);
2.2% (3,910) of residents in Basingstoke and Deane were claiming Employment and
Support Allowance (ESA) at May 2018
the same as Hampshire (2.2%), and lower than South East (2.5%) or England and
Wales (3.4%);
0.1% (90) of residents in Basingstoke and Deane were claiming Incapacity Benefit or
Severe Disability Allowance at May 2018
the same as Hampshire (0.1%), the South East (0.1%) and England and Wales
(0.1%);
0.8% (1,420) of residents in Basingstoke and Deane were claiming Carer’s Allowance at
May 2018
Similar to Hampshire (0.9%), and lower than the South East (1.0%) or England and
Wales (1.3%);
1.7% (2,900) of residents in Basingstoke and Deane were claiming Attendance Allowance
at May 2018
lower than Hampshire (1.9%), South East (2.0%) or England and Wales (2.2%);
At January 2019, there were estimated to be around 6,360 Blue Badge holders living in
Basingstoke and Deane, based on the postcode sectors that cover the borough.
3. Race
7The latest available Census data provides a comprehensive picture of the race and ethnicity of
residents in the Borough at 2011.
At the 2011 Census, 88.2% of the borough population (148,078 people) described
themselves as White English/Welsh/Scottish/Northern Irish/British;
this compares with 91.8% in Hampshire, 85.2% in South East, and 80.5% in England
and Wales, placing Basingstoke and Deane midway between county and regional
averages.
The only other ethnic groups to exceed 1,000 population in the borough at 2011 were:
White Irish at 1,324 (0.8%);
Other White at 6,323 (3.8%) – lower than South East or England and Wales (both
4.4%):
Including 1,765 Polish (1.1%);
Mixed/multiple: White and Black Caribbean at 1,047 (0.6%);
Indian at 2,437 (1.5%) – lower than South East (1.8%) or England and Wales (2.5%);
Chinese at 1,221 (0.7%);
Other Asian at 2,338 (1.4%):
Including 1,053 Nepalese (0.6%);
Black African at 1,259 (0.8%) – lower than South East (1.0%) or England and Wales
(1.8%);
all these percentages are higher than Hampshire averages;
unless otherwise stated, percentages are similar to national and regional averages.
At the 2011 Census, 11.8% of the borough population were from ethnic minority groups (other
than White British), compared to 6.5% in the 2001 Census. Other specific trends from 2001 to
2011 include:
The number of White Other residents more than doubled to well over 6,000;
The number of Asian/Asian British residents increased to reach nearly 5,500, almost
three times as many as in 2001. However, this is partly due to definitional changes that
saw the Chinese ethnic group move from Other to Asian;
The number of Mixed/multiple ethnic group residents increased to reach over 2,800 (a
65% increase);
The number of Black or Black British residents nearly doubled to exceed 1,900;
Likewise, the number of residents described as Chinese or Other Ethnic Group also
nearly doubled to close on 1,700. Again this is due to definitional changes and where
Chinese responses are allocated;
Finally, the number of White Irish residents witnessed a decline.
2011 Census data provided an age breakdown for each ethnic group. The chart below shows
the population within each ethnic group by broad age band.
8Source: 2011 Census, ONS
For each ethnic group, the table below expresses the percentage of the population by sex and
broad age group.
Age 0 to 15 Age 16 to 64 Age 65+
Ethnic group
Males Females Males Females Males Females
All categories: Ethnic group 10.4% 9.8% 32.6% 32.8% 6.6% 7.8%
White:
English/Welsh/Scottish/Northern 10.2% 9.6% 32.5% 32.3% 7.0% 8.4%
Irish/British
White: Irish 2.5% 1.7% 31.6% 30.0% 15.9% 18.3%
White: Gypsy or Irish Traveller 13.5% 12.3% 36.2% 31.9% 2.5% 3.7%
White: Other White 8.0% 6.8% 35.1% 44.6% 2.0% 3.4%
Mixed/multiple ethnic group:
23.5% 24.4% 24.3% 24.4% 1.2% 2.3%
White and Black Caribbean
Mixed/multiple ethnic group:
26.1% 32.7% 20.8% 19.8% 0.3% 0.3%
White and Black African
Mixed/multiple ethnic group:
29.3% 25.7% 22.4% 19.0% 0.8% 2.8%
White and Asian
Mixed/multiple ethnic group:
23.9% 18.6% 25.0% 27.2% 1.9% 3.4%
Other Mixed
Asian/Asian British: Indian 12.5% 11.7% 36.3% 34.1% 3.0% 2.5%
Asian/Asian British: Pakistani 19.3% 16.5% 33.9% 28.5% 0.8% 1.0%
Asian/Asian British: Bangladeshi 13.6% 14.8% 34.5% 33.6% 1.8% 1.5%
Asian/Asian British: Chinese 10.3% 8.6% 37.4% 40.0% 1.9% 1.8%
Asian/Asian British: Other Asian 11.8% 10.2% 32.0% 41.7% 2.0% 2.2%
9Black/African/Caribbean/Black
13.2% 15.3% 36.1% 34.6% 0.6% 0.4%
British: African
Black/African/Caribbean/Black
6.4% 4.3% 39.4% 32.1% 9.1% 8.7%
British: Caribbean
Black/African/Caribbean/Black
10.0% 15.6% 41.7% 27.2% 2.8% 2.8%
British: Other Black
Other ethnic group: Arab 9.4% 16.7% 34.1% 34.8% 3.6% 1.4%
Other ethnic group: Any other
10.1% 10.1% 33.0% 41.7% 3.0% 2.1%
ethnic group
Source: 2011 Census, ONS
It can be seen that the age/sex breakdown of many ethnic groups differs significantly from that
of the White British population.
The White Irish population has a very low percentage of children aged under 16, and
relatively high percentages of both males and females aged 65 and over.
The White Other group has lower than average percentages of children, high
percentages of females aged 16 to 64, and low percentages of males and females aged
65 and over.
All mixed/multiple ethnic groups tend to have very high percentages of children, and
very low percentages of males and females aged 65 and over.
All Asian/Asian British groups also tend to have very low percentages of males and
females aged 65 and over.
The Asian/Asian British Pakistani population, and to a lesser extent the Asian/Asian
British Bangladeshi and Asian/Asian British Indian groups, tend to have relatively high
percentages of children aged under 16.
The Asian/Asian British Chinese and Other Asian/Asian British groups have relatively
high percentages of females aged 16 to 64.
The Black/Black British African population has a high percentage of children, and very
low percentages of males and females aged 65 and over.
The Black/Black British Caribbean population has a relatively low percentage of
children aged under 16, and higher percentages of males than females throughout all
age groups.
The annual school census provides information on ethnicity of school pupils. Data from
Hampshire County Council for Basingstoke and Deane shows that:
19.4% of school pupils had a non-White British ethnicity in 2018, more than double the
8.9% seen in 2007.
10 The number of pupils with White British ethnicity declined between 2007 and 2016 but
has been stable since then.
Behind White British, the second largest ethnic group in Basingstoke and Deane schools in
2018 was Any other White background, followed by Indian and Any other mixed
background.
The number of pupils with Gypsy/Roma ethnicity more than quadrupled from 2007 to 2018
(from 15 to 80), whilst those with Pakistani (from 25 to 85), Black African (110 to 360) and
White and Black African (from 45 to 135) ethnicities tripled (numbers rounded to the
nearest 5 pupils).
For more information about local work with Black and Ethnic Minority groups in the borough,
please see the Basingstoke Multicultural Forum webpage:
http://www.bmforum.org.uk/demoV1/index.html
Migration
There are a variety of migration data sources available, all of which indicate trends in migration
into Basingstoke and Deane which reflect the changing patterns of ethnic groups shown above.
Although these data sources are useful, it is important to note that they all have their limitations
and none of them provide precise numbers of people from a particular country at a particular
point in time. Some key points available from each data source are shown below.
The 2001 and 2011 Censuses asked respondents whether they lived at a different
address a year before census day, and if so to give that address.
The 2011 Census showed that 1,360 people moved to Basingstoke and
Deane from an address outside the UK between March 2010 and 2011,
compared to 992 people in the 2001 Census.
This was a total of 0.81% of the borough’s residents, compared to 0.65% in
2001.
The greatest numbers from outside the UK came from India (143 people),
Poland (106), Nepal (98), Australia (82), USA (72), Spain (70), France (64) and
China (62).
National Health Service GP register: the number of patients whose previous address was
outside the UK (irrespective of country of birth or ethnicity) increased within Basingstoke
and Deane between 2003 to 2007 to peak at 1,630, the numbers then declined before
increasing again to peak at 1,550 in 2015 to 2016, the number have since fallen slightly.
This pattern was the same for Hampshire as a whole.
National Insurance Number (NINO) allocations to overseas nationals registering to
work or claim benefits in the UK (irrespective of where they end up living or how long they
remain):
Department for Work and Pensions data shows that NINOs in the borough peaked
in 2007, most likely due to increased migration from a number of Eastern European
11countries after 2004. This trend was the same for Hampshire as a whole but
numbers in England and Wales peaked in 2015;
Basingstoke and Deane experienced a renewed increase in Eastern European
migration from 2013 to 2015, but the numbers have declined since then. A similar
trends was seen for most parts of Hampshire;
The two nationalities with the largest number of NINO allocations in Basingstoke
and Deane over the period 2002 to 2018 (first three quarters) were Poland and India.
This trend was the same for a number of Local Authorities in Hampshire;
NINO allocations to people of Nepali nationality, whilst not on the same scale as in
Rushmoor, have been higher in Basingstoke and Deane than in other Hampshire
districts since 2006. Those with Nepali nationality were the fourth largest number of
allocations in Basingstoke and Deane between 2002 and 2018 (first three quarters).
As of January 2014, Romanian and Bulgarian citizens are entitled to free movement
within the European Union and therefore within the UK and Basingstoke and Deane.
The data for 2014 to 2018 (first three quarters) shows that there has been an increase
in the number of NINOs allocated to those with Romanian and Bulgarian nationality,
particularly Romanian nationally. Those with Romanian nationality saw the largest
number of NINO allocations in the first three quarters of 2018.
The Worker Registration Scheme (WRS) was introduced in May 2004 to regulate
access to the labour market by individuals from the European Union Accession
countries. The Scheme ran until April 2011:
Local Government Association data showed that as within Hampshire as whole,
WRS registrations in the borough peaked around 2006 to 2007 and increased
again towards the end of 2010;
80% of WRS registrations in the borough between April 2006 and March 2011
were to Polish nationals.
School Census data is collected annually, for every pupil in Local Authority education.
It includes information on their age, ethnicity, first language and home postcode:
Hampshire school census data for children aged 5 to 15 shows that children with
English as an additional language at Basingstoke and Deane schools
accounted for around 21.9% of the overall total for the county in 2018.
There were approximately 108 different languages spoken by children and
young people within the Borough in 2018, compared to around 70 in 2007.
Approximately 10.5% of the pupils had English as an additional language
(compared to 4.5% in 2007).
The numbers of pupils with a first language from non-UK countries increased
by a larger number in Basingstoke and Deane between 2007 and 2018 than in
any other Hampshire district.
The top three non-English main languages in Basingstoke and Deane in 2018
were Polish, Nepali and Hindi.
Many languages saw substantial increases in the number of pupils from 2007
to 2018, including Hindi (an increase of over 15 times its size from less than 10
to almost 110 pupils), Italian (an increase of over nine times its size rising from
less than 10 to around 55 pupils) and Polish (an increase of over 8 times its size
12rising from around 70 to 580 pupils) (all numbers rounded to the nearest five
pupils).
Births to Mothers born outside the UK, which are recorded annually:
The Office for National Statistics Vital Statistics data shows that the number of
births in Basingstoke and Deane to mothers born outside the UK has more than
tripled between 2001 and 2017, similar to rates of increase in Southampton,
and faster than other Hampshire districts;
24.6% of all births in the borough in 2017 were to non-UK born mothers, which is
higher than most Hampshire districts (apart from Rushmoor – which at 33.8% is above
the England and Wales average (28.4%), and lower than Southampton (35.4%)).
Gypsies and Travellers
School Census figures from 2018 record approximately 100 children from Gypsy Roma or
Irish Traveller Heritage in Basingstoke and Deane schools, an increase from 25 in 2007. As
this data only includes children, it is not representative of the number of adults from these
communities. There is limited information about the number of Gypsies and Travellers in
the borough at any one time, however, the 2011 Census recorded that there were 163
Gypsies and Irish Travellers.
4. Sex
The latest official Mid-Year Estimates for 2017 indicate that the Basingstoke and Deane
population consisted of about 86,840 males (49.5%) and 88,500 females (50.5%)
whilst the higher proportion of females to males is typical nationally, the difference in
Basingstoke and Deane is less marked than in Hampshire (51.0%), the South East
(50.7%), and similar to England and Wales (50.6%);
Below age 20, the percentage of males in the borough is higher than that of females:
12.6% of the overall population being males under 20, and 11.8% females
a similar pattern is found in Hampshire (11.7% males, 11.1% female), the South East
(12.3%,11.6%), and England and Wales (12.1%, 11.5%);
Above age 65, the percentage of females is higher than that of males: 9.1% of the
overall population being females over 65, and 7.8% males; likewise, above age 80, females
represent 2.4% of the overall population and males only 1.7%
these are lower percentages than those found in Hampshire (11.6% females aged
65 and over, 9.6% male), the South East (10.5%, 8.7%), and England and Wales
(9.9%, 8.3%).
13Source: 2017 Mid-Year Estimates, ONS
5. Gender reassignment
Gender reassignment, is defined by the Equality and Human Rights Commission as ‘the
process of transitioning from one gender to the other’. The more commonly used term,
‘transgender’, is an umbrella term for people whose gender identity and/or gender expression
differs from their birth sex.
The Gender Identity Research and Education Society published ‘Gender Variance in the UK’ in
June 2009. This report estimates that the prevalence of those that have ‘presented’ with
gender dysphoria in Hampshire is 25 per 100,000 people. Using this prevalence, it is
estimated that the number of people aged 16 and over that have ‘presented’ with gender
dysphoria in Basingstoke and Deane may be around 40 people (rounded to the nearest 10
people).
The Gender Identity Research and Education Society created a quick guide to monitoring in
2015. This stated that:
“Before starting to monitor, organisations may estimate the number of gender nonconforming
employees and service users, based on the information that GIRES assembled for the Home
Office and subsequently updated: gender nonconforming to some degree (1%); likely to seek
medical treatment for their condition at some stage (0.2%); receiving such treatment already
(0.03%); having already undergone transition (0.02%); having a GRC (0.005%); likely to begin
treatment during the year (0.004%). The number who have sought treatment seems likely to
continue growing at 20% per annum or even faster. Few younger people present for treatment
despite the fact that most gender variant adults report experiencing the condition from a very
early age. However referrals for treatment of young people are growing even more rapidly
14(50% p.a.). Organisations should assume that there may be nearly equal numbers of people
transitioning from male to female (trans women) and from female to male (trans men).”
By applying these percentages to the Basingstoke and Deane population aged 16 and over
(140,010 people), it is estimated that 1,400 people may be experiencing some degree of
gender variance (gender nonconforming), 280 people are likely to seek medical treatment
for their condition at some stage; 40 people may be receiving such treatment already; 30
people may have already undergone transition; fewer than 10 people may have a Gender
Recognition Certificate (GRC) and fewer than 10 people may be likely to begin treatment
during the year (all numbers rounded to the nearest 10 people).
The council works with the Basingstoke-based Pride245 organisation to be able to work more
closely with the local transgender community and better meet their needs.
6. Marriage and civil partnership
The latest available data on marital and civil partnership status for residents aged 16+ at a
local level is that recorded in the 2011 Census:
Source: 2011 Census, ONS
Of the 133,947 borough residents aged 16 or over in 2011:
39,633 (29.6 %) were single (never married):
Between the averages for Hampshire and for the South East;
70,359 (52.5 %) were married:
Just below the Hampshire average; above regional and national levels;
15 263 (0.2%) were in a registered same-sex civil partnership:
Mirroring average levels in Hampshire, the South East, and nationally;
3,434 (2.6%) were separated (but still legally married or in a civil partnership);
Reflecting national levels; slightly higher than Hampshire and South East averages;
12,412 (9.3%) were divorced or formerly in a civil partnership which is now legally
dissolved;
Reflecting levels in Hampshire; higher than South East or national averages;
and 7,846 (5.9%) were widowed;
Lower than Hampshire, South East or national averages.
The profile of the borough in terms of marital and civil partnership status has changed between
2001 and 2011:
Single residents, who have never been in a legal relationship, form an increasing
percentage of the adult population, rising from 27.2% in 2001 to 29.6% in 2011:
over the same period, the proportion of single adults in Hampshire increased
from 25.0% to 27.7%;
in the South East from 28.4% to 31.9%; and
in England and Wales from 30.1% to 34.6%.
Married residents account for a declining proportion of adults, falling from 55.4% in 2001
to 52.5% in 2011;
over the same period, the proportion of married adults in Hampshire decreased
from 56.7% to 53.2%;
in the South East from 53.0% to 49.3%; and
in England and Wales from 50.9% to 46.6%.
The percentage of adults who are separated, but still legally in a relationship, has
increased from 2.3% to 2.6%;
over the same period, the proportion of separated adults in Hampshire has
increased from 2.2% to 2.4%;
in the South East from 2.3% to 2.5%;
in England and Wales from 2.4% to 2.6%.
The percentage of adults who are divorced has increased from 8.6% to 9.3%;
over the same period, the proportion of divorced adults in Hampshire has
increased from 8.2% to 9.3%;
in the South East from 8.2% to 9.1%;
in England and Wales from 8.2% to 9.0%.
The percentage of adults who are widowed has decreased from 6.6% to 5.9%;
over the same period, the proportion of widowed adults in Hampshire has decreased
from 7.9% to 7.1%;
16 in the South East from 8.1% to 6.9%;
in England and Wales from 8.4% to 7.0%.
Source: 2011 Census, ONS
Of the 69,315 borough households in 2011:
18,298 (26.4%) were one person households:
Lower than the averages for Hampshire, the South East and England and Wales;
6,890 (37.7%) of these one person households were lone pensioner households:
Lower than the averages for Hampshire, the South East and England and Wales;
5,493 (7.9%) were all pensioner (aged 65 and over) households:
Below the Hampshire, South East and national levels;
27,409 (39.5%) were married or same-sex civil partnership couple households:
Above the Hampshire, regional and national levels;
7,435 (10.7%) were cohabiting couple households:
Above the Hampshire, regional and national levels;
6,317 (9.1%) were lone parent households:
Above the Hampshire, but lower than the South East and England and Wales levels;
6,317 (6.3 %) were other households:
Above the Hampshire, but lower than the regional and national averages.
17A comparison of 2001 and 2011 household compositions is limited because of a change in the
definition of pensioner households. However, a broad overview is possible.
One person households form an increasing percentage of all households, rising from
25.3% in 2001 to 26.4% in 2011:
over the same period, the proportion of one person households in Hampshire
increased from 25.7% to 26.7%;
in the South East from 28.5% to 28.8%; and
in England and Wales from 30.0% to 30.2%.
Family households account for a declining proportion of all households, falling from
68.9% in 2001 to 67.3% in 2011;
over the same period, the proportion of family households in Hampshire
decreased from 69.0% to 67.2%;
in the South East from 65.1% to 63.9%; and
in England and Wales from 63.3% to 61.8%.
The percentage of other households has increased from 5.8% to 6.3%;
over the same period, the proportion of other households in Hampshire has
increased from 5.3% to 6.1%;
in the South East from 6.3% to 7.4%;
in England and Wales from 6.7% to 7.9%.
7. Pregnancy and maternity
A total of 2,027 live births were recorded in Basingstoke and Deane over the calendar year
2017, representing a decrease of -2.5% over the previous decade from 2,078 in 2007 and
the lowest number of annual births since 2006 (2015 births)
smaller than the decrease of 4.5% in Hampshire as a whole over the same period,
where there have been the lowest number of births since 2005;
The borough’s Generalised Fertility Rate (GFR = live births per 1,000 women aged 15 to
44) was 62.6 in 2017, very similar to the figure of 62.4 in 2007 (a 0.3% increase)
compared to a figure of 59.3 for Hampshire overall (a slight decrease -0.2%);
The age of mothers in the borough has increased over the past two decades, with
63% being aged 25 to 34 in 2017; 13.5% aged under 25; and 23.5% aged 35 and over
higher than Hampshire (61.7%) and England and Wales (59.9%) in the 25 to 34 age
group, and similar to Hampshire (14.5%) but lower than England and Wales (17.4%)
in the under 25 age group;
The number of births to mothers aged under 25 has declined in recent years, with a
decrease of 28.1% from 2013 to 2017. The percentage of all births taking place in this age
group has declined from 17.6% in 2013 to 13.5% in 2017
18 Similar to Hampshire as a whole, where the number of births to mothers aged under
25 declined by 24.8% and the percentage of all births to this age group declined from
18.6% to 14.5%;
41.7% of births in the borough in 2017 were outside of marriage or civil partnership
similar to Hampshire as a whole (42.3%);
24.6% of births in the borough in 2017 were to non-UK born mothers
higher than Hampshire average (16.7%), but lower than regional (25.5%) or national
(28.4%) figures;
37 conceptions were recorded to females aged under 18 in the borough in 2016,
representing 12.7 per 1,000 women aged 15 to 17, the lowest number and rate recorded in
the available records from 1998 onwards
lower than the Hampshire average of 13.3 per 1,000 and South East average of 15.0
per 1,000, and the national average for England and Wales of 18.9 per 1,000;
Conceptions among females aged under 16 are recorded as three-year moving averages:
over the period 2014 to 2016, 26 conceptions were recorded to females aged under 16 in
the borough, representing 3.0 per 1,000 women aged 13 to 15;
Higher than average rates for Hampshire (2.5) and the South East (2.9) and lower
than England and Wales (3.8).
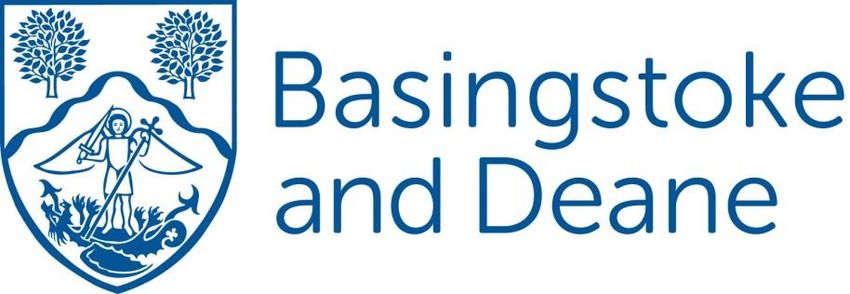
8. Religion and belief (or lack of belief)
The 2011 Census provides the most recent comprehensive data available on religion in the
UK. As in the 2001 Census, which was the first to ask people to state their religion, it was
made clear that this question was not compulsory. Nevertheless, just as in 2001, nearly 93% of
the borough population answered the question – a similar proportion to the county, regional
and national averages.
19Source: 2011 Census, ONS
60% of borough residents stated their religion as Christian in 2011:
slightly lower than the average for Hampshire, and very similar to the national
and regional averages;
in line with other areas, this was about 14 percentage points lower than the
2001 figure of 74%;
3.3% stated that their religion was other than Christian:
compared with the Hampshire average, Basingstoke and Deane had a higher
percentage of people following non-Christian religions in 2011, but remained
well below the national and regional averages;
in line with other areas, notably higher than the 2001 figure of 1.8%;
29.7% of borough residents stated they had no religion at 2011:
a slightly higher percentage than the county, regional or national average;
in line with other areas, notably higher than the 2001 figure of 17%;
A further 7.2% of borough residents did not answer this question:
consistent with the county, regional or national average;
the same percentage as in 2001.
With regard to religions other than Christian, those found most commonly in the borough
are set out below:
20Source: 2011 Census, ONS
The highest levels of religions other than Christian recorded within the borough in the
2011 Census were Hindu (1.2%) and Muslim (0.9%):
these compare with Hampshire levels of 0.7% and 0.6% respectively;
with regional levels of 1.1% and 2.3%;
with national levels of 1.5% and 4.8%;
and with 2001 borough levels of 0.4% and 0.5%.
2011 Census data cross-tabulating age/sex with religion indicates that:
A higher proportion of people aged 65 and over (81.7%) stated their religion as Christian:
compared with 52.5% aged under 16; and 57.4% aged 16 to 64;
Higher percentages of women than men stated their religion as Christian:
particularly those aged 16 to 64 (61.4% of women / 53.3% of men);
and those aged 65+ (84.6% of women / 78.3% of men);
A much lower proportion of people aged 65 and over (8.8%) stated they had no religion
compared with 36.2% aged under 16; and 32.2% aged 16 to 64;
Lower percentages of women than men stated they had no religion:
28.5% of women / 35.9% of men aged 16 to 64;
6.4% of women / 11.8% of men aged 65+;
Among children aged under 16, 1.3% stated their religion as Hindu, and a further 1.3% as
Muslim;
21 Within the 16 to 64 age group, 1.3% stated their religion as Hindu, and 0.9% as Muslim;
Very low percentages of both men and women aged 65+ stated their religion as anything
other than Christian.
2011 Census data confirmed significant correlation between religion and ethnicity. 90.0% of
Christian’s were White British, whilst 96.5% of Hindu’s were Asian/Asian British. It is therefore
reasonable to assume that as the population becomes more multi-cultural, this will be
mirrored in terms of the diversity of religions and beliefs in the borough.
9. Sexual orientation
This term refers to whether a person’s sexual attraction is towards their own gender, the
opposite gender or both genders. Currently, there is no reliable data on the numbers of
Lesbian, Gay and Bisexual (LGB) residents within Basingstoke and Deane. However, the latest
release (2017) of the Office for National Statistics Annual Population Survey, published in
January 2019, indicated that 2.0% of the UK adult population identified themselves as
LGB. This figure may underestimate the true figure as a further 4.1% stated that they ‘Don’t
know’ or refused to answer the question, and another 0.6% stated other.
At regional level, the results for the South East were similar to the UK average, with 2.2% of
the adult population identifying themselves as LGB, 4.0% stating ‘Don’t know” and 0.5%
stating other. The council is not aware of any data to indicate that Basingstoke and Deane is
likely to differ from the regional average. On this basis and incorporating the 0.3% (Gay or
lesbian) and 0.2% (bisexual) confidence interval published with the data, it is estimated that at
least 2,500 borough residents aged 16 and over would describe themselves as LGB but
the number could be nearer 3,900.
10. Deprivation, Health and Unemployment
The English Indices of Deprivation 2015 (ID 2015) indicate that Basingstoke and Deane
experiences relatively little deprivation in the national context. When all indicators are
combined into the Index of Multiple Deprivation (IMD 2015), only five of the 109 Lower
Super Output Areas (LSOAs)1 within the borough fall within the 30% most deprived LSOAs
in England. Almost half fall within the least deprived 20% in England, three of them within
the 1% least deprived nationally. However, some parts of the borough experience
relatively high levels of disadvantage in terms of education and crime.
In terms of health deprivation, eight of the 109 LSOAs within the borough fall within the
30% most deprived LSOAs in England and over 40% fall within the least deprived 20% in
England. Mood and anxiety disorders are an issue for residents in some parts of the
borough.
Information published by the English Public Health Observatories in a Health Profile for the
local area in 2018 shows that life expectancy is 6.1 years lower for men and 4.4 years lower
for women from the most deprived areas compared to the least deprived areas (2014 to 2016).
1 LSOAs are geographical areas that each contain about 1,500 residents.
22Model based estimates of unemployment in Basingstoke and Deane is significantly lower
than the national average at 2.5 per 1,000 population aged 16 and over compared to the
national average of 4.2 per 1,000 in June 2018.
11. Services and other functions
a. Activities with protected characteristics groups and community engagement
The council works with and supports a wide range of individuals and groups across the
borough. Examples include:
Basingstoke Voluntary Action (BVA) – receives grant funding from the council to provide
advice and support to a diverse range of voluntary and community organisations and promote
volunteering, training and networking opportunities.
Basingstoke Humanist Group – the council supports this group to deliver community projects
and raise awareness in the borough.
Basingstoke Multicultural Forum – is supported by the council to bring together culturally
diverse groups, build the capacity of local Black and Minority Ethnic communities and promote
better understanding between different groups. It provides a channel for communities to raise
issues and find practical solutions to concerns.
Basingstoke and District Disability Forum – the council supports the forum to be an
independent umbrella organisation of, and for, disability organisations and disabled people in
the borough, which lobbies, campaigns and participates in consultations.
Citizens Advice – the council provides financial support to both Basingstoke and Tadley
Citizens Advice, enabling the organisations to deliver impartial advice and guidance to borough
residents, including those most in need.
Multi-Agency Diversity Forum – the council supports this forum to bring together partners in
the borough to share information on equalities / access issues to enhance the development of
services and to improve outcomes.
Over 55s Forum – the council supports this forum to raise issues with local service providers,
challenge age discrimination and to ensure a better quality of life for over 55s in the borough.
Transgender – the council supports Chrysalis, a local voluntary organisation, which offers
counselling and support to transgender individuals.
Pride245 - the council supports pride245 organisation in the borough to promote equality for the
LGBT community in the borough.
Basingstoke Faith Leaders Forum – is a network between diverse faith communities,
supported by the council. The forum aims to promote mutual respect and understanding and
members work together to identify and support the needs of all local faith groups.
The council also works with a wide range of other Voluntary and Community Organisations to
support local groups including, Shopmobility, Ex-Gurkha Seniors Forum, Caribbean Seniors
Group, Asian Hamara ladies Group, youth groups etc.
23The council’s Community Development and Community and Wellbeing teams work with local
residents to build strong and stable communities in the borough. Activities include: tackling
health inequalities, promoting health and wellbeing and improving engagement with all sectors
of the community. The Community Planning team also encourages local communities in the
borough to get involved in shaping their local areas by developing community plans. For more
information, please see the council website: www.basingstoke.gov.uk
In developing Community Plans, the general profile of respondents is normally equality
monitored and the associated Community Action Plans include actions to address any gaps
identified. For example, the Kempshott Community Planning Group looked at their local profile
and undertook a “Wellbeing in later life survey”. The Community Investment Team has also
created guidance to support communities to think about equalities and accessibility throughout
the community planning process.
b. Access to services and research with service users from different protected
characteristics groups
The council collects a wide range of information about the population of the borough to improve
its understanding of the needs of local residents and to ensure that its services are accessible
to all. The majority of this information is gathered when service users access council services
and through qualitative and quantitative research. The type and amount of information held by
each team varies depending on the service provided.
Some council teams have a more comprehensive picture of who is / is not using services, for
example, the Community and Wellbeing team. However, in other areas of the council’s work
there are data protection issues, which limit the information the council is able to collect, for
example, in relation to Benefits.
Examples of different methods used to gather information include:
Consultation – when important decisions are made, the council will ask local people
about their views on new proposals / proposed changes and invite people to make
alternative suggestions, where relevant. For example, during the development of the
Children and Young People’s Vision. For more information on consultations carried out
by the council, click here.
Customer surveys – are often used to assess how well a service has been provided
and where improvements can be made in future activities. For example, the Streetz
project, which provides activities for young people in the borough.
Focus groups – to gain a more in-depth insight into the issues faced by certain groups.
For example, during the development of the council’s Horizon 2050 future vision for the
borough.
Statistical and qualitative research – from partner organisations and local / national
sources.
To improve access to council services, translation and interpretation services are made
available to service users. Alternative formats also are offered, for example, audio, Braille etc.
c. Customer satisfaction with services
The council’s customer services team collects customer satisfaction data on a regular basis.
This data is normally broken down by certain protected characteristics including: race, sex, age
and disability. If you would like to contact the customer services team at any time to raise a
comment or compliment please click here for more information.
24d. Due regard to the Public Sector Equality Duty
To find out how new or updated policies, schemes and services could affect different
communities, the council carries out Equality Impact Assessments, where relevant. These
allow for any potentially differential impacts of proposed actions to be identified and consider
mitigating actions, where possible.
These assessments also ensure that when services and policies are developed, due regard is
paid to the Public Sector Equality Duty and the need to promote equality, eliminate
discrimination and promote good relations between different groups is taken into account. The
results of assessments inform decision making. For more information on the councils’ equality
impact assessments please click here.
e. Equality performance monitoring
The council’s equalities priorities and objectives relate to the aims of the general Public Sector
Equality Duty. Actions in the Corporate Equality Action Plan are monitored by the Equality
Working Group (officers) and overseen by the Equality Strategy Group (senior managers and
councillors). Action points raised from equalities assessments are also monitored by the
working group with leads from relevant service teams.
f. Policies, Plans and Programmes
Council Plan – sets out the council’s priorities over the next four years, including preparing
for controlled and sustainable growth, improving residents’ quality of life, supporting those
that need it.
Internal policies – put in place to promote equality for staff and residents, such as the
council’s Access Policy and Equality and Diversity at Work Policy.
Equality and Diversity training – council staff undertake mandatory e-learning to raise
awareness of equalities issues. Face-to-face training sessions have also been provided to
different teams on specific subjects, such as ‘hidden disabilities’ and mental health
conditions.
g. Numbers of potential and actual service users
The number of potential users of council services is approximately 175,340, which is the total
number of residents in the borough. Information presented in points 1 to 10 of this report
provides a breakdown of types of people who will use council services at different points in
time by protected characteristic. Where possible, the equalities information held by different
Business Units is collated to assess numbers of actual service users. Any gaps identified are
be monitored as part of the council’s Corporate Equality Action Plan.
25Sources of information
Ward profiles produced by Basingstoke and Deane Borough Council:
http://www.basingstoke.gov.uk/ward-and-borough-profiles
Census 2011: http://www.ons.gov.uk/ons/guide-method/census/2011/index.html
Office for National Statistics: http://www.ons.gov.uk/ons/index.html
Nomis (provided by the Office for National Statistics) - UK labour market:
http://www.nomisweb.co.uk/
Summary factsheet for Basingstoke and Deane produced by Hampshire County Council:
http://www3.hants.gov.uk/2011_census_basingstoke_and_deane_summary_factsheet.pdf
Gov.uk Publication: Statistics:
https://www.gov.uk/government/statistics
Department for Work and Pensions (DWP):
https://www.gov.uk/government/organisations/department-for-work-pensions/about/statistics
The English Indices of Deprivation 2015:
https://www.gov.uk/government/statistics/english-indices-of-deprivation-2015
Public Health England – Basingstoke and Deane Health Profile:
https://fingertips.phe.org.uk/profile/health-profiles
26You can also read