A classic, gold standard: The Westergren method for ESR measurement - WP 001, rev. 005 - RR ...
←
→
Page content transcription
If your browser does not render page correctly, please read the page content below
A classic, gold standard:
The Westergren method for
        ESR measurement

                        WP‐001, rev. 005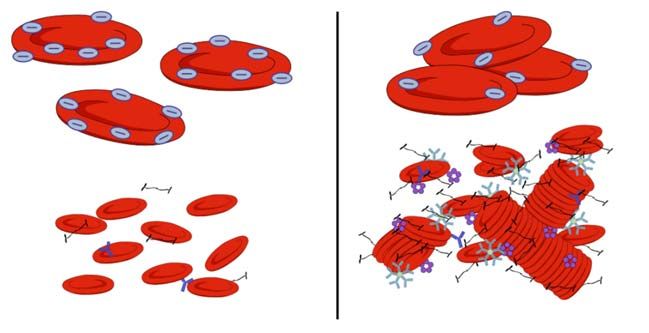
RR Mechatronics                                          Westergren ESR Measurement

                                                     Executive Summary
Erythrocyte Sedimentation Rate (ESR) is a sensitive, non‐specific marker of
inflammation. ESR is used as a “general physical condition” marker, in
combination with clinical history, physical examination and other standard
laboratory tests. It can serve as a guide to aid diagnosis, management and follow‐
up of different autoimmune diseases, acute and chronic infections and tumors.

Modern and fully automated instruments, like the Starrsed, have made the ESR
test even more accurate and safe in comparison with the manual Westergren
version. Several published studies highlight that alternatives to the ICSH and CLSI
declared gold standard ESR method, that use a test principle that is very different
from Westergren, give rise to a large percentage of false negatives and thus a
risk of missed diagnoses.

This white paper provides an overview on the history and measurement of the
ESR and the different tests/instruments available on the market. In this paper
shows RR Mechatronics features its Starrsed Line of fully automated Westergren
ESR instruments. It shows several publications on analysis of these tests in
comparison with the gold standard of Westergren (and Starrsed). It sheds light
on the importance of the automated, accurate and safe use of the Starrsed.

White Paper by RR Mechatronics

Published February 2018

                                       ‐2‐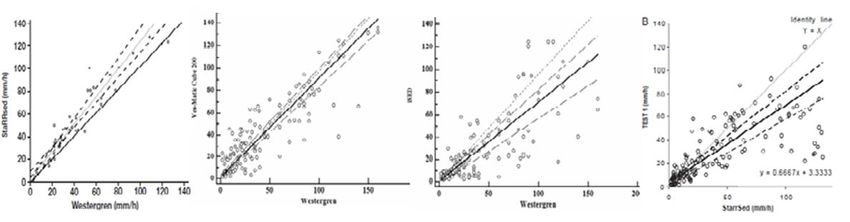
Westergren ESR Measurement RR Mechatronics
Key Findings
The erythrocyte sedimentation rate (ESR) is a non‐specific marker, and is, in combination with
clinical history and physical examination used as a general condition indicator. It is a classic
test that measures how far erythrocytes settle in a test tube over the course of time; 60 ± 1
minute. (page 4, 15)
Erythrocyte sedimentation is governed by factors that stimulate or inhibit erythrocyte
aggregation and sedimentation. The clinically most relevant factors that influence ESR are the
erythrocytes themselves and plasma proteins associated with inflammation and tissue
damage. Erythrocytes usually aggregate into clumps that resemble a stack of coins and are
called rouleaux. (page 4,5)
The Westergren method as described by the Clinical and Lab Standards Institute (CLSI) is the
gold standard and reconfirmed in 2017 as the reference method for ESR measurement by the
International Council for Standardization in Hæmatology (ICSH). (page 6,7)
In the original Westergren method, the ESR is read after 60 minutes. An ESR reading after 30
minutes can reliably be extrapolated to the corresponding ESR reading at 60 minutes
(correlation coefficient = 0.984). The Starrsed ESR can work in 30 and 60 minutes mode (page
10)
Test‐1 and iSED are ESR analyzers that produce ESR reading results within 20 seconds after
sampling. It takes however approximately 10 minutes before sedimentation starts at a
constant rate. This means that the Test‐1 analyzer doesn’t actually measure sedimentation,
but rather calculates a mathematically derived ESR, based on aggregate measurements in the
first, rouleaux forming stage only. (page 11,12)
The Test‐1, the iSED and the VES‐Matic demonstrate clear flaws compared to the original
Westergren and the Starrsed, leading to an important number of false negatives. (page 12)
ICSH recommends to: Consider adding an interpretative comment to every result stating that
“This result was obtained with an ESR instrument that is not based on the standard Westergren
method. The sensitivity and specificity of this method for various disease states may be
different from the standard Westergren method”. (page 12)
The Starrsed ESR analyzers from RR Mechatronics are automated ESR analyzers that use the
reference Westergren method as recommended by the ICSH and CLSI. (page 11)
The Starrsed automated implementation of the Westergren ESR also takes care of the many
things that might influence the quality of the test result, for example: temperature, stability,
dilution, washing and drying of the Westergren tubes and detecting problematic (hemolytic)
samples. (page 6,7,8,12)
ESR measurement is useful in the diagnosis of rheumatoid arthritis, temporal arthritis,
polymyalgia rheumatica, multiple myeloma and several autoimmune diseases. Clinical studies
have also suggested possible relevance of ESR levels in different other conditions. (page 15,16)
‐3‐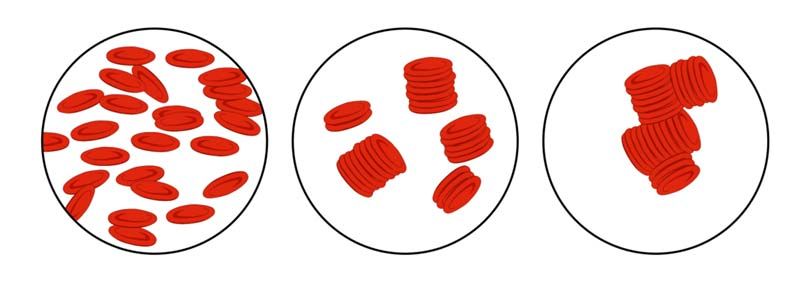
RR Mechatronics                                                         Westergren ESR Measurement

Erythrocyte Sedimentation Rate
The erythrocyte sedimentation rate (ESR) is a non‐specific marker, used as a general condition
indicator. ESR is a non‐specific marker of inflammation. It can be used in combination with the patient’s
clinical history and physical examination and can serve as a guide to aid diagnosis, management and
follow‐up of different auto‐immune diseases, acute and chronic infections and tumors (Bridgen, 1999).

ESR is a classic test that measures how far erythrocytes settle in a test tube over the course of time.
For this test, anti‐coagulated whole blood is allowed to settle in an upright tube under standardized
conditions. The ESR is the distance in mm that the erythrocytes have fallen during that time. There are
many factors that affect the ESR, but the most clinically relevant factors that influence ESR are the
erythrocytes themselves and plasma proteins associated with inflammation and tissue damage.

 The discovery of ESR
 Although Alf Westergren often is associated with ESR, he was not the first to notice the significance
 of ESR or to attempt to develop a method for measuring ESR.

 The first one to notice and record changes in blood sedimentation during inflammation was John
 Hunter, who mentioned this in “A treatise on the blood, inflammation and gunshot wounds”, that
 was published posthumously in 1794. About a century later, in 1897, Edmund Biernacki, a Polish
 physician, noticed that ESR was influenced by fibrinogen and developed his own ESR test, which
 he published and presented to his peers. But since he published his findings in Polish and German
 journals, his observations were hardly noticed in the English‐speaking world.

 In the 1920’s, Swedish pathologist Robert Fåhræus and physician Alf Westergren made similar
 observations of the ESR in pregnant and tuberculosis patients. Together, they developed the
 Fåhræus‐Westergren method of measuring ESR, which was quickly and widely adopted in clinical
 laboratories over the world and became known as the Westergren method.

 (Madrenas J, 2005) (Grybowski & Sak, 2011 ;38)

Erythrocyte sedimentation process
Erythrocyte sedimentation is governed by factors that stimulate or inhibit erythrocyte aggregation and
sedimentation. Normal erythrocytes are negatively charged and repel each other, which limits the
sedimentation rate. Large clumps fall faster than small ones, so factors that increase aggregation will
increase sedimentation. Erythrocytes usually aggregate into clumps that resemble a stack of coins,
which are called rouleaux.

                                                  ‐4‐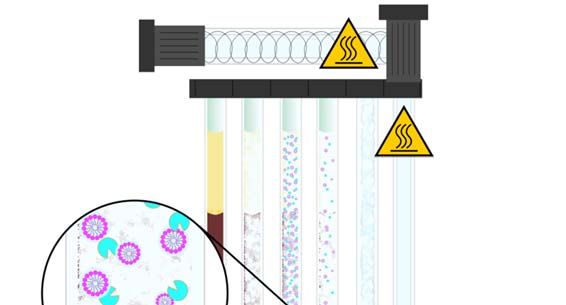
Westergren ESR Measurement                                                             RR Mechatronics

Normal Erythrocytes                              Inflammation

Fig 1:   Normal: Negatively charged erythrocytes; low sedimentation rate.
         Inflammation: Less negatively charged erythrocytes; sedimentation occurs, stimulated by all
         the different factors that increase rouleaux formation (Fibrinogen, CRP, Immunoglobulin).

The sedimentation process can be divided into three stages:
A. Lag stage‐rouleaux formation (0‐20 min) Erythrocytes start to aggregate and form rouleaux. The
    presence of acute phase proteins encourages rouleaux formation. During this phase, no
    sedimentation occurs.
B. Decantation stage‐sedimentation (15‐30 min) Erythrocyte aggregates fall to the bottom under
    influence of gravity at a constant rate. Large aggregates fall faster than small aggregates or single
    cells. Falling aggregates induce an upward plasma current that slows down sedimentation.
C. Packing stage (25‐60 min) The rate of sedimentation slows down to zero and cells start to pack in
    the bottom of the tube.

Rouleaux formation

 Fig. 2: At low or no flow condition, RBC’s adhere side to side and form stacks called rouleaux,
followed by end to end connections creating 3D aggregates (the rouleaux formation)

(Fabry, 1987)

                                                  ‐5‐
RR Mechatronics                                                        Westergren ESR Measurement

The Westergren method is the gold standard
In the 1920’s, Swedish practitioners Robert Fårhæus and Alf Westergren developed a systematic
method for ESR measurement. Although several alternative methods were developed in that era, the
Fårhæus‐Westergren method, or Westergren method as it became known in the English‐speaking
world, quickly gained dominance. In 1973, the Westergren method was adopted as the reference
method for ESR measurement by the International Council for Standardization in Hæmatology (ICSH).
The Westergren gold standard was reconfirmed in 2017 (Kratz et al., 2017) by the ICSH and by the
Clinical and Laboratory Standards Institute (CLSI). It remains the gold standard that all other ESR
measurement methods and techniques are evaluated against.

 The Wintrobe method: An alternative method for ESR measurement
 The sixth edition of Gradwohl’s Clinical Laboratory Methods and Diagnosis, published in 1963,
 mentions five different methods to measure ESR. These were the Westergren method, the
 Linzenmeier method, the Graphic or Cutler method, the Wintrobe‐Landsberg method and the
 Landau method, which was a modification of the Linzenmeier method.

 Of these methods, only the Westergren method and Wintrobe method are still in use today. The
 Wintrobe method uses tubes of only 100 mm long with a smaller diameter than standard
 Westergren tubes. EDTA blood without extra diluent is added to the tube and allowed to sediment
 for 60 minutes. After 60 minutes the distance that the blood cells have fallen is registered in mm.

 Because the Wintrobe tubes are shorter than the Westergren tubes, the method is less sensitive
 than the Westergren method.

 (Frankel, Reitman, & Sonnenwirth, 1963)

Procedure
The Westergren method as referenced by the ICSH consists of the following steps:

Blood collection

Non‐hemolyzed blood is anti‐coagulated with EDTA at collection.

It is recommended that the EDTA sample is tested within 4 hours after collection, but it has been
reported that storage for up to 24 hours at 4°C still results in a stable ESR value. When ready to test,
the blood sample is thoroughly mixed and diluted 4:1 using a sodium citrate solution.

Tube handling

The Westergren method uses standardized colorless, circular glass or plastic tubes, with an inner
diameter of at least 2.55 mm and sufficient length to include a 200 mm sedimentation scale. The inner
diameter should be constant (± 5%) over the whole length; a so called Westergren tube.

                                                  ‐6‐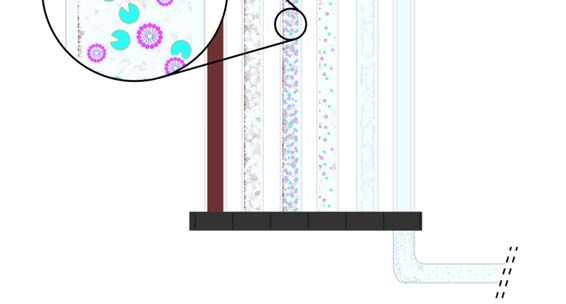
Westergren ESR Measurement                                                            RR Mechatronics

The diluted sample is aspirated and transferred to the Westergren tube. The Westergren tube is then
placed in a stable, vertical position at a constant temperature (± 1°C) between 18°C and 25°C in an area
free from vibrations, drafts and direct sunlight.

Reading the result

After 60 ± 1 minute, the distance from the bottom of the plasma meniscus to the top of the descended
erythrocytes is read and recorded in mm. The buffy coat that is made up of leukocytes should not be
included in the erythrocyte column.

(Jou, Lewis, Briggs, Lee, De La Salle, & McFadden, 2011) (CLSI, 2011)

The Westergren method

           a.                b.                 c.

Fig 3:   a. The diluted sample is aspirated and transferred to the Westergren tube.
         b. A normal ESR after 60 minutes;
RR Mechatronics                                                       Westergren ESR Measurement

Sample storage
The storage conditions of the sample are permitted, conform the CLSI standard (CLSI, 2011), to be up
to 4 hours at room temperature or up to 24 hours at 4 degrees Celsius in cold storage. These storage
conditions are in line with the sample storage requirement for the hematology analyzers.

Incorrect blood preparation
Correct blood preparation is important for reliable results. Whole blood should be anti‐coagulated with
EDTA without significant dilution of the sample. Alternatively, blood can be collected and diluted 4:1
in special sodium citrate tubes suitable for ESR measurement. Heparin can lead to falsely increased
ESR readings (Penchas, Stern, & Bar‐Or, 1978).

Changes in plasma viscosity and hematocrit can cause variable plugging of the long Westergren tube
by rapidly falling erythrocyte aggregates. Correct dilution (4:1) of the blood sample in sodium citrate
prevents this and makes the measurement independent of viscosity and hematocrit differences.

Deviation in vertical placement
Westergren tubes need to be placed perfectly vertically. Angles of more than 2 degrees off the vertical
can accelerate sedimentation and result in a false increase in ESR. A deviation of 3 degrees can
accelerate ESR up to 30%.

Temperature variation
The sedimentation process is substantially influenced by temperature variations. One example would
be when sunlight would shine on some tubes but not others. The ICSH recommends a constant
temperature (± 1°C) between 18°C and 25°C.

Vibrations
Vibrations can artificially increase sedimentation rate and should therefore be avoided.

Problematic samples
In some cases, erythrocyte abnormalities can result in hazy, cloudy samples that are difficult to read.
Also, hemolytic or lipemic samples can cause difficulties in the accurate reading of ESR.
(CLSI, 2011) (Hardeman, Levitus, Pelliccia, & Bouman, 2010)

In some cases, sampling errors, e.g. a low sample volume, can lead to foam or bubbles in the sample.
If the analyzing system does not perform internal quality controls and flags low quality samples and
unreliable readings, the reduced quality of the sample can lead to incorrect results and false clinical
interpretation.

                                                 ‐8‐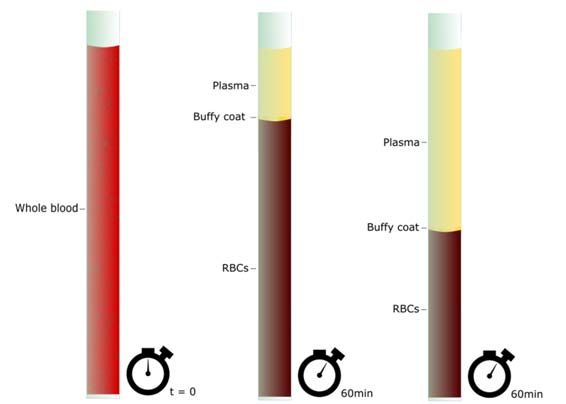
Westergren ESR Measurement                                                           RR Mechatronics

Other possible sedimentation results

Fig.4: ‐ Normal sample
       ‐ Hemolytic sample: Due to hemolysis; hemoglobin leaks from the damaged erythrocytes and
       turns the plasma red.
       ‐ Icteric sample: Mostly due to liver problems, elevated bilirubin turns the plasma darker
       yellow.
       ‐ Lipidic sample: Because of too much fat, the plasma turns opaque white and thickens.

 Using tilt to speed up ESR
 A tube that is not held completely vertical can lead to increased sedimentation rates and is one of
 the technical factors that can affect ESR readings. But could this knowledge be used to increase
 ESR and develop a rapid ESR method?

 DM Dissanayake of the University of Peradenya in Sri Lanka has tested whether it was possible to
 use an inclined tube to get a faster reading of the ESR.

 Dissanayake tilted tubes at an angle of 45 degrees and registered sedimentation distances every
 30 seconds from 4 to 13 minutes by reading the lowest level of the meniscus. These results were
 compared with a traditional Westergren reading of the same sample in another tube that was kept
 vertically. The experiment contained a wide range of ESR readings, from 0 mm to well over 150
 mm. The correlation between the traditional Westergren reading and the tilted tube was maximal
 between 10 and 11.5 minutes (correlation coefficient=0.985‐0.986) for both low and high ESR
 readings.

 (Dissanayake, 2006)

 The accuracy of the results was considered acceptable. It demonstrates however that a tilted
 tube has a strong influence on the optimal testing time.

                                                ‐9‐
RR Mechatronics                                                       Westergren ESR Measurement

Reducing analysis time
In the original Westergren method, the ESR is read after 60 minutes, which puts practical limitations
on the workflow in clinical laboratories. A laboratory investigation comparing the Westergren ESR
method readings of a wide range of blood samples at 30 minutes and 60 minutes showed that 30
minute ESR readings correlate highly with the corresponding 60 minute ESR readings over a wide range
of blood samples (correlation coefficient = 0.984). Thus, an ESR reading after 30 minutes can reliably
be extrapolated to the corresponding ESR reading at 60 minutes. (Rogers, 1994)

 Correlation coefficient:
 ‐ The value of a correlation coefficient ranges between ‐1 and 1.
 ‐ The strongest linear relationship is indicated by a correlation coefficient of ‐1 or 1.
 ‐ The weakest linear relationship is indicated by a correlation coefficient equal to 0.
 NB: The correlation coefficient 0.984 is considered a very strong linear relationship. The accuracy
 of the results was considered acceptable. It demonstrates however that a tilted tube has a strong
 influence on the optimal testing time.

Comparison between 30 and 60 minutes Westergren method

Fig. 5: The 30 minute ESR readings correlate highly with the corresponding 60 minute ESR readings
over a wide range of blood samples (correlation coefficient = 0.984).

Aggregation versus sedimentation
Alifax Test‐1 and Alcor iSED are ESR analyzers that produce ESR reading results within 20 seconds after
sampling. Erythrocyte sedimentation is influenced by aggregation properties as well as plasma
viscosity and hematocrit volume. It takes approximately 10 minutes before sedimentation starts at a
constant rate. This means that the Test‐1 and the iSED analyzers don’t actually measure sedimentation,
but rather calculates a mathematically derived ESR based on aggregate measurements in the first,
rouleaux forming stage only. Thus, these test results need to be manipulated to an ESR value according
to the Westergren method in order to be clinically useful.

                                                ‐ 10 ‐
Westergren ESR Measurement RR Mechatronics
The Diesse VES‐Matic Cube line of instruments is like Westergren a sedimentation‐based test. To run
VES‐Matic test it uses the original EDTA tube that was used for drawing the blood from the patient. No
sample is taken from the tube and nothing is added. Not consuming any sample seems very attractive
but has some serious drawbacks.
1. In order not to lose accuracy a relatively full sample tube is required. This puts some constraints
on the testing order and logistics in the lab. Also the tube is occupied for at least 20 minutes
before any other hematology test can be done.
2. A more serious drawback is that the sample in the primary EDTA tube is not diluted, nor is the
result adjusted for the viscosity of the sample. The hematocrit level will have a significant
influence on the measured sedimentation.
The hematocrit level of a sample will, among others, even vary with the individuals hydration level.
Not adjusting for a variation in hematocrit (as is prescribed in Westergren) will make it impossible to
truly compare the readings from the VES‐Matic instruments with the ESR measures that are in
accordance with the international standard as referenced by the ICSH.
Comparison of Westergren with other methods
Fig. 6: Results reported into the upper left quadrant are considered normal according to the Westergren
gold standard, but high according to method X. These so called “false positives” will lead to additional
costs for supplementary testing or unnecessary treatment. Results reported into the lower right
quadrant are considered high according to the Westergren gold standard, but low according to method
X. These so called “false negatives” may lead to missed diagnosis.
In addition, sedimentation characteristics of the second and third stage can be relevant for some
diseases, e.g. multiple myeloma. Test‐1 was not as sensitive to the presence of paraproteins as the
Westergren method (Raijmakers, Kuijper, Bakkeren, & Vader, 2008) and could produce significantly
different results, especially in the higher ESR readings (Hardeman, Levitus, Pelliccia, & Bouman, 2010).
In one comparison it was found that in 11.5% of the samples, the differences in results could lead to
either a missed diagnosis (false negative) or additional testing costs (false positive) (Hardeman, Levitus,
Pelliccia, & Bouman, 2010). Also, in diagnosing a flare in rheumatoid arthritis, Test‐1 has shown to
induce DAS28 misclassification in clinical practice (Maas et al., 2010).
The figures below are Passing Bablok regression plots taken from three independent publications. By
evaluating and connecting the dots of three publications it is possible to compare the Test1 and iSED
with the Starrsed and the gold standard Westergren. It again articulates the quality of the original
Westergren method and the Westergren related methods in determining ESR.
‐ 11 ‐RR Mechatronics Westergren ESR Measurement
The Test1, the iSED and the VES‐Matic demonstrated clear flaws compared to the original Westergren
and the Starrsed, leading to an important number of false negatives.
Regression Plots: comparing methods
Fig. 7: Higher than 40 on the Westergren scale and lower than 40 on the compared instrument scale
are potentially missed diagnoses.
(Hardeman, Levitus, Pelliccia, & Bouman, 2010) (Raijmakers, Kuijper, Bakkeren, & Vader, 2008)
(Bogdaycioglu, Yilmaz, Sezer, & Oguz, 2014) (Curvers, et al., 2010)
Recent ESR instrument evaluation articles
Fig. 8: Different publications evaluating different methods.
These observations point, according to the ICSH working group, toward consequences of the inherent
differences between the Westergren method and the modified and alternate methods and the need
for standardization and harmonization. The ICSH further points out that a laboratory using an alternate
Westergren method should consider “adding an interpretive comment to every result that summarizes
the sensitivity and specificity of the method for various disease states” (Kratz et al., 2017). In other
words when using an “alternate Westergren” method, such as Test‐1 or iSED, a laboratory should state
that according to peer reviewed published research the results are not useful in the diagnosis of
multiple myeloma or rheumatoid arthritis.
‐ 12 ‐Westergren ESR Measurement RR Mechatronics
Quality equipment ensures reliable results and reduced cost of operation
The Starrsed ESR analyzers from RR Mechatronics are automated ESR analyzers that use the reference
Westergren method as recommended in 2017 by the ICSH (Kratz et al., 2017) and CLSI (2011). Starrsed
analyzers perform fully automated ESR measurements in 30 or 60 minutes.
Pre‐mixing, sampling and dilution of standard whole‐blood EDTA samples in sodium citrate is fully
automated, which ensures accuracy and frees up time for the operator, who only needs to load the
samples into the analyzer. The analyzers contain a built‐in barcode reader that automatically identifies
and registers the correct blood samples. Starrsed analyzers use a specifically designed needle for
sampling that minimizes damage to the rubber stopper and ensures that blood vials can be sampled
reliably multiple times.
Correct placement of a Starrsed analyzer guarantees a vertical position, a vibration‐free environment
and shielding from sunlight and drafts. The Starrsed analyzers use infrared light to read the ESR results
and the optical reader is, in combination with built‐in algorithms, even capable of detecting the
relevant plasma‐blood cell interface in hazy samples. The results are temperature corrected to 18.3°C
and enable reliable clinical interpretation of the result.
Starrsed analyzers use standardized, reusable glass tubes that are specially made and tested. The tubes
are cleaned using detergent and protease enzymes, rinsed and dried after each cycle, ensuring that
the tubes are clean before use. This reduces waste and minimizes biohazard risks and the cost of
operation.
The washing process of the Westergren tubes
Fig. 9: The tubes are cleaned using detergent and protease enzymes. The inside of the tube is dried
and disinfected by air that has passed through a heating element.
‐ 13 ‐RR Mechatronics Westergren ESR Measurement
ESR in clinical analysis
Normal reference values for the Westergren ESR method are ≤15 mm for men and ≤20 mm for women.
The ESR increases slightly with age with the highest values found in 65‐74 years of age. Reference
values should be established locally and it is recommended to establish a reference value for each
decade of adult life. The probability for disease becomes significant when ESR >50 mm.
Mean and upper limits of Normal (CLSI. 2011)
ESR Upper Limit of Normal
Age (years) mean Male mean Female Male Female
18-30 3,1 5,1 < 7,1 < 10,7
31-40 3,4 5,6 < 7,8 < 11,0
41-50 4,6 6,2 < 10,6 < 13,2
51-60 5,6 9,4 < 12,2 < 18,6
61-70 5,6 9,4 < 12,7 < 20,2
over 70 5,6 10,1 < 30 < 35
Physiological and clinical factors that increase ESR
ESR values are higher for women than for men and increase progressively with age. Pregnancy also
increases ESR.
During acute phase reactions, macromolecular plasma proteins, particularly fibrinogen, are produced
that decrease the negative charges between erythrocytes and thereby encourage rouleaux formation.
Paraproteins are positively charged molecules that are abundantly present in multiple myeloma and
Waldenström’s macroglobulinemia patients. Like fibrinogen, paraproteins decrease the negative
charges between erythrocytes and increase rouleaux formation. As described earlier the aggregation
based ESR tests (Test‐1 and iSED) typically miss detecting these disorders, see paragraph above on
“Aggregation versus Sedimentation”. (Raijmakers, Kuijper, Bakkeren, & Vader, 2008)
High protein concentrations increase plasma viscosity, which slows down the fall rate and thus ESR.
However, the effects of fibrinogen and paraproteins on the negative charges between erythrocytes
and rouleaux formation far outweigh the effect of increased plasma viscosity, resulting in a strong net
increase of ESR.
In anemia, erythrocyte numbers are reduced, which increases rouleaux formation. In addition, the
reduced hematocrit affects the velocity of the upward plasma current so that erythrocyte aggregates
fall faster.
In macrocytosis, erythrocytes have a shape with a small surface‐to‐volume ratio, which leads to a
higher sedimentation rate.
(Saadeh, 1998) (Bridgen, 1999)
‐ 14 ‐Westergren ESR Measurement RR Mechatronics
Physiological and clinical factors that decrease ESR
Polycythemia is characterized by an increased proportion of erythrocytes in the blood, which artificially
lowers the ESR. Polycythemia can be caused by increased numbers of erythrocytes or by a decrease in
plasma volume.
Erythrocyte abnormalities can affect aggregation, rouleaux formation and fall rate. Erythrocytes with
irregular or small shapes tend to settle slower and decrease ESR.
A decrease in plasma proteins, especially of fibrinogen and paraproteins, decreases ESR.
(Saadeh, 1998) (Bridgen, 1999)
Clinical interpretation of ESR
ESR is a sensitive, non‐specific marker of inflammation and is, in combination with clinical history and
physical examination, being used as a “general physical condition” marker. There is a linear
correlation between fibrinogen levels in blood and ESR readings, so any condition that increases
fibrinogen levels, increases ESR. Anemia often occurs in patients with acute or chronic immune
activation. Anemia of chronic disease is the second most prevalent after anemia caused by iron
deficiency.
Rheumatoid Arthritis (RA) and other autoimmune diseases
ESR measurement is useful in the diagnosis of Rheumatoid Arthritis and the follow‐up of RA‐patients
when combined with other parameters as outlined in the ACR guidelines. However, ESR can be
elevated when RA is clinically quiescent and vice versa. ESR is also useful in the follow‐up of SLE, but
not for inflammatory myopathy or spondyloarthropathy.
Temporal arthritis and polymyalgia rheumatica
An elevated ESR is one of the diagnostic criteria for temporal arthritis and polymyalgia rheumatica. The
ESR is almost always elevated in these conditions, in some cases exceeding 100 mm. However, a
normal ESR in suspected patients does not rule out diagnosis. If clinical features are present, a
temporal artery biopsy is highly recommended, even when ESR is not elevated.
Multiple myeloma
An increased ESR is helpful in diagnosing multiple myeloma, but the final confirmation depends on
other criteria (monoclonal spike or serum electrophoresis, marrow plasmacytosis and lytic bone
lesions). ESR in benign monoclonal gammopathy is not well studied. ESR measurements should only
serve as a guide to disease progression or response to therapy in symptomatic patients.
Other conditions
Clinical studies, often small studies, have suggested possible relevance of ESR levels in different
conditions, e.g. bacterial otitis media, acute hematogenous osteomyelitis in children, sickle cell
disease, pelvic inflammatory disease, febrile IV drug users, prostate cancer, coronary artery disease
and stroke.
‐ 15 ‐RR Mechatronics Westergren ESR Measurement
An extreme elevation of ESR, defined as >100 mm is indicative for a serious underlying disease, most
notably infection, collagen vascular disease, metastatic malignant tumors or renal disease. In most
cases, the underlying condition is clinically apparent. In < 2% of patients with an extremely elevated
ESR, no obvious cause can be found, but the underlying cause can usually be found in combination
with the clinical history, physical examination and other standard laboratory tests. (Saadeh, 1998)
(Bridgen, 1999)
Conclusion
Erythrocyte Sedimentation Rate following the gold standard of Westergren is a useful general
condition indicator and marker for inflammation. Modern and fully automated instruments have made
the ESR test even more accurate and safe in comparison with the manual Westergren version.
The Starrsed automated implementation of the Westergren ESR in addition addresses the many things
that might influence the quality of the test result, for example: temperature, stability, dilution, washing
and drying of the Westergren tubes and detecting problematic (hemolytic) samples. All these possible
quality influencers need to be under control to perform an optimally accurate test.
Several published studies highlight that alternatives to the ICSH and CLSI declared gold standard ESR
method that use a test principle that is very different from Westergren, give rise to a large percentage
of false negatives and thus a risk of missed diagnoses.
‐ 16 ‐Westergren ESR Measurement RR Mechatronics
References
Bogdaycioglu, N., Yilmaz, F., Sezer, S., & Oguz, E. (2014). Comparison of iSED and Ves‐Matic Cube 200
Erythrocyte Sedimentation Rate Measurements With Westergren Method. Journal of clinical
laboratory analysis.
Bridgen, M. L. (1999). Clinical Utility of the Erythrocyte Sedimentation Rate. Am Fam Physician. Vol.
60, p. 1443‐1550
CLSI. (2011). Procedures for the Erythrocyte Sedimentation Rate Test; Approved Standard ‐ Fifth
Edition. CLSI document H02‐A5. Wayne, PA: Clinical and Laboratory Standards Institute.
Curvers, J., Kooren, J., Laan, M., van Lierop, E., van de Kerkhof, D., S. V., et al. (2010). Evaluation of
the Ves‐Matic Cube 200 erythrocyte sedimentation method: comparison with Westergren‐
based methods. Am J Clin Pathol.
Dissanayake, D. M. (2006). A rapid method for testing the erythrocyte sedimentation rate. Journal of
Diagnostic Pathology, 47‐51.
Fabry, T. L. (1987). Mechanism of Erythrocyte Aggregation and Sedimentation. Blood, 1987 (Blood,
Vol 70, No5), 1572‐1576.
Frankel, S., Reitman, S., & Sonnenwirth, A. (1963). A Text Book on Laboratory Procedures and Their
Interpretations. In Gradwohl Clinical Laboratory Methods and Diagnosis. The C.V. Mosby
Company London.
Grybowski, A., & Sak, J. J. (2011 ;38). Who Discovered the Erythrocyte Sedimentation Rate? The
Journal of Rheumatology, p. 1521‐1522.
Hardeman, M., Levitus, M., Pelliccia, A., & Bouman, A. (2010). Test 1 analyser for determination of
ESR. 1. Practical evaluation and comparison with the Westergren technique. Scand J Clin Lab
Invest. Vol. 70, p.21‐25
Jou, J., Lewis, S., Briggs, C., Lee, S., De La Salle, B., & McFadden, S. (2011). ICSH review of the
measurement of the erythocyte sedimentation rate. Int J Lab Hematol. Vol. 33, p.125‐132
Kratz A, Plebani M, Peng M, Lee YK, McCafferty R, Machin SJ. (2017). ICSH recommendations for
modified and alternate methods measuring the erythrocyte sedimentation rate. Int J Lab
Hematol. 2017;39(5):448‐457. doi:10.1111/ijlh.12693.
Maas A Van Der, Ende CHM Van Den, Eerd J Van, Fransen J, Broeder AA Den. The use of different
methods for rapid determination of the ESR induces DAS28 misclassification in clinical
practice. Clin Exp Rheumatol. 2010;28.
Madrenas J, P. P. (2005). Giving credit where credit is due: John Hunter and the discovery of
erythrocyte sedimentation rate. The Lancet, 366, p.2140‐2141
Penchas, S., Stern, Z., & Bar‐Or, D. (1978). Heparin and the ESR. Arch Intern Med. p.1864‐1865
Raijmakers, M., Kuijper, P., Bakkeren, D., & Vader, H. (2008). The effect of M‐proteins on the
erythrocyte sedimentation rate; a comparison between the StarrSed and TEST 1 analyzers.
Ned Tijdschr Klin Chem Labgeneesk., p. 201‐203
Rogers, R. (1994). The development of 30 minute ESR's on the 'StaRRsed' ESR Analyser. Medical
Laboratory World.
‐ 17 ‐RR Mechatronics Westergren ESR Measurement
Saadeh, C. (1998). The erythrocyte sedimentation rate: old and new clinical applications. South Med
Journal, p.220‐225
Weiss G, Goodnough LT. Anemia of chronic disease. N Engl J Med. 2005; 352(10): 1011‐1023.
doi:10.1056/NEJMra041809.
www.rrmechatronics.com
‐ 18 ‐Westergren ESR Measurement RR Mechatronics
Notes
‐ 19 ‐Mechatronics Instruments B.V.
De Corantijn 13
1689 AN Zwaag, The Netherlands
T + 31 229 291 129
sales@rrmechatronics.com
Mechatronics USA LLC
20 Altieri Way, Unit 4
Warwick, RI 02886 USA
T + 1 401 431‐6101
salesamericas@rrmechatronics.com
www.rrmechatronics.com
WP‐001, rev. 005You can also read