Field measurement of contact forces on rollers for a large diameter pipe conveyor - De Gruyter
←
→
Page content transcription
If your browser does not render page correctly, please read the page content below
Open Eng. 2021; 11:130–141

Research Article

E. Bombasaro* and R. Oddera

Field measurement of contact forces on rollers for
a large diameter pipe conveyor
https://doi.org/10.1515/eng-2021-0014                          left to its own experience. The lack of standards and guide-
Received Sep 09, 2020; accepted Nov 04, 2020                   lines is also expressed in [1] and [2].
                                                                     Current works [1, 3–10] and [11] have studied and col-
Abstract: An intensive field measurement was carried out
                                                               lected in dept the behaviour of belt forming forces. How-
to assess the force acting on the rollers for a large diameter
                                                               ever, all the measurements are carried out on test stands
pipe conveyor. A special idler enclosing two dynamome-
                                                               and the obtained results are not compared to measure-
ters was designed and installed in the various roller posi-
                                                               ments taken on executed and operational pipe conveyors.
tions. The forces on the rollers were metered while the con-
                                                               The principal aim of the cited studies was to detect abnor-
veyor was running with and without conveying material.
                                                               mal behaviour or as in [12] to assure the belt having suffi-
The position of the two dynamometers was such allowing
                                                               cient stiffness to not collapse during operation.
to derive the theoretical contact point of the belt onto the
                                                                     [13] and [14] approached the belt forming forces prob-
roller. The measurements were carried out in a straight sec-
                                                               lem with the means of finite element analysis. Unfortu-
tion of the pipe conveyor and in the centre part of a horizon-
                                                               nately, both studies again only compare to laboratory ex-
tal curve. Obtained data are presented, analysed, and com-
                                                               periments.
pared with the values from a six-point stiffness testing de-
                                                                     In contrast [15] and [16] did measurements on an exist-
vice. Further, the participation factor of the material load
                                                               ing pipe conveyor, but unfortunately lacked a direct com-
on the roller forces for a single roller is derived. The study
                                                               parison to estimated values or laboratory experiments.
concludes with a critical review of the findings comparing
                                                                     All above cited works present a deep insight into the
them with results presented in the literature.
                                                               behaviour of belt stiffness and associated belt forming
Keywords: Belt roller contact force, Rubber-textile belt, forces. Dependencies on belt forming forces were investi-
Pipe conveyor, Six-point Stiffness Testing Device, Field gated varying belt tension, position and material fill. The
measurement                                                    studies did those investigations for pipe conveyors with di-
                                                               ameters up to 350mm.
                                                                     Starting from the existing knowledge presented above,
                                                               this work wants to contribute with roller load data mea-
1 Introduction
                                                               sured during commissioning on a large diameter pipe con-
                                                               veyor. Those data are compared with experimental results
The design engineer of a pipe conveyor needs to take a
                                                               from a six-point stiffness test device. The study is pushed
series of decision establishing the design and characteris-
                                                               further investigating probabilistic characteristics of the
tic of every single component. The State-of-the-Art knowl-
                                                               forces on the rollers and with the help of signal identifi-
edge allows the designer to take sound and economically
                                                               cation, the belt behaviour is characterised.
choices for up to medium size pipe conveyors. When it
comes to large diameter pipe conveyors, references and
or design guidelines become rare or not existing at all.
Whereas, most design parameters can be extrapolated,
                                                               1.1 System
when it comes to the roller design, the engineer is mostly
                                                               The pipe conveyer is part of a coal thermoelectric power
                                                               plant, conveying the coal from the jetty into the coal stor-
                                                               age. The conveyor starts out on the ground in a straight
                                                               line, then makes a horizontal curve to the right and gains
*Corresponding Author: E. Bombasaro: Bedeschi
                                                               elevation to the coal storage building top. The pipe con-
SpA, Via Praimbole 38, 35010 Limena (PD), Italy; Email:
emanuel.bombasaro@bedeschi.com                                 veyor   system with all its dimension and main technical
R. Oddera: Bedeschi SpA, Via Praimbole 38, 35010 Limena (PD),  data   are  represented in Figure 1. The panel spacing along
Italy; Email: roberto.oddera@bedeschi.com                      straight sections of the conveyor is 2.2m were as in curved
  Open Access. © 2021 E. Bombasaro and R. Oddera, published by De Gruyter.      This work is licensed under the Creative Commons
Attribution 4.0 License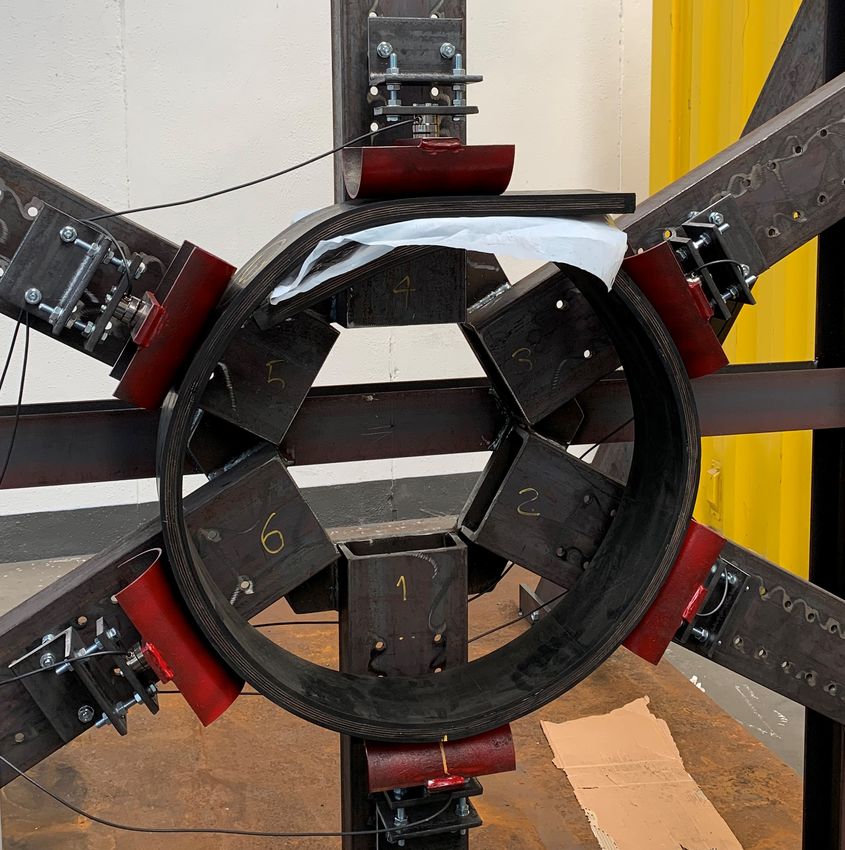
Field measurement of contact forces on rollers for a large diameter pipe conveyor | 131

                                                                                                 L3
                                L1            RH = 453m          L2 RV = 450m                    97m
                                                                            ◦
    Material loading         1305m            φH = 45◦          295m φV = 14                                        Head Pulley
                                          A
              Motor 3
      Tail Pulley                                                                                                  Material ditching
                                          A

                                L1                                                                              Motor 1+2
                                                             RH
                             1305m                                =4
                                                             φH        53m               mcw = 46t
                                                                  =4
                                                                       5◦
      Tail Pulley

                                     Panel 145
                                                       Panel 711

                                                                                          L2 m
                                                                                         29
  Technical characteristics:

                                                                                             5

                                                                                                  RV
  Conveyor capacity      3000 th−1

                                                                                                       =
  Volumetric capacity    1157 m3 s−1                       Section A-A

                                                                                              φV

                                                                                                       45
                                                                                                   =
  Fill rate                70 %

                                                                                                           0m
                                                                                                      14
                          5.0 ms−1

                                                                                                       ◦
  Conveyor speed
                                                                  04
  Material unit mass    166.7 kgm−1
                                                           05

                                                                        03

  Belt width             2600 mm

                                                                                                                    L3
                                                                                 Carrying

                                                                                                                 97
  Belt thickness           28 mm

                                                                                                                   m
                                                           06

                                                                        02

  Belt type             EP2000/5 6+4                              01
  Belt unit mass           93 kgm−1
                                                                  10
  Length between centres 2155 m
                                                           09

                                                                        11

  Lifting height           33 m
                                                                                 Return                                  Head Pulley
  Overall belt length    4382 m
                                                           08

                                                                        12

  Pipe diameter           700 mm
                                                                  07
  Overlap                 495 mm

Figure 1: Pipe system in sectional and plan view, including technical characteristics.

sections (vertical and horizontal) the panel spacing is                     id is ID number, yyy panel number, rr roller number, tttt
1.6m.                                                                       belt running condition, ss if a stiffener profile was applied
                                                                            to the panel SY(yes) or SN(no) and nnnn additional notes
                                                                            (may be suppressed).
1.2 Definitions                                                                  This naming convention is used throughout this docu-
                                                                            ment. For example, 01_145_08_all_SN means a measure-
Throughout the document rollers and panels are identified                   ment with ID 01, taken on panel 145 of roller 08 in all con-
with numbers. The individual numbers of the rollers are                     ditions (start, running and stop) without stiffener profile
shown in Section A-A in Figure 1.                                           on panel.
    Roller numbers have been attributed anticlockwise in                         During commissioning phase light vibrations on the
the running sense of each strand of the conveyor. Panels                    panels were observed. To mitigate those vibrations a stiff-
where numbered on site increasing from the jetty towards                    ener profile was applied horizontally in the vertical cen-
the storage building.                                                       tre of the panel. Aiming to understand, if the vibrations
    The single measurements on the rollers are labelled                     have any influence on the roller loads. Measurement cam-
with following string: id_yyy_rr_tttt_ss_nnnn. Where
132 | E. Bombasaro and R. Oddera
paigns were carried out with and without the stiffener pro-
file showing no influence whatsoever.
2 Laboratory experiments
The transverse flexibility of the belt is experimented by
testing a 150mm wide section in a six-point stiffness test
device. This test configuration can be considered the min-
imum and most simple setup to investigate the belt be-
haviour in terms of forming a pipe and as such is widely
used.
For this study two stripes of belt were prepared accord-
ing to recommendations given in [17]. [10] gives a good
summery of validated test rigs. A large variety of more or
less complex test stand exist, some even tensioning the
belt. Figure 2 shows images of the six-point stiffness test
device used for this study. The contact surface properties
Figure 2: Six-point stiffness test device with sample installed in
between the rollers and belt were tried to be as realistic
carrying strain configuration.
as possible. To achieve this the contact plates were con-
vex in shape and painted. The load cells are U93 cells from
HBM. On purpose the experiment was kept simple, as the transversal steel reinforcement only in the central part and
aim was to understand if valid design parameters can be not extending out to the border.) the transversal stiffness
derived anyway. Results obtained from the contact force can be estimated following the approach described in [20].
experiment are summarised in Table 1. The contact forces Using the analytical Fertis models results in a correspond-
are measured for 5min after placing the sample in the six- ing transversal stiffness of 45 · 106 N m−2 m−1 .
point stiffness test device. The measurement rate was 5Hz
and the contact forces is the arithmetic mean, Eq. (1), of
the final 2s of the measured time series. Between the over-
lap a 0.1mm thick PTFE Film was placed in order to reduce
3 Material and methods
as much as possible friction forces. The so measured con-
Measurements on the pipe system had to be carried out
tact forces can be considered neither reduced due to the
during commissioning phase. This posed challenges not
belt opening force being reduce by the friction nor to be
only on the measurement device as such but also on the
overestimated due to be belt locking in the overlap.
installation onto the pipe system. Two locations along the
Both configurations with overlap on top and at bottom
pipe were identified, one in a straight section and one
were tested and the troughability test as per [17] was per-
in the middle of the horizontal curve. The positions are
formed.
indicatively shown in Figure 1. The two locations are on
Considering the belt in transversal direction to have
panel 145, located about 385m from tail drum and on panel
uniform stiffness (This is not correct as the belt has
Table 1: Results from the six-point stiffness test of the two 0.15m wide belt samples. For every sample the sample’s weight, troughability
and the force on roller 01 to 12 is shown. Last two rows arithmetic mean and standard deviation of measured values.
Roller
Sample Mass y max 01 02 03 04 05 06 07 08 09 10 11 12
kg m N
1 12.19 0.838 180 188 96 204 5 125 277 30 76 95 106 36
2 11.97 0.830 167 191 83 178 22 131 276 58 94 77 113 69
µ 12.08 0.834 173 189 89 191 14 128 277 44 85 86 109 52
σ 0.16 0.006 9 2 9 18 12 4 1 20 12 13 5 23Field measurement of contact forces on rollers for a large diameter pipe conveyor | 133
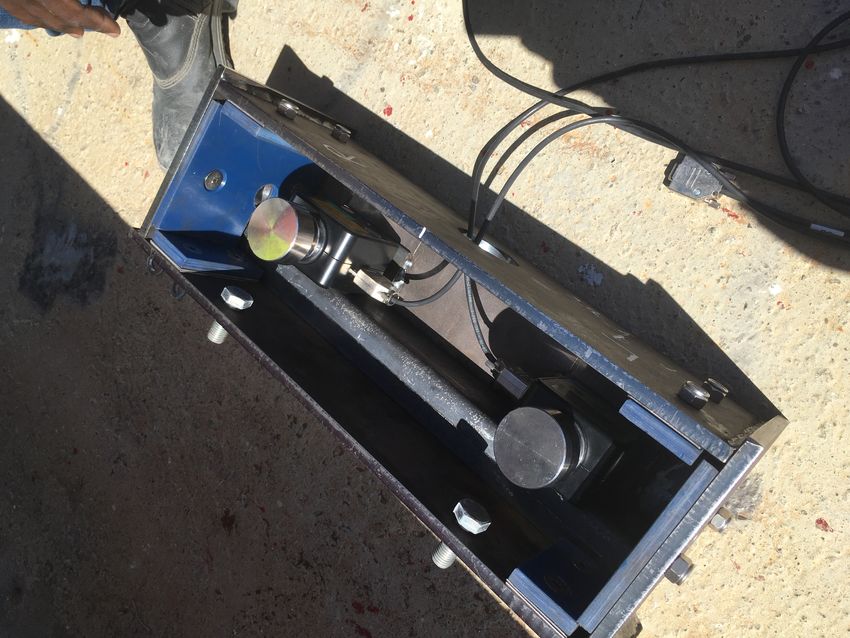
(a) View of the two digital dynamometers (b) Special idler installed in position 07 on panel 145.
seen in the open special idler.
Figure 3: Special idler constructed for measuring force excreted onto the roller.
711 located about 1555m from tail. Panel 711 is in the hor-
izontal curve’s middle. Those location were chosen such
4 Field measurement results and
to obtain representative data to directly compare with the discussion
laboratory experiments.
A special idler was constructed to measure forces ex- The raw data for every roller position needed pre-
creted onto the rollers by the belt system, see Figure 3. This processing before undergoing specific analysis. Due to the
idler housed two digital dynamometers equipped with a inherent functionality of the RS232C interface the logs of
spherical loading head on top. The roller support rests the two dynamometers are not done at the same time in-
freely on top of the loading heads and any possible con- stant. Performing any operations (e.g. F tot = F left + F right )
tact with the housing was reduced as much as possible. on the two signals F left and F right required to re-sample
The digital dynamometer has a resolution of 5N and the them to make the discrete values have identical time in-
registered values can be logged via RS232C on a computer. stants.
The special idler housing was fixed with the same bolts to In the first part, the data are analysed in the time do-
the panel as the standard idlers and care was taking to not main, performing auto-covariance and cross-covariance of
alter roller the position. the signals. As special cross-covariance is made between
In total measurements were taken in 22 roller positions the signal and an identification function in order to iden-
on panel 145 and 711, not measuring roller in position 05 tify individual sections of the belt. The study in the time
and 09 on panel 145. In each roller position the force of the domain is concluded with probability density of the force
left F left and right F right dynamometer was logged with a signals. In the second part, the deviation angle δ from the
sample rate of 5Hz. The minimum measurement duration roller centre to the presumed contact point (see Figure 11)
of each roller position was well beyond 900s. This is the is derived and the data presented in radial graphs. A quick
time needed for the belt to complete one full revolution at view on the probability density of the deviation angle con-
a speed of 5.0ms−1 . cludes the study. The last and third part shows the results
During most measurements, the absorption of the of forces on roller 01 on panel 145 while coal is conveyed.
three motors and other drive related parameters were The section concludes with a table collecting the contact
logged. Those data were used to verify the overall system force values and comparing them to the experimentally ob-
behaviour during roller force measurement but are not dis- tained values.
cussed further.134 | E. Bombasaro and R. Oddera
4.1 Time domain analysis correlation and autocorrelation (signal correlated with it-
self) for finite-duration sequences x(n) and y(n) can be ex-
The individual signals were visually inspected for any pressed as
anomalies. In this process the boundaries, start and end
N−|k|−l
of measurement period, were set. Figure 4 show the left ∑︁ (︀ )︀ (︀ )︀
c xy (l) = x(n) − µ x y(n − l) − µ y (3)
F left and right F right roller force data as well as the summed
n=i
force F tot .
N−|k|−l
A further target was to identity the force F static acting ∑︁ (︀ )︀ (︀ )︀
on the rollers with the belt at rest. From looking at the sig- c xx (l) = x(n) − µ x x(n − l) − µ x (4)
n=i
nals it became clear that after the belt halted the roller
force reached a constant value after about 10s. This con- where i = l, k = 0 for l ≤ 0, and i = 0, k = l for l < 0
stant value is taken as static roller force F static . The static following [18], mean see Eq. (1). The cross-correlation can
force F static for the various roller positions can be found in be normalised following
Table 2. c xy (l)
c̄ xy (l) = √︀ (5)
Looking at the signal in Figure 4 a not surprising repet- c xx (0)c yy (0)
itive pattern becomes visual. In addition, the signal shows
distinct footprints i.e. offset of the mean for a certain du- and the autocorrelation can be normalised following
ration. Detecting those regularities can reveal fundamen- c xx (l)
c̄ xx (l) = . (6)
tal in context of computerized system identification and c xx (0)
anomaly detection.
All temporal correlation studies are carried out on the
The arithmetic mean µ f of a finite-duration sequences
summed roller force F tot . The above formulae are only
f (i) with number of elements N is defined as
valid when the signal is discrete in time with constant sam-
N pling rate. In consequence the time interval has no influ-
1 ∑︁
µf = f (i) (1) ence on the correlation. In the following, lag is number of
N
i=1
discrete sample points, i.e. with a sampling frequency of
and the standard deviation σ f as 5Hz, 1 lag corresponds to 0.2s.
⎯
⎸ N
As the belt is a continuous loop, the expectation is the
⎸ 1 ∑︁ )︀2
signal to repeat itself after the belt to complete one full
(︀
σf = ⎷ f (i) − µ f . (2)
N−1 revolution. Therefore, the autocorrelation should give the
i=1
A powerful instrument to understand temporal sim-
ilarity of two series is the cross-correlation. The cross-
1 0
22
=4
2
24 77 lag
=1 17 2n
d
15_145_01_all_SN 0.5 l ag lag=
2500 3rd 4th
0
2000
-0.5
0 2000 4000 6000
1500
force [N]
45_711_09_all_SN
1500
1000
1000
500
500
0
59500 60000 60500 61000 61500 62000 0
time [s] 0 5000 10000 15000
711_09 711_09 shifted by 2nd peak lag
Figure 5: Upper plot normalised auto-correlation with 2nd to 4th
Figure 4: Left, right and summed force acting on roller 01 on panel peak identified. Bottom plot signal overlaid with shifted signal by
145. The boundary indicates start and end of measurement. 2nd peak’s lag. Signal name indicated in the title of bottom plot.Field measurement of contact forces on rollers for a large diameter pipe conveyor | 135
second highest correlation value exactly when the signal
starts to repeat itself. in the upper part Figure 5 shows the 0.4
autocorrelation function identifying 2nd to 4th peak, in the
0.2
lower part the signal is overlaid with itself shifted for the
lag of the second most significant peak. 0
Looking at the autocorrelation analysis of all signals
shows the 2nd peak’s lag to range from 4214 × 0.2s to 0 1000 2000 3000 4000
4232 × 0.2s. With an effective belt speed of 5.18ms−1 (the
belt more likely runs at the speed of its external surface 03_145_12_all_SY with 07_145_08_all_SN
3000
when wrap around a driving drum) the lag translate into a
belt length of 4366m to 4384m. This is well in line with the
theoretical overall belt length of 4382m leading to a max- 2000
imum length error of −0.3% in relation to the theoretical
belt length.
The cross-correlation calculated between two differ- 1000
0 2000 4000 6000 8000
ent roller force measurements indicates of the degree of
similarity. In Figure 6 this is done for the roller 04 and 07 on 145_12 145_08 shifted by 1st peak lag
panel 145. Although, apparently the signals have low simi-
Figure 7: Upper plot normalised cross-correlation of loads on two
larity the cross-correlation maximises with c̄ xy = 0.645. different rollers indicating 1st to 3rd peak. Bottom plot signal over-
The cross-correlation was calculated for multiple com- laid with shifted signal by 1st peak’s lag.
bination of roller positions. What comes apparent is that
the cross-correlation value as such may not be very high
as
however, the peaks are distinctive, see Figure 7.
When the cross-correlation is computed between a sig-
{︃
F const. if 0 ≤ t < t0
nal and a defined function (or template function), patterns F̃(t)tmp = F(t)tmp − m F(t)tmp = (7)
ε if t0 ≤ t
on the signal can be identified. The aim here is to identify
individual belt sections revealing themselves with an off- with F const. constant value, ε a sufficient small number
set mean value. The template function F̃(t)tmp is defined close to 0. The belt section length s is considered as
its travel time t0 = s/v. Following values were applied
0.6
0.4 1st
0.4 2nd
0.2 4th 3rd
5th
0 0.2
-0.2
0
0 1000 2000 3000 4000
0 1000 2000 3000 4000 5000 6000
23_145_04_all_SN with 09_145_07_all_SN
31_711_10_all_SN with pattern
4000 2000
3000 1500
2000 1000
0 1000 2000 3000 4000 5000
500
0 2000 4000 6000 8000
145_04 145_07 shifted by 1st peak lag
Figure 6: Upper plot normalised cross-correlation of loads on two
different rollers indicating 1st to 3rd peak. Bottom plot signal over- Figure 8: Upper plot normalised cross-correlation between roller
laid with shifted signal by 1st peak’s lag. force and template function indicating 1st to 5th peak. Bottom plot
roller force signal with marked areas of identified belt section.136 | E. Bombasaro and R. Oddera
Table 2: Compendium of measured force on rollers. Forces are scaled to a 1.0m long belt element.
Roller
Value Unit 01 02 03 04 05 06 07 08 09 10 11 12
Laboratory experiment
µ F exp Nm−1 1157 1261 594 1274 93 855 1844 295 565 575 728 349
σ F exp Nm−1 60.1 13.1 61.2 118.5 81.1 27.6 3.4 131.3 83.1 85.9 33.4 152.5
Field measurement on Panel 145
µ F tot Nm−1 899 693 257 861 - 924 1803 768 - 439 640 814
σ F tot Nm−1 42.7 34.5 50.3 53.3 - 46.8 103.5 112.3 - 132.4 125.2 102.7
F static Nm−1 837 652 246 653 - 802 1494 664 - 333 411 667
∘
µδ 0.93 -1.43 4.11 -4.14 - -2.06 4.19 7.84 - -0.56 2.50 -10.43
∘
σδ 0.573 0.546 3.479 1.219 - 0.478 0.901 1.483 - 0.738 0.650 1.396
Field measurement on Panel 711
µ F tot Nm−1 1351 1421 1087 1062 156 666 1801 779 357 652 1186 1539
σ F tot Nm−1 64.7 65.8 62.8 99.5 44.5 68.0 154.0 152.0 166.5 170.3 139.7 169.0
F static Nm−1 1116 1040 749 562 203 499 1658 572 203 549 895 1450
∘
µδ -1.48 -4.76 7.01 -5.21 14.44 7.39 2.20 7.31 5.13 -0.96 -3.52 -8.44
∘
σδ 0.472 0.603 1.315 1.219 5.710 0.544 0.925 1.137 1.564 0.640 0.450 1.271
0.007 0.014
0.006 0.012
0.005 0.010
0.004 0.008
0.003 0.006
0.002 0.004
0.001 0.002
0.000 0.000
0 500 1000 1500 2000 2500 0 500 1000 1500 2000 2500 3000
15_145_01 19_145_02 13_145_03 29_711_01 49_711_02 39_711_03
23_145_04 27_145_06 51_711_04 37_711_05 53_711_06
Figure 9: Probability density of the force on the rollers on panel 145 Figure 10: Probability density of the force on the rollers on panel 711
carrying strain. carrying strain.
F const. = 485N, ε = −4.85N and belt section length s = ble 2. The plots and values are derived taking one complete
180m. revolution of the belt.
Figure 8 shows that in the 4223 lags long belt three dis- The first thing, coming apparent comparing Figure 9
tinct belt sections were identified. These three belt sections and Figure 10 is the shift of the force on rollers on panel
can be understood as to be stiffer in transversal direction 711. As expected, roller 02 and 03 located towards the cen-
and in consequence exerting higher forces on the roller. tre of the horizontal curve increase whereas roller 05 and
The probability density for the force acting on the car- 06 decrease. The top and bottom rollers 01 and 04 do not
rying strand rollers are shown in Figure 9 and Figure 10. change significantly.
Together with the probability density the mean µ meas and Assuming the force on the roller to be a uniform
standard deviation σ meas of the force is computed, see Ta- stochastic process, the force distributions should be nor-
mally distributed. However, a certain level of divergenceField measurement of contact forces on rollers for a large diameter pipe conveyor | 137
can be observed. Among others, this can be attributed to The probability density distribution of the deviation
the non-uniformity of the individual belt sections. angle δ is shown in Figure 16. The mean µ δ and standard
deviation σ δ of the deviation angle δ is listed in Table 2.
4.2 Radial representation 4
An interesting parameter to investigate is the theoretical
contact points of the belt on the rollers. The contact point
location for every roller can be estimated based on the two 5 3
(left and right) dynamometer readings. The deviation an-
gle δ between the roller centre and the contact point is de-
fined as graphed in Figure 11 and expressed in Eq. (8).
F right
(︂ )︂
∆L 1
sin δ = − , (8) 0 1000 2000 3000
R 2 F left + F right
with ∆L axial distance of the load cells 300mm, and R ex-
ternal radii of pipe 350mm. The measurement idler was
always installed such that the left dynamometer is in anti- 6 2
clockwise position of the right one.
Figure 12,13,14 and 15 show the force on the roller for
all measured roller positions on panel 145 and 711. It can
be observed that the mean deviation angle is never 0∘ and 1
thus the contact points is not in the roller centre. Worth
noticing is that, the contact point on rollers left and right
from the overlap move towards it. This independent if the Figure 12: Plot showing forces F tot on panel 145 carrying strain
panel is located in a horizontal curve or not. rollers, together with the mean force µ F tot and mean angle µ δ are
shown.
10
∆L
Flef t Fright
9 11
contact point
0 2000 4000 6000
δ
R 8 12
7
Figure 13: Plot showing forces F tot on panel 145 carrying return
rollers, together with the mean force µ F tot and mean angle µ δ are
Figure 11: Definition of the deviation angle δ between the roller shown.
centre and the theoretical contact point.138 | E. Bombasaro and R. Oddera
4 1.2
1
probability density [-]
0.8
5 3
0.6
0.4
0 1000 2000 3000 0.2
0
-15 -10 -5 0 5 10 15
[°]
6 2
31_711_10 33_711_12 35_711_08
41_711_11 43_711_07 45_711_09
Figure 16: Probability density of deviation angle δ on panel 711
return strain rollers.
1
59_145_01_load_SY and flow rate
Figure 14: Plot showing forces F tot on panel 711 carrying strain 5000
rollers, together with the mean force µ F tot and mean angle µ δ are
force [N] or flow rate [t/h]
shown. 4000
10
3000
2000
9 11
1000
0
645400 645600 645800 646000 646200
time [s]
0 1000 2000 3000 4000 5000
Figure 17: Left, right and summed force acting on roller 01 on panel
145 while conveying material. On the same axis the instantaneous
8 12 material flow rate is plotted. The boundary indicates one complete
belt length.
forces on roller denominated with F ... measured without
7
conveying material. For the sake of clarity when material
is conveyed the forces are denominated with L ... . The mea-
surements were carried out in two occasions with measure-
Figure 15: Plot showing forces F tot on panel 711 return strain rollers,
together with the mean force µ F tot and mean angle µ δ are shown.
ment duration larger than one hour. Figure 17 shows the
measured forces together with the instantaneous material
flow rate Q(i).
4.3 Force on roller while conveying The roller forces with and without conveying material
can be set in following relation
Commissioning phase foresaw several conveying material
tests. During such test the forces L left and L right acting on F tot,n = L tot,n − W mat φ n , (9)
roller 01 on panel 145 were measured. To differentiate fromField measurement of contact forces on rollers for a large diameter pipe conveyor | 139
with Q(i) instantaneous material flow rate, v = 5.18ms−1
0.3
and l = 2.2m panel spacing. Here, the instantaneous ma-
0.2
terial flow rate Q(i) is indicated as a function of (i) to un-
0.1 derline it being a non-constant finite-duration sequences.
0 On the conventional conveyor belt feeding the pipe, a
-0.1 weight scale is installed metering the instantaneous ma-
0 1000 2000 3000 4000
terial flow rate Q(i). The instantaneous material flow rate
Q(i) gauged at the scale reaches panel 145 approximately
57_145_01_load_SY with 15_145_01_all_SN 84.8s later. For the analysis Q(i) was shifted accordingly
2500
in time.
Finally, the participation factor φ n of material load on
2000
force on roller n can be expressed as
µ L tot,n − µ F tot,n
φn = , (11)
µ W mat
1500
0 1000 2000 3000 4000 5000 6000
with arithmetic mean µ ... taken over one belt length. From
the data analysis a participation factor φ01 = 0.68 results.
Similar, although slightly smaller value was found by [14].
Figure 18: First example: Cross-correlation of measured force on
For conventional belt conveyors with trough angle of 60∘
roller with and without material being conveyed. In the bottom plot
signal overlaid with shifted signal by 1st peak’s lag. the participation factor φ n is slightly larger, see [19].
Figure 18 and 19 show two examples of the cross-
correlation of the measured force on roller with and with-
0.4 out material being conveyed. For both examples good
cross-correlation is achieved and the L tot − W mat φ01 sig-
0.2 nal has the same distinctive patter as F tot . The lag is not
0 the same in both examples as the pipe conveyor was halted
and restarted in-between.
-0.2
0 1000 2000 3000 4000
59_145_01_load_SY with 15_145_01_all_SN
4.4 Data compendium
2200 Table 2 collects the data from laboratory experiment and
2000 field measurements. The values are stated for a 1m long
belt segment. Following scale factors apply, 1/0.15m for
1800 laboratory experiment, 1/2.2m on panel 145 and 1/1.6m
1600 on panel 711.
0 1000 2000 3000 4000 5000 To evaluate the exactness of the measurements the
sum of vertical forces (including belt mass) and the sum
of horizontal forces is related to the total sum of roller
Figure 19: Second example: Cross-correlation of measured force on
forces. In perfect condition this ratio would result zero. For
roller with and without material being conveyed. In the bottom plot
the laboratory experiments the vertical force ratio is 0.036
signal overlaid with shifted signal by 1st peak’s lag.
and the horizontal ratio 0.097. During the field measure-
ments only on panel 711 all 6 rollers where measured. The
with W mat material weight and φ n participation factor of vertical force ratio is 0.067 and the horizontal force ratio
material load on force on roller n. The material weight 0.122. When making the sum of horizontal forces the esti-
W mat can be derived from the instantaneous material flow mated horizontal radial force due to belt tension was con-
rate Q(i). sidered. The ratios result sufficient small to proof the val-
ues trustworthy.
Q(i)
W mat = l (10) In general terms it becomes apparent that the field
v
measurements for panel 145 and 711 are well aligned. For
both panel and on the carrying and return strain, the most140 | E. Bombasaro and R. Oddera
loaded roller (apart from belt and material mass) is the one Based on this study it becomes immanent that, there
where the overlap rests, rollers 04 and 07. The laboratory is limited knowledge when it comes to the design of large
experiment compared to panel 145, give values indicatively diameter pipe conveyors. The lack of a sound analytical
in line. However, the laboratory values are not sufficiently model and or experimental setup to estimate the contact
exact to base the roller design on. Computing F static ratio forces make a reliable design difficult and specially to per-
µ F tot shows that the static force can be as low as 53% of form an economic design nearly impossible. The data here
µ F tot . presented however, give a solid reference in terms of force
magnitude and distribution for pipe conveyor systems uti-
lizing belts with similar transversal stiffness and width.
5 Conclusion
The forces acting on pipe conveyor rollers were assessed 6 Declaration of Competing
with a special idler mounted in different roller and panel
position while and while not conveying material. These
Interest
data were analysed in the time domain and the theoreti-
The authors declare that they have no known competing fi-
cal contact point calculated. Main stochastic parameters
nancial interests or personal relationships that could have
of the force acting onto the rollers are derived and the sys-
appeared to influence the work reported in this paper. Fur-
tem identified with help of cross-correlation.
ther, this research did not receive any specific grant from
During these analyses it could be shown that a system
funding agencies in the public, commercial, or not-for-
identification can be performed on the force signals. Espe-
profit sectors.
cially, individual belt section could be clearly identified,
proofing the general non uniformity of the belt in terms of
transversal stiffness.
One cardinal point is the belt tension [4], which has 7 Data Availability Statement
an important role in the roller forces. This manifest the
large difference between static force and force acting while Some or all data, models, or code generated or used during
the conveyor is running on the rollers. An important fac- the study are proprietary or confidential in nature and may
tor which must be considered when dealing with high ten- only be provided with restrictions. The system descrip-
sional force in belt are installation tolerances. Which, as tion, drawings and photos are restricted. The measured
small as they may be, by deviating the belt increase the data that support the findings of this study are available
force acting on the rollers significantly. from the corresponding author, [E.B.], upon reasonable re-
Comparing forces on rollers whilst conveying material quest. The data analysis code is shared under Attribution-
with forces without conveying material allows to derive the NonCommercial 4.0 International (CC BY-NC 4.0).
material load participation factor for every roller. For the
roller in central bottom position is results in φ01 = 0.68.
To further enhance the presented method, it would be
necessary to make a permanent installation and measure
References
simultaneously the forces on all rollers. Combined with [1] M. Zamiralova, G. Lodewijks, Pipe conveyor test rigs: Design,
an evaluation unit it would allow for a continuous sys- application and test results – part a, Bulk Solids Handling 34 (5)
tem monitoring. To increasingly fine tune the overall sys- (2014) 40–45.
tem characterisation the horizontal roller force component [2] V. Molnár, G. Fedorko, M. Andrejiová, A. Grinčová, M. Kopas,
and the belt tension should be included into the analysis. Monitoring of dependences and ratios of normal contact forces
on hexagonal idler housings of the pipe conveyor, Measure-
Finally, the measured values are compared with those
ment 64 (2015) 168–176. http://dx.doi.org/10.1016/j. measure-
obtained from a six-point stiffness test. This test allows ment.2014.12.055.
to gain insight into the behaviour of the belt and contact [3] V. Molnár, G. Fedorko, B. Stehlíková, Ľ. Kudelás, N. Husáková,
forces. However, they are not sufficient representative to Statistical approach for evaluation of pipe conveyor’s belt con-
base design decisions on. In the laboratory the friction in tact forces on guide idlers, Measurement 46 (9) (2013) 3127–3135.
http://dx.doi.org/10.1016/j.measurement.2013.06.019.
the overlap is reduced as much as possible, however its
[4] V. Molnár, G. Fedorko, B. Stehlíková, P. Michalik, M. Kopas,
possible impact especially in the field is not sufficiently Mathematical models for indirect measurement of contact
considered. forces in hexagonal idler housing of pipe conveyor, Measure-Field measurement of contact forces on rollers for a large diameter pipe conveyor | 141
ment 47 (2014) 794–803. http://dx.doi.org/10.1016/j.measurem [12] M. Barburski, Analysis of the pipe conveyor belt pressure on the
ent.2013.10.012. rollers on its circuit., Journal of Industrial Textiles 45 (6) (2016)
[5] V. Molnár, G. Fedorko, M. Andrejiová, A. Grinčová, P. Michalik, 1619–1634.
Online monitoring of a pipe conveyor. part i: Measurement and [13] Y. cun Guo, S. Wang, K. Hu, D. yong Li, Optimization and experi-
analysis of selected operational parameters, Measurement 94 mental study of transport section lateral pressure of pipe belt
(2016) 364–371. conveyor, Advanced Powder Technology 27 (4) (2016) 1318–1324.
[6] V. Molnár, G. Fedorko, M. Andrejiová, A. Grinčová, P. Michalik, [14] Q. Zheng, M. Xu, K. Chu, R. Pan, A. Yu, A coupled FEM/DEM model
Online monitoring of pipe conveyors part II: Evaluation of se- for pipe conveyor systems: Analysis of the contact forces on belt,
lected operational parameters for the design of expert system, Powder Technology 314 (2017) 480–489.
Measurement 104 (2017) 1–11. [15] T. Bahke, Calculation criteria and application of “rollgurt” - con-
[7] V. Molnár, G. Fedorko, L. Homolka, P. Michalik, Z. Tučková, Util- veyor (tube conveyor), in: BELTCON 6: International Materials
isation of measurements to predict the relationship between Handling Conference (IMHC), South Africa, Johannesburg, 1991.
contact forces on the pipe conveyor idler rollers and the tension [16] S. Hötte, Experimentelle Untersuchungen zu den Normalkräften
force of the conveyor belt, Measurement 136 (2019) 735–744. bei Schlauchgurten, no. ITA 03/2014, PZH Verl., TEWISS - Technik
[8] V. Molnár, G. Fedorko, S. Honus, M. Andrejiová, A. Grinčová, und Wissen, Garbsen, 2014.
P. Michalik, Prediction of contact forces on idler rolls of a pipe [17] ISO 703:2007, Conveyor Belts – Transverse Flexibility (Trougha-
conveyor idler housing for the needs of its online monitoring, bility) – Test Method, International Standard ISO, 2007.
Measurement 139 (2019) 177–184. [18] J. G. Proakis, D. G. Manolakis, Digital signal processing: Princi-
[9] M. Zamiralova, G. Lodewijks, Measurement of a pipe belt con- ples, Algorithms, and Applications, third edition Edition, Prentice
veyor contact forces and cross section deformation by means of Hall, 1996.
the six-point pipe belt stiffness testing device, Measurement 70 [19] K. J. G. K. Grabner, F. Kessler, Research into normal-forces be-
(2015) 232–246. tween belt and idlers at critical locations on the belt conveyor
[10] M. Zamiralova, G. Lodewijks, Pipe conveyor test rigs: Design, track, Bulk Solids Handling 13 (4) (1993) 727–734.
application and test results – part b, Bulk Solids Handling 34 (6) [20] M. Zamiralova, G. Lodewijks, Review of the troughability test ISO
(2014) 38–46. 703 for quantifying a uniform transverse bending stiffness for
[11] M. Zamiralova, G. Lodewijks, Pipe conveyor test rigs: Design, conveyor belts, Archives of Civil and Mechanical Engineering 17
application and test results – part c, Bulk Solids Handling 35 (1) (2017) 249–270.
(2015) 42–49.You can also read