Model for Cryogenic Flashing LNG Leak - Article - MDPI
←
→
Page content transcription
If your browser does not render page correctly, please read the page content below
applied
              sciences
Article
Model for Cryogenic Flashing LNG Leak
Boon How Lim 1 and Eddie Yin Kwee Ng 2, *

                                          1   Sembcorp Marine, 80 Tuas South Boulevard, Singapore 637051, Singapore; Boonhow.lim@sembmarine.com
                                          2   School of Mechanical and Aerospace Engineering, College of Engineering, Nanyang Technological University,
                                              50 Nanyang Ave, Singapore 639798, Singapore
                                          *   Correspondence: mykng@ntu.edu.sg

                                          Abstract: The growth of liquefied natural gas (LNG)’s importance for curbing greenhouse gas emis-
                                          sions has increased the interest in understanding LNG’s risks, particularly regarding small-diameter
                                          leaks (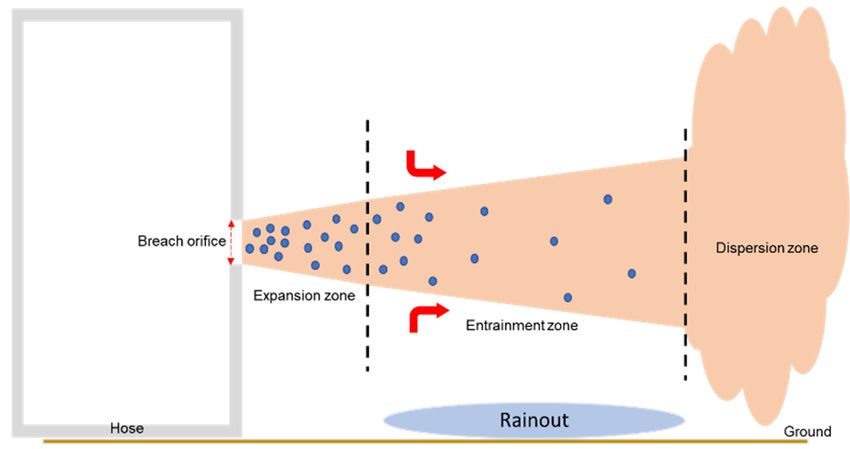
Appl. Sci. 2021, 11, 9312                                                                                           2 of 11

                            fluid dynamics. However, Navier–Stokes modeling is time consuming and the integral
                            model is used for preliminary risk assessment.
                                 Today LNG accident concern focuses on two-phase pressurized leakage through
                            connection cracks. The specification for the bunkering of liquefied natural gas-fueled
                            vessels (ISO 20519) lists the release of LNG through a broken instrument connection
                            (25 mm hole) as the likely event [8]. A full-bore rupture requires a vessel or road tanker to
                            pull away unintentionally, which is gross negligence. The United Kingdom and Singapore
                            risk guidance regulations treat a crack leak as a major concern for risk rather than a bore
                            rupture [9,10].
                                 When a pressurized cryogenic liquid leaks out into the atmosphere from a crack, it
                            will be in two phases, liquid and vapor. The depressurization process leads to mechanical
                            fragmentation of the liquid and forms vapor [11]. Additionally, the liquid will undergo
                            the rapid vaporization of liquid due to the sudden pressure drop. This rapid vaporization
                            is known as flashing. Conventionally, the non-vaporized liquid, which falls and forms a
                            puddle on the ground, is called rainout [12].
                                 Studies of a non-cryogenic orifice pressurized leak nature have been performed. The
                            Center for Chemical Process Safety (CCPS) studied the release of pressurized water and
                            trichlorofluoromethane (CFC-11) through a small orifice (6.35 mm) [13]. The CCPS study
                            found that significant mechanical fragmentation of the liquid droplet is possible, even
                            when the stagnant liquid temperature is above its ambient boiling temperature. In another
                            study, Hervieu and Veneau measured the droplet size and velocity distribution of liquefied
                            propane leaks through an 8 mm orifice [14]. A Phase Doppler Particle Analyzer (PDPA)
                            was used to measure liquid drop size and velocity. The study concluded that vaporization
                            takes place along the jet in the flow direction. Additionally, higher pressure release is
                            associated with more intense flashing, leading to stronger fragmentation and a higher
                            vaporization rate. The French National Institute for Industrial Environment and Risks
                            (INERIS) performed semi-outdoor large-scale experiments to study propane and butane
                            release through orifices of up to 25 mm [15]. The purpose of the dispersion experiment is
                            to develop models of flashing releases as encountered in realistic industrial environments.
                            Both non-impinged and impinged jet releases were studied by INERIS. Rainouts were
                            collected and measured. The study concluded that mechanical fragmentation and not
                            flashing are the main mechanisms for vapor generation for propane and butane. For
                            non-impinged leaks, there is hardly any rainout for propane due to its low boiling point.
                            Up to 15% of the total mass release was recorded as rainout for the propane impinged leaks.
                            However, the collected rainout is suspected to be a mixture of ice and propane. Hence,
                            the exact propane rainout mass could not be determined. Recently, INERIS performed
                            an experiment named SPARCLING, which releases subcooled LNG up to 8 bar through
                            various orifice sizes (up to 9 mm). The study measures the size distribution and velocities of
                            LNG droplets using a dual Phase Doppler Anemometer [16]. There are two major findings
                            from SPARCLING. The first observation is that an orifice leak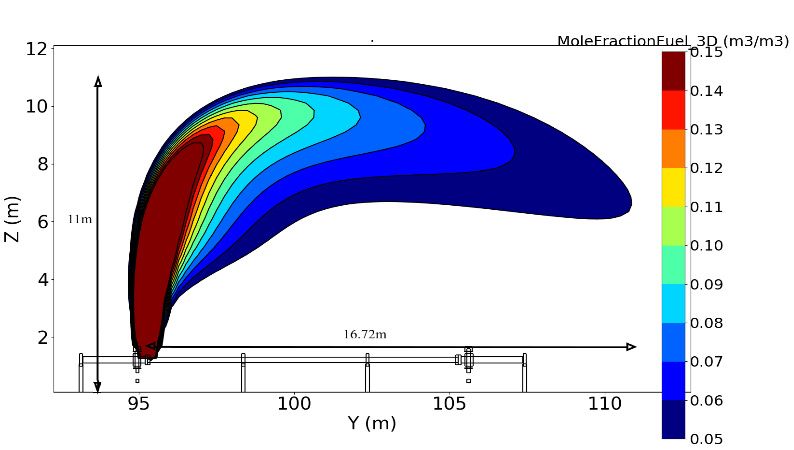
Appl. Sci. 2021, 11, x FOR PEER REVIEW 3 of 11
Appl. Sci. 2021, 11, 9312 3 of 11
Simulator (FLACS). The dispersion result is then compared with the Singapore safety
Simulatorfor
guideline (FLACS). The dispersion
LNG bunkering. The lastresult is provides
section then compared with the
a conclusion andSingapore safety
discusses future
guideline for LNG bunkering. The
work to improve the leak model. last section provides a conclusion and discusses future
work to improve the leak model.
2. Materials and Methods
2. Materials and Methods
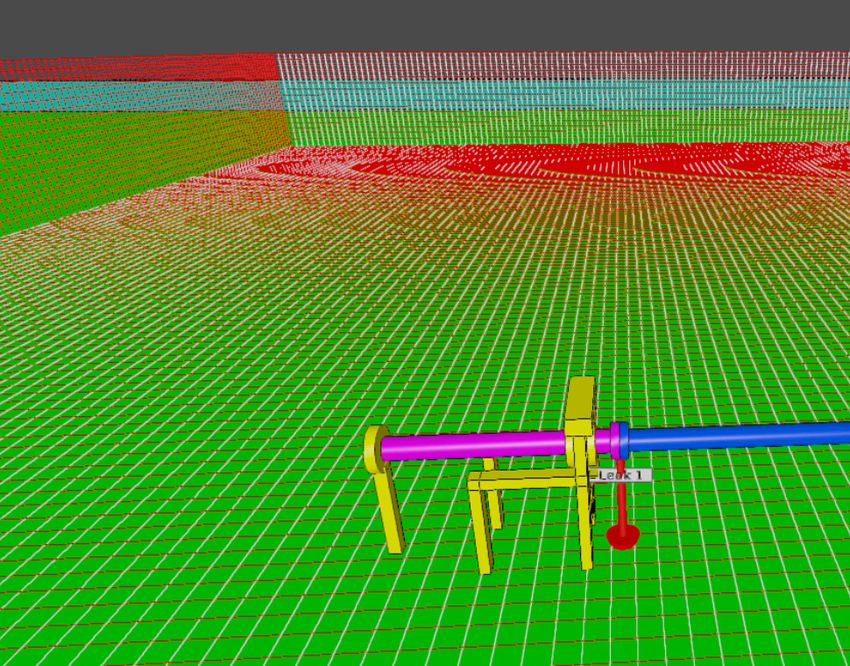
The proposed model tracks the different stages of an LNG leak. Figure 1 shows that
The proposed model tracks the different stages of an LNG leak. Figure 1 shows that
the leak starts at the breach, undergoes de-pressurization in the expansion zone, under-
the leak starts at the breach, undergoes de-pressurization in the expansion zone, undergoes
goes air mixing in the entrainment zone, and ends at the dispersion zone [18]. In the en-
air mixing in the entrainment zone, and ends at the dispersion zone [18]. In the entrainment
trainment zone, LNG that does not vaporize will fall onto the ground to form a rainout.
zone, LNG that does not vaporize will fall onto the ground to form a rainout. The leak
The leak model consists of 9 equations to quantify the leak scenario. Equations (1) and (2)
model consists of 9 equations to quantify the leak scenario. Equations (1) and (2) are for
are for the breach orifice zone. Equations (3)–(7) cover the expansion zone leak develop-
the breach orifice zone. Equations (3)–(7) cover the expansion zone leak development.
ment. Equations
Equations (8) and(8)(9)
and (9) quantify
quantify theparameter
the leak leak parameter
at the at the entrainment
entrainment zone. zone.
Figure
Figure1.
1.Schematic
Schematicrepresentation
representationof
of the
the zones
zones in
in jet
jet leak.
leak.
Themass
The massflow
flowrate
rateacross
acrossthe
theorifice
orificefor
forsubcooled
subcooledstagnation
stagnationcondition
conditionisisprovided,
provided,
as in [19]:
as in [19]: √
Q = A1 ∗ Cd 2 × [P0 − PV (T0 )] × ρ0 (1)
Q = A1*Cd √2 × [P0 − PV(T0)] × ρ0 (1)
Q is the mass flow rate. A1 is the orifice cross-sectional area. Cd is the discharge
Q is theset
coefficient mass flow rate.
as 0.62, which A1isis typical
the orifice
for cross-sectional
fluid flow across area.a Cd is the
sharp discharge
orifice. P0 iscoef-
the
ficient set as 0.62, which is typical for fluid flow across a sharp orifice. P is
stagnation pressure. PV (T0 ) is vapour pressure at stagnation temperature T0 . ρ0 is the LNG
0 the stagnation
pressure. PV(T0)atisstagnation
liquid density vapour pressure
pressure.at stagnation temperature T0. ρ0 is the LNG liquid den-
sity atThe
stagnation pressure.
leak velocity, V1 , at the orifice is calculated by:
The leak velocity, V1, at the orifice is calculated by:
V1 = Q/(A1 × ρ0 ) (2)
V1 = Q/(A1 × ρ0) (2)
In the expansion zone, the stagnation pressure will be depressurized to atmospheric
In the expansion zone, the stagnation pressure will be depressurized to atmospheric
pressure and will undergo volume expansion. If the stagnation temperature is higher
pressure and will undergo volume expansion. If the stagnation temperature is higher than
than the LNG ambient boiling temperature, a portion of the liquid will be vaporized to
the LNG ambient boiling temperature, a portion of the liquid will be vaporized to reduce
reduce the remaining liquid temperature to boiling temperature. The depressurization
the remaining
process occursliquid temperature
rapidly, and heat from to boiling
nearbytemperature. Theabsorbed
air will not be depressurization
by the cold process
LNG.
occurs rapidly, and heat from nearby air will not be absorbed
Hence, both the liquid and gas LNG will be at the same temperature (LNG ambient by the cold LNG. Hence,
both thetemperature).
boiling liquid and gas LNG will be at the same temperature (LNG ambient boiling tem-
perature).
To calculate the two-phase composition from the depressurization, HEM was used to
To calculate
determine the two-phase
the vapour mass fractioncomposition
at the endfrom the
of the depressurization,
expansion zone [18].HEM Therewas
are used
three
to determine the vapour
assumptions made in HEM. mass fraction at the end of the expansion zone [18]. There are
three assumptions made in HEM.
1. Both the liquid and gas phase temperature will be LNG ambient boiling temperature
1. Both the liquid and gas phase temperature will be LNG ambient boiling temperature
at the end of the expansion zone;
at the end of the expansion zone;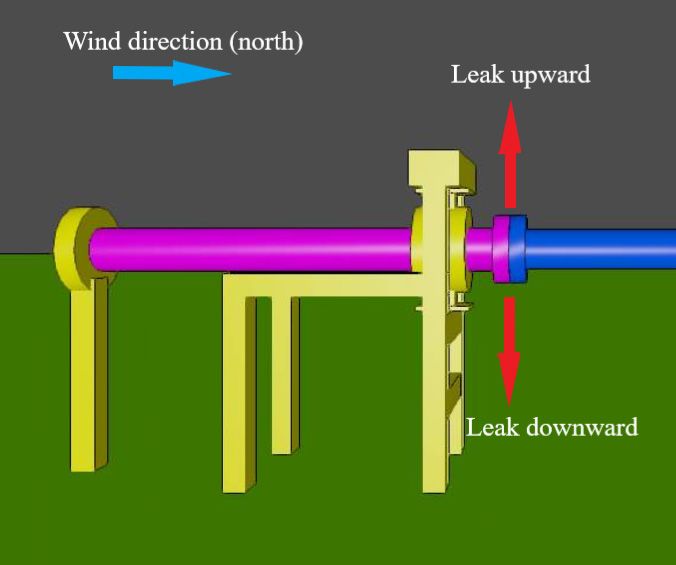
Appl. Sci. 2021, 11, 9312                                                                                                4 of 11

                                 2.   The heat exchange from vaporization is much greater than heat gain from surrounding
                                      so the warming effect is ignored;
                                 3.   The vapour mass fraction is much lower than 1.
                                      The vapour mass fraction at the end of the expansion zone is calculated as follows:

                                                                    X = Cpl × (T0 − T1 )/Lv                                 (3)

                                       X is the vapour mass fraction. Cpl is LNG liquid heat capacity at P0 and T0 conditions.
                                 T1 is LNG ambient boiling temperature set at 112 K. LV is LNG latent heat of vaporization.
                                       The two-phase leak density at the end of the expansion zone is given as follows:

                                                                  ρ2 = (1 − X) × ρL + X × ρg                                (4)

                                      ρ2 is the leak density at end of the expansion zone. ρL and ρg are the respective LNG
                                 liquid and gas densities at boiling point temperature in atmospheric pressure.
                                      Based on the conservation of mass and momentum, the condition at the beginning
                                 and end of the expansion zone can be expressed, respectively, as follows:

                                                                 ρ1 ∗ V1 ∗ A1 = ρ2 × V2 × A2                                (5)

                                                      ρ1 × V1 2 × A1 + A1 × P1 = ρ2 × V2 2 × A2 + A2 × P2                   (6)
                                      ρ1 is the LNG density at the start of the expansion zone. V1 is the leak velocity
                                 calculated from Equation (2). A1 is the orifice cross-sectional area. ρ2 is the density of LNG
                                 calculated from Equation (4). V2 is the depressurized velocity at the end of the expansion
                                 zone. A2 is the expanded cross-sectional leak area at the end of the expansion zone. P2 is
                                 atmospheric pressure.
                                      Combing Equations (5) and (6) will form quadratic Equation (7). Equation (7) was
                                 solved to find V2 , which was back substituted to Equation (5) to find A2 .
                  ρ1 × V1 × A1 × ρ2 × V2 2 − (ρ1 × V1 2 × A1 + A1 × P1 ) × ρ2 × V2 + ρ1 × V1 × A1 × P2 = 0                  (7)
                                      According to the SPARCLING experiment conducted by INERIS, pressurized LNG
                                 leak beyond 1.5 bar has zero rainout, implying that all liquid is vaporized in the entrainment
                                 zone [16]. Given that the vaporization occurs rapidly, it is assumed that the LNG gas
                                 temperature remains constant. The leak velocity decreases as it propagates away from the
                                 breach. By the conservation of mass, the reduced leak velocity must lead to a proportional
                                 increase in the cross-sectional area. The entrainment zone leak area, A3 , is represented
                                 as follows:
                                                                 ρ2 × V2 × A2 /ρg × V3 = A3                                 (8)
                                      V3 is the reduced velocity when vaporization is completed. There is insufficient
                                 information to determine when vaporization is completed; hence, V3 is arbitrarily set as 14
                                 of V2 , and Equation (8) becomes:

                                                                     4 × ρ2 × A2 /ρg = A3                                   (9)

                                      Equations (1)–(9) form the leak model and the calculated parameters provide an
                                 equivalent leak boundary condition for CFD simulation. By eliminating the expansion and
                                 entrainment zone simulation, which is computationally expensive, the model reduces the
                                 CFD simulation time [20].

                                 3. Results
                                 3.1. Leak Scenario
                                      The simulated scenario was chosen from SPARCLING, a 9 mm-diameter leak with an
                                 8 bar initial stagnation pressure. The LNG composition is based on Australian LNG, which
                                 has a methane concentration of 99.8%. Given the extremely high methane concentration,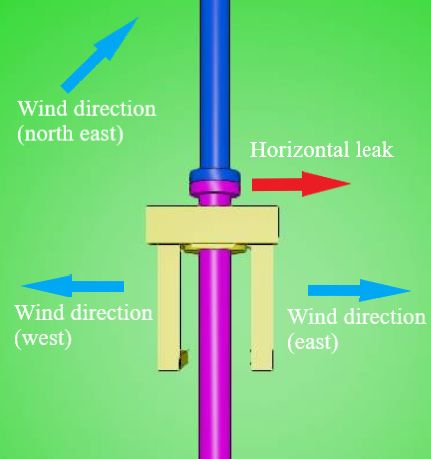
concentration, LNG was considered as pure methane in the simulation. The assumption
of pure methane composition provides a conservative gas dispersion result as heavier al-
Appl. Sci. 2021, 11, 9312
kanes diffuse slower. The leak inventory volume is based on a cryogenic hose of 10 5m, 8
of 11
inch in length [21]. A 5 s delay to cut off the upstream supply from the emergency shut-
down valve was considered, and this increased the total leak volume [22]. The proposed
model used the initial pressurized leak parameter at the breach orifice and mapped out
LNG
the was considered
de-pressurized andasflashed
pure methane in the simulation.
leak parameter The assumption
at the entrainment of pure
zone. Table methane
1 summa-
composition
rizes provides
the initial a conservative
leak parameters gas dispersion
at the breach orificeresult as heavier
and alkanes
entrainment diffuse
zone afterslower.
leak
The leak inventory
model application. volume is based on a cryogenic hose of 10 m, 8 inch in length [21].
A 5 s delay to cut off the upstream supply from the emergency shutdown valve was
considered,
Table and this increased
1. Leak parameter before andthe total
after leakleak
model volume [22]. The proposed model used the
application.
initial pressurized leak parameter at the breach orifice and mapped out the de-pressurized
Jet Region
and flashed Parameter zone. Table 1 summarizes
leak parameter at the entrainment Value the initial leak
A 1 0.0000636
parameters at the breach orifice and entrainment zone after leak model application. m2
V1 35.03 m/s
Breach orifice
Table 1. Leak parameter before and after leakPmodel
1 application. 8.0 bar
ρ1 418.3 kg/m3
Jet Region Parameter Value
A3 0.0239 m2
2
V3 A1 0.0000636
21.70 m/sm
Entrainment zone V1 35.03 m/s
Breach orifice P2 1.0 bar
P1 8.0 bar
ρ3 ρ1 1.797
418.3kg/m
kg/m3
3
3A 0.0239 m2
The breach occurs at the hose joint connection
V3
point with the manifold.
21.70 m/s
From a risk
Entrainment zone
perspective, knowing how far a flammable P leak source can disperse is critical
2 1.0 bar for safety.
According to Singapore risk analysis technical ρ3 guidance, leak direction,1.797wind
kg/m3direction,
and wind speed should be considered when assessing the risk [10].
Three probable leak directions, vertical upward, vertical downward, and horizontal,
The breach occurs at the hose joint connection point with the manifold. From a risk
were considered. The vertical leaks only consider one wind direction, since the two direc-
perspective, knowing how far a flammable leak source can disperse is critical for safety.
tions are perpendicular to each other. For the horizontal leak, three different wind direc-
According to Singapore risk analysis technical guidance, leak direction, wind direction,
tions, east (tailwind), west (headwind), and northeast (crosswind), were considered to
and wind speed should be considered when assessing the risk [10].
coverThree
probable windleak
probable interaction withvertical
directions, the leak. Figurevertical
upward, 2 shows the three leak
downward, directions
and horizontal,
and the three wind directions.
were considered. The vertical leaks only consider one wind direction, since the two
According
directions to Nubli and co-workers,
are perpendicular to each other.a lower
For thewind speed has
horizontal leak,a three
slowerdifferent
dilutionwind
rate
and leads toeast
directions, greater gas dispersion
(tailwind), [23]. The wind
west (headwind), speed was
and northeast set at 1 m/swere
(crosswind), (reference height
considered to
of 10 m), which belongs to roughly 1 percentile of Singapore’s average wind
cover probable wind interaction with the leak. Figure 2 shows the three leak directionsspeed range
and
[24].
the three wind directions.
(a) (b)
Figure
Figure2.2.(a)
(a)Section
Sectionview
viewof
ofthe
themanifold
manifold showing
showing two
two vertical
vertical leaks and wind directions; (b) plane
plane view of the manifold showing the horizontal leak
view of the manifold showing the horizontal leak and windand wind directions.
directions.
According to Nubli and co-workers, a lower wind speed has a slower dilution rate and
leads to greater gas dispersion [23]. The wind speed was set at 1 m/s (reference height of
10 m), which belongs to roughly 1 percentile of Singapore’s average wind speed range [24].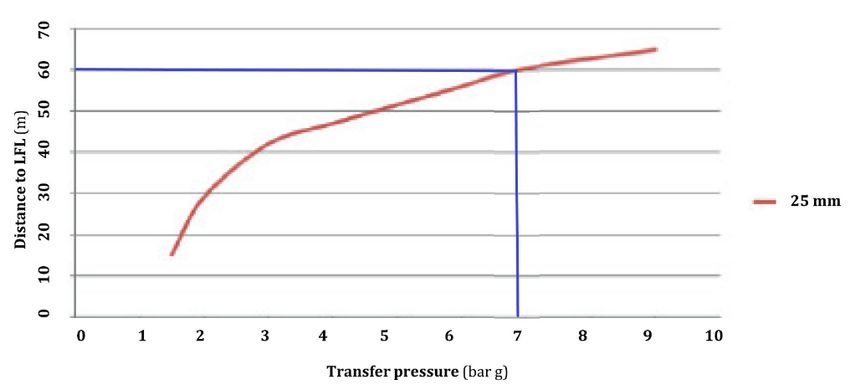
Appl. Sci. 2021, 11, x FOR PEER REVIEW 6 of 1
Appl. Sci. 2021, 11, 9312 6 of 11
3.2. CFD Initial Condition and Output Control
The entrainment zone leak parameter shown in Table 1 served as the leak boundar
condition forCondition
3.2. CFD Initial the gas dispersion simulation. The CFD software utilized was FLACS ve
and Output Control
sionThe
10.7, which has
entrainment been
zone leakvalidated
parameter byshown
numerous
in Table LNG experiment
1 served as the leakdata [25]. In FLAC
boundary
simulation,
condition Favre-averaged
for the gas dispersiontransport
simulation.equations for mass,utilized
The CFD software momentum,
was FLACS enthalpy,
ver- turbu
lent10.7,
sion kinetic
whichenergy,
has beenthevalidated
rate of dissipation
by numerousofLNG turbulent kinetic
experiment dataenergy,
[25]. Inmass-fraction
FLACS o
simulation, Favre-averaged transport equations for mass, momentum,
fuel, and mixture-fraction were solved on a structured Cartesian grid using a finite voenthalpy, turbulent
kinetic energy, the
ume method. Therate of dissipation
standard k-ε model of turbulent kinetic energy,
for turbulence was used mass-fraction
in FLACS of fuel,
simulation. Fo
and mixture-fraction were solved on a structured Cartesian grid using
more information on the governing equations for fluid flow, please refer to the FLACS a finite volume
method. The standard k-ε model for turbulence was used in FLACS simulation. For more
CFD 20.1 User Manual, 2020 [25]. The CFD initial condition was set at an average tempe
information on the governing equations for fluid flow, please refer to the FLACS-CFD 20.1
atureManual,
User of 25 °C and
2020 1 bar
[25]. Theambient
CFD initialpressure.
conditionGround
was setroughness
at an averagewastemperature
set at 0.03 m,of suitabl
for
◦ terrain with few obstacles. The chosen Pasquill class was stable
25 C and 1 bar ambient pressure. Ground roughness was set at 0.03 m, suitable for terrain (F), considering th
low few
with wind speed. The
obstacles. The Courant number
chosen Pasquill (CFLC)
class based(F),
was stable on considering
sound velocity waswind
the low set at 10, an
Courant
speed. Thenumber
Courant(CFLV)
number based
(CFLC)on flowon
based velocity was setwas
sound velocity at 1.set at 10, and Courant
number A (CFLV) based on flow
grid convergence velocity
test was set at 1.at three grid sizes (1 m, 0.5 m, and 0.25 m
was performed
andAthegrid convergence
gas test was
stoichiometric performed at three
concentration volume grid (Q8)
sizes (1
wasm, tracked
0.5 m, and to0.25 m), and
gauge the discret
the gas stoichiometric concentration volume (Q8) was tracked to gauge
zation error. The Q8 difference between consecutive grid sizes was less than 5%, and th the discretization
error. The Q8 difference between consecutive grid sizes was less than 5%, and the 0.25 m
0.25 m grid was chosen for the simulation. The grid around the leak was locally refined a
grid was chosen for the simulation. The grid around the leak was locally refined as per
per FLACS
FLACS best practice
best practice guidelines
guidelines to 0.219tom. 0.219
Them. The neighbouring
neighbouring cells increased
cells increased graduallygraduall
at approximately a 10% rate till it reached 0.25 m. Figure
at approximately a 10% rate till it reached 0.25 m. Figure 3 shows the simulation 3 shows the simulation
grid gri
setup.The
setup. The number
number of controlled
of controlled volumes
volumes forsimulation
for the the simulation
ranges ranges from roughly
from roughly 800,000 800,00
to 1,100,000.
to 1,100,000.
Figure3.3.Grid
Figure Griduseuse
forfor
thethe simulation.
simulation.
3.3. Simulation Finding
3.3. Simulation Finding
Natural gas (NG) is flammable between 5% and 15% methane concentration in the air.
Natural gas (NG) is flammable between 5% and 15% methane concentration in th
The 5% concentration is called the lower flammable limit (LFL), and the 15% concentration
air. The 5%upper
is called the concentration
flammableislimit
called the lower
(UFL). The LFLflammable limit (LFL),
distance covered and
by each the 15% concen
simulated
tration is
scenario is called thein
presented upper
Tableflammable
2. The LFL limit (UFL).
distance is theThe LFL distance
furthest covered
distance from by each sim
the leak
ulatedwhere
source scenario is presented
the methane in Tablehas
concentration 2. The
beenLFL distance
diluted to 5% is
in the
air. furthest distance from th
leakAmong
sourcethe
where the methane
five simulated concentration
scenarios, hasleak
the horizontal been diluted
with tailwindto 5%
hadin
theair.
furthest
LFL distance at 49.83 m, which can be explained by three reasons. The first reason is that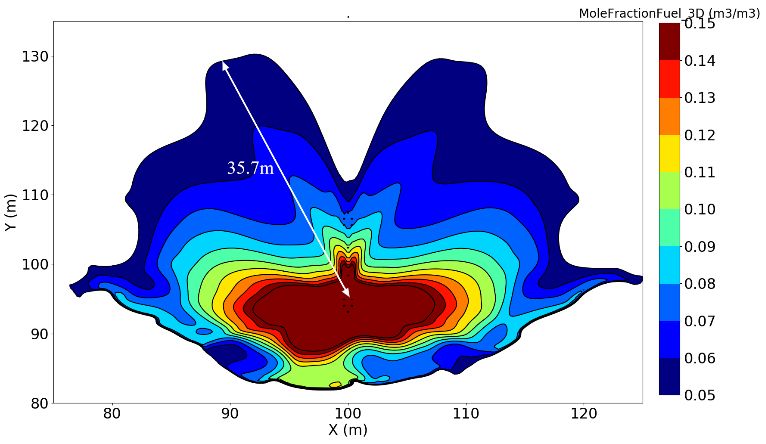
Appl. Sci. 2021, 11, x FOR PEER REVIEW 7 of 11
Appl. Sci. 2021, 11, 9312 7 of 11
Table 2. LFL distance of leaks.
Leak Direction Wind Direction Furthest LFL Distance (m)
it was Vertical
non-impinged,
upwardunlike the vertical downward
North leak. An impinged 16.72
leak has the help
of obstruction to redirect dispersion flow,
Vertical downward leading to a smaller LFL distance.
North 35.70 Figure 4a
shows theHorizontal
plane view of the downward Eastleak overall spread across the ground.
(tailwind) 49.83 Figure 4b
shows theHorizontal
section view of the downward leak at
West (headwind) the leak source. The colour
32.53 depicts the
methane concentration
Horizontal at the location. Deep red represents
North-east (crosswind) methane concentration
47.04 at UFL
or higher, and deep blue represents the methane concentration at LFL. Concentrations of
lower than LFL are not shown in the figure. The gas height measured 0.65 m from the
Among the five simulated scenarios, the horizontal leak with tailwind had the fur-
ground, reflecting a low laying gas dispersion, which is a phenomenon observed in past
thest LFL distance at 49.83 m, which can be explained by three reasons. The first reason is
LNG experiments [26–28].
that it was non-impinged, unlike the vertical downward leak. An impinged leak has the
help of obstruction to redirect dispersion flow, leading to a smaller LFL distance. Figure
Table 2. LFL distance of leaks.
4a shows the plane view of the downward leak overall spread across the ground. Figure
4b shows the Direction
Leak section view of the downward leak at the leak source.
Wind Direction TheLFL
Furthest colour depicts
Distance (m)the
methaneVertical
concentration
upward
at the location. Deep red
North
represents methane concentration
16.72
at UFL
or higher, and deep
Vertical downwardblue represents the methane
North concentration at LFL. Concentrations
35.70 of
lower thanHorizontal
LFL are not shown in theEast figure. The gas height measured49.83
(tailwind) 0.65 m from the
ground, reflecting
Horizontala low laying gas dispersion, which is a phenomenon 32.53
West (headwind) observed in past
Horizontal
LNG experiments [26–28]. North-east (crosswind) 47.04
(a) (b)
view of
Figure 4. (a) Plane view of the
the downward
downwardleak
leakspreading
spreadingacross
acrossthe
theground
groundwith
with LFL
LFL distance
distance of of 35.7
35.7 m;m;
(b)(b) section
section view
view of
of the downward leak at the leak source with a height of
the downward leak at the leak source with a height of 0.65 m.0.65 m.
The second
The second reason
reason is
is that
that horizontal
horizontal leak
leak experienced
experienced lower
lower wind
wind speed
speed as
as compared
compared
to vertical upward leak. The FLACS wind boundary was modelled based on the Monin
to vertical upward leak. The FLACS wind boundary was modelled based on the Monin
and Obukhov
and Obukhov theory,
theory, and
and the
the wind
wind velocity
velocity increased
increased logarithmically
logarithmically with
with elevation
elevation [29].
[29].
Figure 5a shows the section view of wind velocity (north direction) distribution. It can be
Figure 5a shows the section view of wind velocity (north direction) distribution. It can be
observed that
observed that the
the wind
wind speed
speed above
above 10
10 m
m elevation
elevation is
is approximately
approximately22m/s, 10 times
m/s, 10 times more
more
than the wind speed of 0.2 m/s found below 2 m elevation. For the horizontal leak, the
than the wind speed of 0.2 m/s found below 2 m elevation. For the horizontal leak, the gas
gas dispersion barely surpassed 1 m elevation. In the case of the vertical upward leak, the
dispersion barely surpassed 1 m elevation. In the case of the vertical upward leak, the leak
leak reached up to a height of 11 m with an LFL distance of 16.72 m, as shown in Figure 5b.
reached up to a height of 11 m with an LFL distance of 16.72 m, as shown in Figure 5b.
The higher wind speed experienced by the vertical upward leak led to faster gas dilution,
The higher wind speed experienced by the vertical upward leak led to faster gas dilution,
resulting in a shorter LFL distance.
resulting in a shorter LFL distance.
The third reason is that a tailwind leak will not suffer “push back” as a headwind
would. The opposing headwind reduced the leak velocity, leading to a smaller LFL distance.
Figure 6a,b show the section view of tailwind and headwind leak, respectively. The LFL
distance was 49.83 m for the tailwind leak and 32.53 m for the headwind.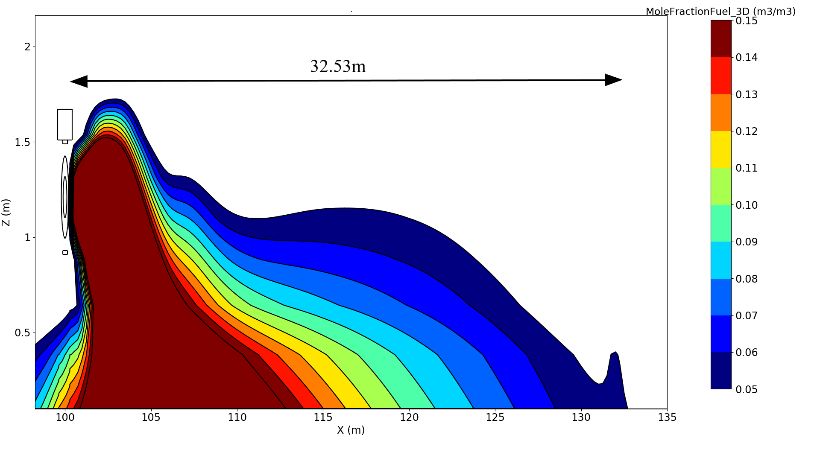
Appl. Sci.
Appl. Sci. 2021,
2021, 11,
11, 9312
x FOR PEER REVIEW 8 8of
of 11
11
(a) (b)
Figure 5. (a) Section view of wind speed distribution in the vertical upward leak; (b) section view of the vertical upward
leak showing LFL distance of 16.72 m.
The third reason is that a tailwind leak will not suffer “push back” as a headwind
(a) (b)
would. The opposing headwind reduced the leak velocity, leading to a smaller LFL dis-
tance.speed
Figure 5. (a) Section view of wind Figure 6a,b show
distribution inthe
the section
vertical view of leak;
upward tailwind and headwind
(b) section view of theleak, respectively.
vertical upward The
leak showing
leak showing LFL
LFL distance
distance of
ofLFL
16.72distance
16.72 m.
m. was 49.83 m for the tailwind leak and 32.53 m for the headwind.
The third reason is that a tailwind leak will not suffer “push back” as a headwind
would. The opposing headwind reduced the leak velocity, leading to a smaller LFL dis-
tance. Figure 6a,b show the section view of tailwind and headwind leak, respectively. The
LFL distance was 49.83 m for the tailwind leak and 32.53 m for the headwind.
(a) (b)
Figure6.6.(a)(a)Section
Figure Sectionview
viewofofthe
thetailwind
tailwindleak
leakshowing
showingLFL
LFLdistance
distanceofof49.83
49.83m;m;(b)
(b)section
sectionview
viewofofthe
theheadwind
headwindleak
leak
showingLFL
showing LFLdistance
distance
ofof 32.53
32.53 m.m.
TheLFL
The LFLdistance
distancedifference
differencebetween
betweenthe thehorizontal
horizontalleakleakwith
withtailwind
tailwindand
andcrosswind
crosswind
(a) (b)
was2.79
was 2.79m.m.The
The slight
slight difference
difference is likely
is likely duedue to the
to the manifold
manifold andand
hosehose geometry
geometry influ-
influenc-
ing
Figure 6. (a) Section view of thethe
encing wind
tailwind flowshowing
the wind
leak around
flow the leak
around
LFL the source. Overall,
leakofsource.
distance 49.83 (b)the
m;Overall, five LFL
five distances
theview
section LFL
of differences
thedistances
headwind leak are
differences
showing LFL distance of 32.53 m.explained,
explained,
are and the
andresults do not
the results docontradict each other.
not contradict each other.
3.4.
3.4.Comparison
The with
withEstablished
LFL distance
Comparison differenceLNG
Established Safety
between
LNG Guideline
the
Safety horizontal leak with tailwind and crosswind
Guideline
was 2.79 m.
ToTogauge The slight difference is likely due to the manifold and hose geometrythe influ-
gaugethetheadequacy
adequacyofofthe theproposed
proposedleak leakmodel
modeltotouse
usefor
forrisk
riskassessment,
assessment, thegas gas
encing
dispersionthe wind flow around thewith leak source. Overall, thetechnical
five LFL distances differences
dispersionresult
resultwas
wascompared
compared withthe theLNG
LNGbunkering
bunkering technicalreference,
reference,TR56.
TR56.This
This
are explained, and the
technical results do not contradict each other.
technicalreference
referencewas wasproduced
producedby byEnterprise
EnterpriseSingapore
Singaporeandandrecognized
recognizedbybySingapore
Singapore
maritime
maritime authorities [30]. TR56 provides an LFL distance vs. stagnationpressure
authorities [30]. TR56 provides an LFL distance vs. stagnation pressuregraph,
graph,
3.4.
shownComparison with Established LNG Safety Guideline NG can disperse. The graph is based
shownininFigure
Figure7,7,totoadvise
advisehow howfar farflammable
flammableleak leak NG can disperse. The graph is based
onona aTo
continuous
gauge therelease
continuous releasethrough
adequacy of theaproposed
through a2525mm-diameter
leak model
mm-diameter hole. NoNofurther
to use
hole. for information
risk assessment,
further information on
the the
ongas
the
surrounding
surrounding geometry and wind condition was provided. Therefore, it is assumedthe
dispersion geometry
result was and
compared wind condition
with the LNG was provided.
bunkering Therefore,
technical it is
reference, assumed
TR56. This
the
TR56 wind condition and geometrybyare
technical
TR56 wind reference was
condition produced
and areidentical
geometry Enterpriseidentical to those in and
to those inSection
Singapore 3.1 leak by
3.1 leakscenario.
recognized
Section Singapore
scenario.
maritime For authorities
an 8 bar 25 [30].
mm leak,TR56the provides
worst LFL an LFL distance
distance was vs. stagnation
60 m, roughly 10 pressure
m furthergraph,
than
shown in Figuremodel
the proposed 7, to advise
result. how far flammable
The LFL distance for leak NG
a 25 mmcan disperse.
hole The graph
was expected is based
to be further
onthan
a continuous
a 9 mm hole release
since through
the leak a 25 mm-diameter
area hole. No further
is bigger. However, information
considering that theoncross-
the
surrounding geometry and wind condition was provided. Therefore, it is assumed the
TR56 wind condition and geometry are identical to those in Section 3.1 leak scenario.
For an 8 bar 25 mm leak, the worst LFL distance was 60 m, roughly 10 m further than
the proposed model result. The LFL distance for a 25 mm hole was expected to be further
than a 9 mm hole since the leak area is bigger. However, considering that the cross-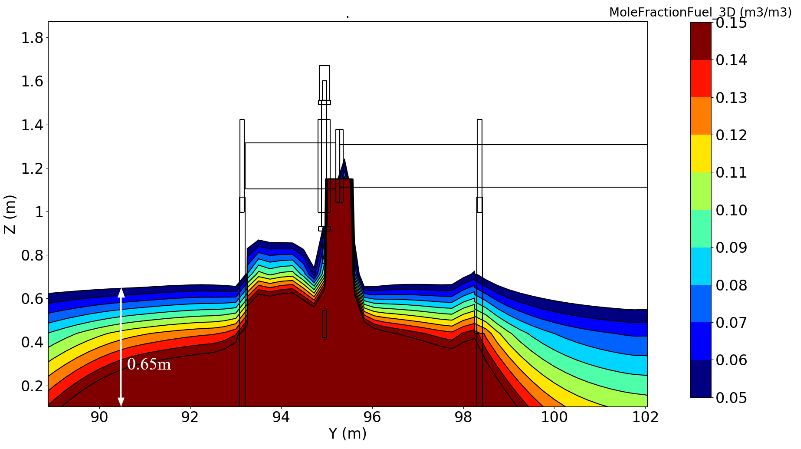
not vaporize immediately and form a rainout. This means that not all the leak LNG con-
tributed to the immediate gas dispersion. In the case of the 9 mm leak, the SPARCLING
experiment showed that no rainout was formed for this leak size. Therefore, the NG dis-
persion rate of the 25 mm hole will be greater than that of the 9 mm hole but not neces-
Appl. Sci. 2021, 11, 9312 9 of 11
sarily proportional to their cross-sectional area difference. At first glance, the proposed
leak model prediction is probable.
7. Distance
Figure 7.
Figure Distanceto
toLFL
LFLasasaafunction
functionofof
stagnation pressure
stagnation for for
pressure 25 mm-diameter holehole
25 mm-diameter leak.leak.
For an 8 bar 25 mm leak, the worst LFL distance was 60 m, roughly 10 m further than
4. Discussion and Conclusions
the proposed model result. The LFL distance for a 25 mm hole was expected to be further
than The
a 9 mmexisting modelling
hole since the leakwork
area isperformed for flashing
bigger. However, leak isthat
considering forthe
non-cryogenic
cross-sectionalpres-
surized sources, such as propane and butane. These models are not
area of the 25 mm hole was approximately 7.7 times that of a 9 mm hole, the difference compatible with cry-
ogenic
of 10 mliquids, such as
LFL distance LNG.
seems to This
havepaper is an attempt to One
been underestimated. produce a source
explanation forterm model for
the minor
cryogenic
LFL distanceflashing leakcould
difference that will be useful
be that for of
a portion risk
theassessment,
25 mm leaked such
LNG as LNG gasvaporize
did not dispersion.
One potentialand
immediately useform
of the leak model
a rainout. Thisis means
providing
that an
notequivalent
all the leakleakLNG boundary
contributedcondition
to
the immediate gas dispersion. In the case of the 9 mm leak, the SPARCLING
for CFD simulation and helping to reduce computational time. The leak model formula- experiment
showed
tion that noonrainout
is based was formed
the recent for this leak size.
LNG experiment Therefore,findings
SPARCLING the NG dispersion rate of
and the Isenthalpic
the 25 mm hole Equilibrium
Homogeneous will be greaterModel
than that of theA9comparison
(HEM). mm hole butof not
thenecessarily proportional
LNG bunkering technical
to their cross-sectional area difference. At first glance, the proposed leak
reference, TR56, with the FLACS simulation using the leak model did not show contra- model prediction
is probable.
dicting results.
To furtherand
4. Discussion verify the leak model fidelity, a comparison can be made with commercial
Conclusions
software, such as Process Hazard Analysis Software (PHAST) [31]. However, commercial
The existing modelling work performed for flashing leak is for non-cryogenic pressur-
software uses an integral model, which is unable to analyse impinged leaks. Considering
ized sources, such as propane and butane. These models are not compatible with cryogenic
the rise in
liquids, LNG
such usageThis
as LNG. in the marine
paper is anindustry,
attempt toreserving
produce 60 m (refer
a source termtomodel
Figurefor7) cryo-
for LNG
bunkering
genic flashing leak that will be useful for risk assessment, such as LNG gas dispersion. LFL
will be a challenge for port facilities. The quickest way to reduce the One dis-
tance
potential use of the leak model is providing an equivalent leak boundary condition for CFDwith
would be to use a barrier to redirect LNG dispersion. CFD software coupled
the leak model
simulation could potentially
and helping be used to evaluate
to reduce computational time. Thethe
leakbarrier effectiveness
model formulation to reduce
is based
gas dispersion.
on the recent LNG Hence, it would
experiment be worthwhile
SPARCLING to and
findings conduct an LNG leak
the Isenthalpic experiment to
Homogeneous
validate
Equilibrium the Model
leak model
(HEM). and CFD software.
A comparison Additionally,
of the LNG bunkering the technical
experiment can confirm
reference, TR56, the
with the FLACS simulation using the leak model did not show contradicting
model assumption of when vaporization is completed. Finally, the experiment should ex- results.
ploreTo further
leak verify
orifices the leak model
of between 10 mmfidelity,
and 25amm,comparison
which iscan be made
currently with commercial
lacking in the modern
software, such as Process Hazard Analysis Software (PHAST) [31]. However, commercial
literature.
software uses an integral model, which is unable to analyse impinged leaks. Considering
the riseContributions:
Author in LNG usageConceptualization,
in the marine industry,
B.H.L. reserving 60 m
and E.Y.K.N.; (refer to Figure
methodology, 7) for
B.H.L.; LNG
investigation,
bunkering will be a challenge for port facilities. The quickest way to reduce the
B.H.L.; writing—original draft preparation, B.H.L.; visualization, B.H.L.; supervision, E.Y.K.N.;LFL
distance would be to use a barrier to redirect LNG dispersion. CFD software coupled
writing—review and editing, E.Y.K.N.; funding acquisition, B.H.L. and E.Y.K.N. All authors have with
the leak
read and model
agreedcould
to the potentially be usedoftothe
published version evaluate the barrier effectiveness to reduce gas
manuscript.
dispersion. Hence, it would be worthwhile to conduct an LNG leak experiment to validate
Funding: This work was supported by the Industrial Postgraduate Programme (IPP) initiated by
the leak model and CFD software. Additionally, the experiment can confirm the model
the Singapore Economic Development Board (EDB).
assumption of when vaporization is completed. Finally, the experiment should explore leak
orifices of between 10 mm and 25 mm, which is currently lacking in the modern literature.
Author Contributions: Conceptualization, B.H.L. and E.Y.K.N.; methodology, B.H.L.; investigation,
B.H.L.; writing—original draft preparation, B.H.L.; visualization, B.H.L.; supervision, E.Y.K.N.;
writing—review and editing, E.Y.K.N.; funding acquisition, B.H.L. and E.Y.K.N. All authors have
read and agreed to the published version of the manuscript.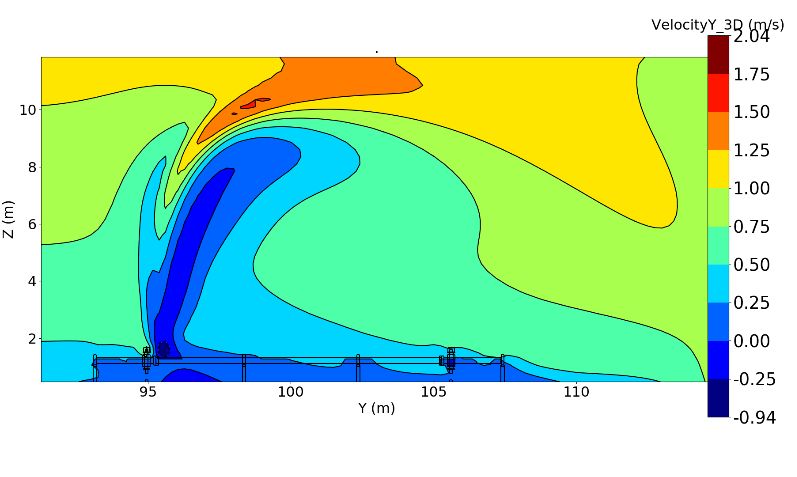
Appl. Sci. 2021, 11, 9312                                                                                                           10 of 11

                                   Funding: This work was supported by the Industrial Postgraduate Programme (IPP) initiated by the
                                   Singapore Economic Development Board (EDB).
                                   Data Availability Statement: The data presented in this study are available on request from the
                                   corresponding author. The data are not publicly available due to academic license agreement.
                                   Conflicts of Interest: The authors declare no conflict of interest.

References
1.    DNV GL. Energy Transition Outlook 2019. A Global and Regional Forecast to 2050; Irvine, M., Ed.; DNV GL: Hovik, Norway, 2019.
2.    IMO 2020—Cutting Sulphur Oxide Emissions. Available online: http://www.imo.org/en/MediaCentre/HotTopics/Pages/
      Sulphur-2020.aspx (accessed on 14 April 2021).
3.    Thomson, H.; Corbett, J.J.; Winebrake, J.J. Natural gas as a marine fuel. Energy Policy 2015, 87, 153–167. [CrossRef]
4.    Gas Tanker Explosion in China Kills 19. Available online: https://edition.cnn.com/2020/06/14/asia/china-gas-tanker-explosion-
      intl-hnk/index.html (accessed on 14 April 2021).
5.    Webber, D.M.; Gant, S.E.; Ivings, M.J.; Jagger, S.F. LNG Source Term Models for Hazard Analysis RR789; Health and Safety Laboratory:
      Derbyshire, UK, 2010.
6.    Siuta, D.; Markowski, A.S.; Mannan, M.S. Uncertainty techniques in Liquefied Natural Gas (LNG) dispersion calculations. J. Loss
      Prev. Process Ind. 2013, 26, 418–426. [CrossRef]
7.    Ikealumba, W.C.; Wu, H. Some recent advances in Liquefied Natural Gas (LNG) production, spill, dispersion, and safety. Energy
      Fuels 2014, 28, 3556–3586. [CrossRef]
8.    ISO. ISO 20519:2017: Ships and Marine Technology—Specification for Bunkering of Liquefied Natural Gas Fuelled Vessels; BSI Standards;
      ISO: Liverpool, UK; Geneva, Switzerland, 2017; ISBN 978-0-580-89936-2.
9.    HSE. Failure Rate and Event Data for use within Risk Assessments (06/11/17); Health Safety Executive: Bootle, UK, 2017; Volume 1,
      pp. 1–102.
10.   NEA. QRA Technical Guidance Revision 3; National Environment Agency: Singapore, 2016; pp. 1–39.
11.   Witlox, H.W.M.; Harper, M.; Oke, A.; Bowen, P.J.; Kay, P. Sub-cooled and flashing liquid jets and droplet dispersion I. Overview
      and model implementation/validation. J. Loss Prev. Process Ind 2010, 23, 831–842. [CrossRef]
12.   Cleary, V.; Bowen, P.; Witlox, H. Flashing liquid jets and two-phase droplet dispersion. I. Experiments for derivation of droplet
      atomisation correlations. J. Hazard Mater. 2007, 142, 786–796. [CrossRef] [PubMed]
13.   Lautkaski, R. Experimental correlations for the estimation of the rainout of flashing liquid releases—Revisited. J. Loss Prev. Process
      Ind. 2008, 21, 506–511. [CrossRef]
14.   Hervieu, E.; Veneau, T. Experimental determination of the droplet size and velocity distributions at the exit of the bottom
      discharge pipe of a liquefied propane storage tank during a sudden blowdown. J. Loss Prev. Process Ind. 1996, 9, 413–425.
      [CrossRef]
15.   Bonnet, P.; Lacome, J.M. Experimental study of accidental industrial LPG releases: Rain out investigation. In Proceedings of the
      40th Annual Loss Prevention Symposium, Orlando, FL, USA, 23–27 April 2006; pp. 395–404.
16.   Joubert, L.; Leroy, G.; Betteridge, S.; Vyazmina, E.; Bernard, L. Presentation of the experimental JIP SPARCLING: Inside and
      beyond a pressurised LNG release. In Proceedings of the 13th International Symposium on Hazards, Prevention, and Mitigation
      of Industrial Explosions (ISHPMIE), Physikalisch-Technische Bundesanstalt, Braunschweig, Germany, 27 July–31 August 2020;
      pp. 2–11.
17.   Calay, R.K.; Holdo, A.E. Modelling the dispersion of flashing jets using CFD. J. Hazard. Mater. 2008, 154, 1198–1209. [CrossRef]
      [PubMed]
18.   Lemofack, C.; Lacome, J.M.; Reveillon, J.; Demoulin, F.X. Numerical modelling of liquid jets atomisation due to leakage of
      liquefied gas storage. In Proceedings of the ICLASS 2012—12th International Conference on Liquid Atomization and Spray
      Systems, Heidelberg, Germany, 2–6 September 2012; pp. 1–12.
19.   Fauske, H.K.; Epstein, M. Source term considerations in connection with chemical accidents and vapour cloud modelling. J. Loss
      Prev. Process Ind. 1988, 1, 75–83. [CrossRef]
20.   Franquet, E.; Perrier, V.; Gibout, S.; Bruel, P. Free underexpanded jets in a quiescent medium: A review. Prog. Aerosp. Sci. 2015, 77,
      25–53. [CrossRef]
21.   Multi-LNG White STS Composite Hoses Datasheet. Available online: https://www.gutteling.com/uploads/Gutteling/Hoses/
      Datasheets/Gutteling_Datasheet_2016_Hoses_Multi-LNG_White_STS.pdf (accessed on 14 April 2021).
22.   NI 618 Guidelines on LNG Bunkering; Bureau Veritas. Available online: https://erules.veristar.com/dy/data/bv/pdf/618-NI_
      2014-07.pdf (accessed on 1 March 2021).
23.   Nubli, H.; Sohn, J.M. CFD-based simulation of accidental fuel release from LNG-fuelled ships. Ships Offshore Struct. 2020, 1–20.
      [CrossRef]
24.   Climate of Singapore. Available online: http://www.weather.gov.sg/climate-climate-of-singapore/ (accessed on 14 April 2021).
25.   FLACS-CFD 20.1 User’s Manual; Gexcon AS. 2020. Available online: https://www3.gexcon.com/files/manual/flacs/html/
      index.html (accessed on 25 April 2020).
Appl. Sci. 2021, 11, 9312 11 of 11
26. Koopman, R.P.; Cederwall, R.T.; Ermak, D.L.; Goldwire, H.C.; Hogan, W.J.; McClure, J.W.; McRae, T.G.; Morgan, D.L.; Rodean,
H.C.; Shinn, J.H. Analysis of Burro series 40-m3 lng spill experiments. J. Hazard. Mater. 1982, 6, 43–83. [CrossRef]
27. Havens, J.; Spicer, T. LNG vapor cloud exclusion zones for spills into impoundments. Process Saf. Prog. 2005, 24, 181–186.
[CrossRef]
28. Sklavounos, S.; Rigas, F. Simulation of Coyote series trials—Part I: CFD estimation of non-isothermal LNG releases and comparison
with box-model predictions. Chem. Eng. Sci. 2006, 61, 1434–1443. [CrossRef]
29. Monin, A.S.; Obukhov, A.M. Basic laws of turbulent mixing in the surface layer of the atmosphere. Contrib. Geophys. Inst. Acad.
Sci. USSR 1959, 24, 163–187.
30. Singapore Standard Council. TR 56-3: 2020. LNG Bunkering—Part 3: Procedures and Safety Distances; Singapore Standard Council:
Singapore, 2020; ISBN 978-981-48-9487-6.
31. Process Hazard Analysis Software—PHAST. Available online: https://www.dnv.com/software/services/phast/index.html
(accessed on 29 July 2021).You can also read