Flow Prediction Using Remotely Sensed Soil Moisture in Irish Catchments - MDPI
←
→
Page content transcription
If your browser does not render page correctly, please read the page content below
water
Article
Flow Prediction Using Remotely Sensed Soil
Moisture in Irish Catchments
Chanyu Yang 1,2 and Fiachra E. O’Loughlin 3,4, *
 1   Key Laboratory of the Three Gorges Reservoir Region’s Eco-Environment, Ministry of Education, College of
     Environment and Ecology, Chongqing University, Chongqing 400045, China; chanyu.yang@ucdconnect.ie
 2   School of Civil Engineering, University College Dublin, Dublin, Ireland
 3   UCD Dooge Centre for Water Resources Research, School of Civil Engineering, University College Dublin,
     Dublin, Ireland
 4   UCD Earth Institute, University College Dublin, Dublin, Ireland
 *   Correspondence: fiachra.oloughlin@ucd.ie

 Received: 28 April 2020; Accepted: 29 July 2020; Published: 5 August 2020

 Abstract: Owing to a scarcity of in situ streamflow data in ungauged or poorly gauged basins, remote
 sensing data is an ideal alternative. It offers a valuable perspective into the dynamic patterns that
 can be difficult to examine in detail with point measurements. For hydrology, soil moisture is one
 of the pivotal variables which dominates the partitioning of the water and energy budgets. In this
 study, nine Irish catchments were used to demonstrate the feasibility of using remotely sensed soil
 moisture for discharge prediction in ungagged basins. Using the conceptual hydrological model “Soil
 Moisture Accounting and Routing for Transport” (SMART), behavioural parameter sets (BPS) were
 selected using two different objective functions: the Nash Sutcliffe Efficiency (NSE) and Coefficient of
 Determination (R2 ) for the calibration period. Good NSE scores were obtained from hydrographs
 produced using the satellite soil moisture BPS. While the mean performance shows the feasibility of
 using remotely sensed soil moisture, some outliers result in negative NSE scores. This highlights
 that care needs to be taken with parameterization of hydrological models using remotely sensed soil
 moisture for ungauged basin.

 Keywords: soil moisture; satellite remote sensing; hydrological modelling; ungauged basins

1. Introduction
      The conventional ways of monitoring the earth’s hydrological circle depends upon in situ spot
measurements. While such measurements absolutely provide information about discrete points within a
catchment, they may be inadequate for answering specific spatial-scale research questions. In spite of the
saying, “Observation is the foundation of all learning”, observation of nearly all the process components
of hydrology is not easy resulting from explicit routine measurements of evaporation, infiltration and
subsurface flow and even rainfall, which are difficult to collect in some circumstances. Elevation of
water level in the water bodies and through the inference flow in the water bodies is the one quantity
that can be measured confidently and which additionally has the merit to be an integrated measurement
with respect of the catchment scale. This is probably the reason that human civilizations have relied so
greatly on river gauging to recognize, understand and quantify the response of the landscape to rainfall
inputs [1]. However, globally, there are an interesting number of catchments with little or no discharge
measurements and the number of gauging stations is continuing to decline [2,3]. To help address this
lack of information, the International Association of Hydrological Science undertook and completed its
science decade on “Predication in Ungauged Basins” (PUB) in 2013 [1]. PUB aimed to answer how to
undertake hydrological modelling with consideration of the following: (1) the same location but under

Water 2020, 12, 2202; doi:10.3390/w12082202                                       www.mdpi.com/journal/water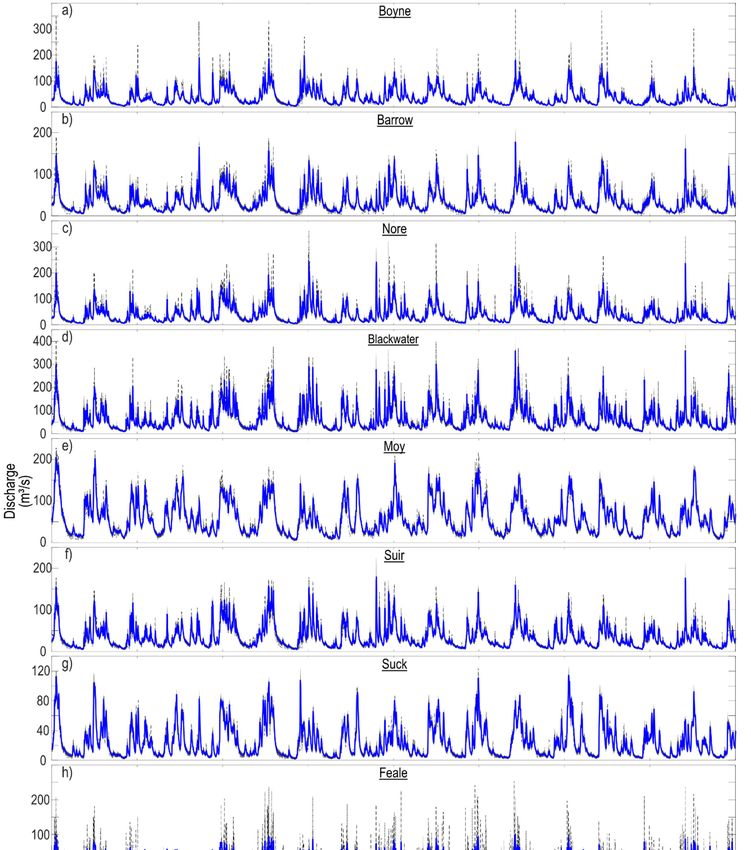
Water 2020, 12, 2202                                                                                     2 of 15

changed circumstances (land use/land cover, observed climate and future climate projection); (2) a
different location (gauged/ungauged basins); and (3) different spatial/temporal circumstances (gauged
or ungauged catchment under changed conditions).
      Ungauged basins usually refer to catchments with a lack of meteorological data (e.g., precipitation
and evaporation) and/or hydrological data (i.e., discharge or water level). The lack of either dataset
makes calibration of hydrological models impossible or extremely difficult. From here on, ungauged
basins/catchments will refer to basins without hydrological data. Remote sensing offers a potential
solution to prediction in ungauged basins. Satellite altimetry can measure changes in water levels
depending on the size of the water bodies [4,5].
      Satellite altimetry is fairly well trusted for use in the calibration of hydrological models as their
outputs are similar to traditional in situ measurements; however, currently, only the largest rivers and
waterbodies are captured. To capture smaller basins, additional alternatives need to be examined.
One method is to examine the fluxes occurring inside the catchment and to try to replicate these.
One such flux is the change in soil moisture. Soil moisture is a critical variable of the hydrological cycle,
which dominates the partitioning of the mass budget and energy flows between the terrain, ocean and
the atmosphere; thus, it is of great importance in the assessment of the different components of the
water and energy balance [6]. In situ soil moisture has been employed for improving the estimation
of initial conditions in flood modelling [7,8], the calibration of hydrological models [9,10] and the
simulation of inundation through data assimilation approaches [11–13].
      Soil moisture has been successfully retrieved from both microwave and optical/thermal infrared
sensors [14–16]. In fact, global soil moisture products from microwave observations have been developed [17,18],
such as the Advanced Microwave Scanning Radiometer-EOS (AMSR-E) [19], the advanced Scatterometer
(ASCAT) [20], the Soil Moisture and Ocean Salinity (SMOS) [21], the Soil Moisture Active Passive (SMAP) [22]
and the European Space Agency’s Climate Change Initiative (ESA CCI) soil moisture products [23–25].
Several studies have validated different remotely sensed products with in situ measurements to
quantify the accuracy of these soil moisture products [25–29]. Remotely sensed soil moisture has also
a significant possibility for enhancing river flow predictions in ungauged basins or rarely gauged
basins, as demonstrated by [30] with ERS Scatterometer data, and has been shown to improve and
support hydrological and climatic predictions [31,32]. Remotely sensed soil moisture products have
been used to calibrate hydrological models, from simple water resources accounting models [33] to
complex distributed hydrologic models [34,35] and semi-distributed hydrologic models [36,37] in
between. Several studies showed that improvement on streamflow simulations were achieved by
calibrating hydrologic models against remotely sensed soil moisture data compared with uncalibrated
models, though they also showed less improvement than models calibrated against streamflow
measurements [33,37].
      Three major limitations of satellite soil moisture products were noted by [6]: (1) the sensed soil
layer from the satellites is relatively shallow (2–7 cm deep); (2) the currently available products are
characterized by the coarse spatial resolution (approximately 25 km); and (3) the quality in regard to
certain surface conditions (dense vegetation, frozen soils, snow and mountainous terrain) is relatively
low. For these reasons, a number of approaches were developed to deal with them [38] including
spatial downscaling techniques [39–41] and simplified methods for root-zone soil moisture estimation
from surface measurements [42,43].
      In this study, we present the results from using remotely sensed soil moisture for prediction of
discharge in Irish catchments. Discharge predictions derived from remotely sensed soil moisture will be
compared to those derived from calibration using in situ discharge. The main objectives of this paper are
to (1) investigate the potential of using remotely sensed soil moisture for ungauged basins in Ireland and
(2) to investigate the change in accuracy between remotely sensed and in situ derived predictions.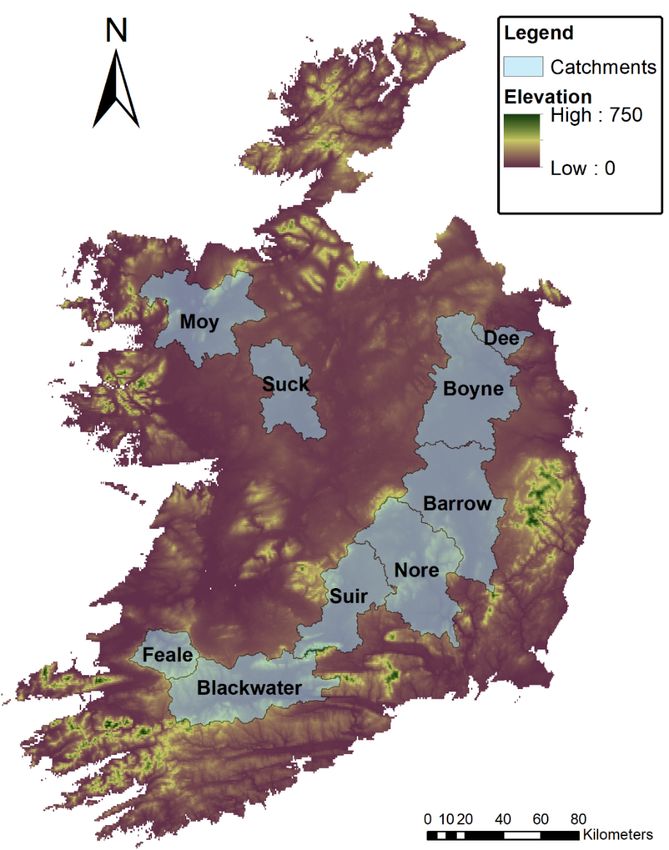
Water 2020, 12, 2202                                                                                         3 of 15

Water 2020, 12, x FOR PEER REVIEW                                                                                  3 of 16
   2. Data and Methodology
       A novel model—the soil moisture accounting and routing for transport model—was developed
   2.1. SMART Model
and informed with the regards to existing model structures, especially the pathway separation of
          A novel model—the soil
NAM (NedborAfstromnings                moisture
                                     Model)   [44]accounting
                                                    and the soil and routing
                                                                   layers     for transport
                                                                           of the  SMARG model—was
                                                                                             (model [45,46].developed
    andThe SMART model is a lumped model forced with precipitation and ofpotential
         informed   with  the regards  to  existing  model   structures, especially  the pathway   separation    NAM
   (NedborAfstromnings        Model)   [44]  and   the soil layers of the SMARG      (model  [45,46].
evapotranspiration, and the soil components are represented by six layers of equal depth with the
          The SMART model
total depth/capacity      of theissix
                                   a lumped
                                      layers model
                                               equal toforced
                                                          Z. Ifwith
                                                                 the precipitation
                                                                     soil moistureand    potential
                                                                                      capacity   ofevapotranspiration,
                                                                                                    a layer is exceeded,
    and the soil components are represented by six layers of equal depth with the total depth/capacity of the
excess moves to a deeper layer if feasible or is intercepted by one of the flow pathways other than
    six layers equal to Z. If the soil moisture capacity of a layer is exceeded, excess moves to a deeper layer
overland flow [46]. Five different flow pathways are simulated in the model: (1) overland flow
    if feasible or is intercepted by one of the flow pathways other than overland flow [46]. Five different
(depending on the direct runoff parameter (H) and the relative soil moisture content), (2) drain flow,
    flow pathways are simulated in the model: (1) overland flow (depending on the direct runoff parameter
(3) interflow (depending on soil moisture excess and outflow from the soil layer), (4) shallow
   (H) and the relative soil moisture content), (2) drain flow, (3) interflow (depending on soil moisture
groundwater      and (5)from
    excess and outflow      deep thegroundwater.       These five
                                     soil layer), (4) shallow        pathways
                                                                groundwater   andare    routed
                                                                                    (5) deep     initially through
                                                                                             groundwater.            four
                                                                                                             These five
routing    components       and    finally   a   river   routing    parameter     (Figure    1).  All
   pathways are routed initially through four routing components and finally a river routing parameter  parameters    and
recommended
   (Figure 1). All ranges   are found
                     parameters         in Table 1. ranges are found in Table 1.
                                   and recommended

         Figure 1. Schematic representation of the Soil Moisture Accounting and Routing for Transport (SMART)
         model [45].
     Figure 1. Schematic representation of the Soil Moisture Accounting and Routing for Transport
                      1. SMART model parameters, descriptions, units and recommended ranges.
                Table[45].
     (SMART) model

                          Parameter                   Description                       Range
                              T          Areal Rainfall Correction coefficient (/)      0.9–1.1
                              C             Evaporation decay parameter (/)               0–1
                             H                 Quick runoff coefficient (/)              0–0.3
                              S                  Drain flow parameter (/)                 0–1
                             D                  Soil outflow coefficient (/)           0–0.013
                              Z                 Effective soil depth (mm)              15–150
                             SK            Surface routing parameter (hours)            1–240
                             FK           Interflow routing parameter (hours)          48–1440
                             GK         Groundwater routing parameter (hours)         1200–4800
                             RK             River routing parameter (hours)              1–96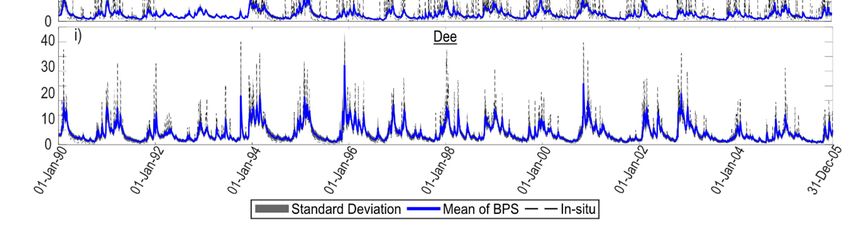
Water 2020, 12, 2202                                                                                           4 of 15

2.2. Study Catchments
     Nine Catchments in Ireland were selected with the aim of representing the various geography,
topography and meteorology conditions. Name, gauged area and location of these catchments are
presented in Figure 2 and Table 2. The gauging locations chosen are the furthest downstream gauges,
where discharge measurements are available for the period of this study. These study catchments
were also used in previous studies looking at hydrological modelling in Ireland either in full [45] or a
subset [46,47].

       Table 2. Study catchments including catchment size, nearest synoptic station and discharge gauge.

                                                                            Discharge Gauge   Discharge Gauge
   Catchment Name       Gauged Area (km2 )       Synoptic Station Name
                                                                                Number             Name
         Barrow                2433                     Casement                 14,018          Royal Oak
       Blackwater              2315                   Cork Airport               18,002          Ballyduff
         Boyne                 2467                  Dublin Airport               7012          Slane Castle
          Dee                   305                  Dublin Airport               6013          Charleville
          Feale                 648               Valentia Observatory           23,002           Listowel
                                                                                              Rahans (Goswami
          Moy                  1908                     Belmullet                34,001
                                                                                               and O’Connor)
          Nore                 2380                     Casement                 15,006         Brownsbarn
          Suck                 1215                 Shannon Airport              26,007           Bellagill
    Water Suir
          2020, 12, x FOR PEER REVIEW
                                 1565               Shannon Airport              16,009                  5 of 16
                                                                                                 Cahir Park

                                        Figure2.2.Study
                                      Figure       Studycatchments  with elevation.
                                                         catchments with elevation.

    2.3. Meteorological Data
         To run the SMART model, both rainfall and potential evapotranspiration (PET) are required.
    Daily rainfall data for relevant rain gauges were obtained from Met Éireann, the Irish meteorological
    office. These daily point rainfall estimates were converted into catchment average rainfall using the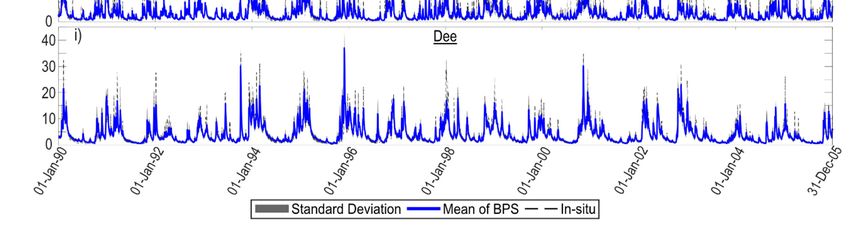
Water 2020, 12, 2202                                                                                  5 of 15

2.3. Meteorological Data
     To run the SMART model, both rainfall and potential evapotranspiration (PET) are required. Daily
rainfall data for relevant rain gauges were obtained from Met Éireann, the Irish meteorological office.
These daily point rainfall estimates were converted into catchment average rainfall using the Thiessen
Polygon method. For the nine study catchments, the annual average rainfall varied from 864.2 mm to
1392.7 mm.
     Potential evapotranspiration was also obtained from Met Éireann. Met Éireann estimates PET using
the FAO Penman–Monteith formula. However, unlike for rainfall, there are fewer locations where PET
is measured. Therefore, PET for each catchment was estimated by taking the values from the nearest
synoptic station. Table 2 lists the chosen synoptic stations for each catchment. Annual average PET across
the six stations varies from 526.6 mm to 581.1 mm.

2.4. Discharge
     Daily mean discharge records from 1990 to 2005 were collected from the furthest downstream
active gauge of each catchment. This data was obtained from the Irish Office of Public Works (OPW),
and this data is freely available at https://waterlevel.ie/hydro-data/. There was on average 5.3% missing
data from all nine gauges with a gauge number 26,007 on Suck recording the largest amount of missing
data with 22.24%.

2.5. Soil Moisture
      The soil moisture data were collected from the Global ASCAT Surface Soil Moisture Data Service
belonging to the GEO Department of TU Wien, who have been investigating and constantly improving
algorithms for retrieving soil moisture data from C-band scatterometer measurements since the
mid-1990s [48].
      The data of surface soil moisture are retrieved from the radar backscattering coefficients measured
by the ASCAT (advanced scatterometer) instrument on board the MetOp-A satellite using a change
detection method, developed at the Research Group Remote Sensing, Department of Geodesy and
Geoinformation (GEO), Vienna University of Technology (TU Wien).
      The soil moisture product represents the water content in the upper soil layer (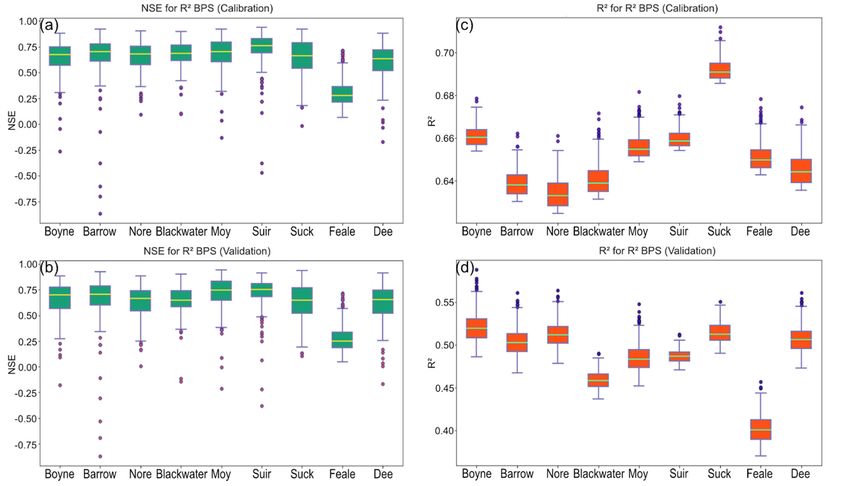
Water 2020, 12, 2202                                                                                                   6 of 15

     The simulated period from 1990 to 2005 was separated into three periods: model warm-up (1 January
1990 to 31 December 1990), calibration (1 January 1991 to 30 June 1998) and validation (1 July 1998
to 31 December 2005). The BPSs were chosen using the calibration period and one of the objective
functions and compared to both objective functions in validation. This was done for both objective
functions separately.
     Using the experiment design above, we aim to test three hypotheses during this study:
(1)    Calibration using only remotely sensed soil moisture would perform worse than calibrating to
       discharge data.
(2)    Remote sensed soil moisture will only be able to provide small benefits to simulate discharge in
       ungauged basins, especially in the case of Ireland.
(3)    A clear relationship between catchment size and model perform will be exhibited when using the
       R2 BPS.

3. Results
       In total, four different sets of results were produced:
•     Calibration using Nash Sutcliffe Efficiency (NSE) and validated using NSE
•     Calibration using NSE and validated using R2
•     Calibration using R2 and validated using R2
•     Calibration using R2 and validated using NSE

3.1. Calibration by Nash Sutcliffe Efficiency (NSE)
     Figure 3 shows the summary of the behavioural parameter set (BPS) based on NSE for the calibration
and validation period with Table 3 giving the mean, standard deviation and maximum NSE and R2 for
each catchment in calibration and validation. The results show that the SMART model can reproduce the
observed discharge to obtain high NSE values in most catchments and that there is a very small standard
deviation across the BPS. The one exception is the Feale catchment for which the median NSE is lower
than the others in both calibration and validation. However, there is a small difference if only the best
simulation is chosen.

       Table 3. Summary statistics (Nash Sutcliffe Efficiency (NSE) and R2 ) for calibration and validation
       using the NSE behavioural parameter set (BPS) in the format calibration (validation).

                                              NSE                                              R2
                                    Calibration (Validation)                         Calibration (Validation)
                            Boyne           Barrow             Nore          Boyne           Barrow             Nore
          Mean           0.792 (0.824)    0.83 (0.842)    0.812 (0.806)   0.627 (0.472)    0.591 (0.452)   0.585 (0.464)
    Standard Deviation   0.025 (0.028)    0.023 (0.03)    0.028 (0.03)    0.029 (0.042)    0.038 (0.045)   0.038 (0.043)
          Max            0.882 (0.911)    0.92 (0.929)    0.906 (0.898)   0.674 (0.578)    0.656 (0.552)   0.654 (0.556)
                         Blackwater           Moy              Suir       Blackwater           Moy              Suir
          Mean           0.838 (0.811)    0.896 (0.91)    0.861 (0.848)   0.595 (0.404)    0.607 (0.434)   0.627 (0.444)
    Standard Deviation   0.024 (0.041)    0.013 (0.019)   0.022 (0.03)    0.034 (0.039)    0.035 (0.03)    0.034 (0.041)
          Max            0.906 (0.914)    0.939 (0.952)   0.94 (0.912)    0.663 (0.49)      0.66 (0.51)    0.68 (0.513)
                            Suck             Feale             Dee           Suck             Feale             Dee
          Mean           0.903 (0.915)    0.614 (0.593)   0.788 (0.829)   0.629 (0.447)    0.569 (0.365)   0.611 (0.47)
    Standard Deviation   0.016 (0.018)    0.064 (0.072)   0.029 (0.033)   0.045 (0.042)    0.049 (0.024)   0.026 (0.033)
          Max            0.943 (0.95)     0.809 (0.817)   0.88 (0.917)    0.698 (0.546)    0.667 (0.438)   0.668 (0.554)

     The results for R2 in both the calibration and validation periods using the NSE BPS show similar
patterns as the NSE results. The average R2 value across all catchments was 0.604 in the calibration period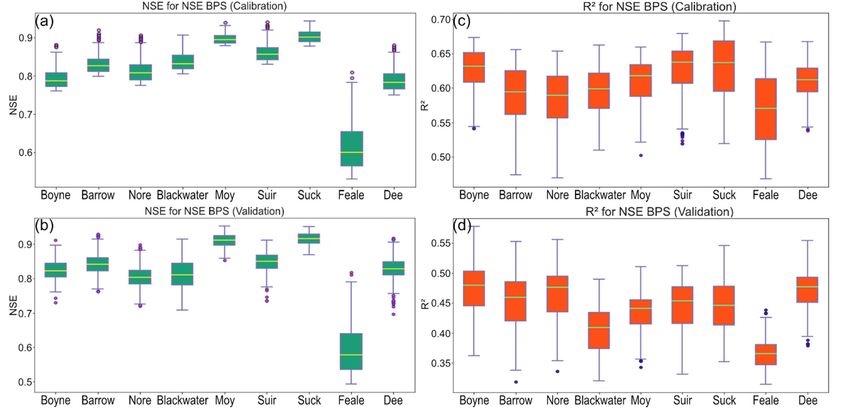
Boyne Barrow Nore Boyne Barrow Nore
Mean 0.792 (0.824) 0.83 (0.842) 0.812 (0.806) 0.627 (0.472) 0.591 (0.452) 0.585 (0.464)
Standard Deviation 0.025 (0.028) 0.023 (0.03) 0.028 (0.03) 0.029 (0.042) 0.038 (0.045) 0.038 (0.043)
Max 0.882 (0.911) 0.92 (0.929) 0.906 (0.898) 0.674 (0.578) 0.656 (0.552) 0.654 (0.556)
Water 2020, 12, 2202 Blackwater Moy Suir Blackwater Moy 7 ofSuir
15
Mean 0.838 (0.811) 0.896 (0.91) 0.861 (0.848) 0.595 (0.404) 0.607 (0.434) 0.627 (0.444)
Standard Deviation 0.024 (0.041) 0.013 (0.019) 0.022 (0.03) 0.034 (0.039) 0.035 (0.03) 0.034 (0.041)
andMax
0.439 in the validation period.
0.906 (0.914) As with
0.939 the NSE
(0.952) 0.94results,
(0.912) Suck performed
0.663 (0.49) best for(0.51)
0.66 the calibration
0.68 (0.513)
period with a R2 value of 0.629 and the Feale catchment performed the worst in both periods. As with
Suck Feale Dee Suck Feale Dee
the NSE results, the results of the R2 analysis, using the NSE BPS, show that catchment size does not
Mean 0.903 (0.915) 0.614 (0.593) 0.788 (0.829) 0.629 (0.447) 0.569 (0.365) 0.611 (0.47)
have any role in the performance. This is seen in Figure 3 where the catchments are shown in order of
Standard Deviation 0.016 (0.018) 0.064 (0.072) 0.029 (0.033) 0.045 (0.042) 0.049 (0.024) 0.026 (0.033)
catchment size with the Boyne being the largest and the Dee being the smallest.
Max 0.943 (0.95) 0.809 (0.817) 0.88 (0.917) 0.698 (0.546) 0.667 (0.438) 0.668 (0.554)
Figure 3. Box plots of NSE and R2 performance using the NSE BPS, (a) NSE results for Calibration;
(b) NSE results for Validation; (c) R2 results for Calibration; and (d) R2 results in Validation.
Figure 3. Box plots of NSE and R2 performance using the NSE BPS, (a) NSE results for Calibration; (b)
Figure
NSE 4 shows
results the mean(c)
for Validation; andR2 standard
results for deviation
Calibration;ofand
all (d)
NSE R2 BPS simulations
results for all nine study
in Validation.
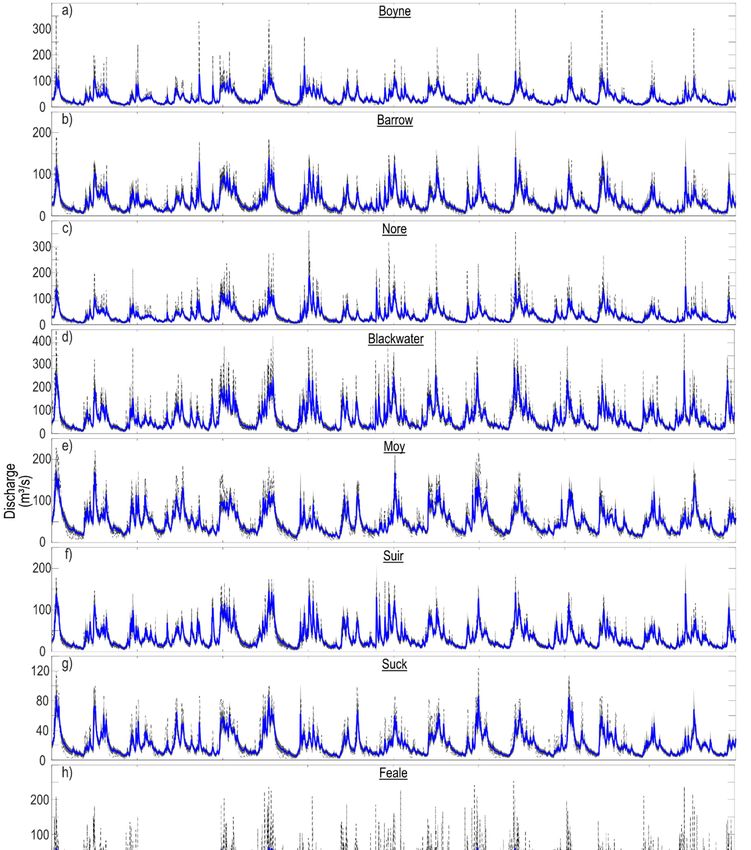
catchments compared to in situ observations. With the exception of Feale, it is clearly seen that the
mean of the NSE BPS simulations is able to closely reproduce the temporal pattern observed in the
in situ observations. This is the case for both high and low flow periods. This is not unexpected as the
use of NSE as an objective function is widely used, though it does place more emphasis on high flows.
3.2. Calibration by R2
The second BPS was obtained by a R2 comparison between the top soil moisture layer in the SMART
model and the remotely sensed soil moisture product. Figure 5 and Table 4 show the performance of
the R2 BPS in relation to NSE and R2 in both the calibration and validation periods. The results are
very similar to those using the NSE BPS with an average R2 of 0.653 in the calibration period and 0.488
in the validation period. As with the previous results, Suck is the best performing catchment in the
calibration period; however, Feale is no longer the worst catchment in both periods and is the fifth best
catchment in the calibration period but the worst in the validation period. As expected, comparing
the R2 results for both BPS, the spread in performance as measured by the standard deviation is far
smaller with the R2 BPS with an order of magnitude difference in the calibration period.
The results for NSE in both the calibration and validation periods using the R2 BPS show a very similar
pattern to those using the NSE BPS. The majority of catchments behave very similarly and produce very
comparable NSE scores, with Feale being an exception again. The average of the mean performance across
all catchments is smaller than those using the NSE BPS at 0.630 and 0.624 in the calibration and validation
periods, respectively. However, for the majority of the catchments, with the exception of Feale, there are
a number of outliers for which the NSE scores are less than 0. This indicates that, for some simulations,
the performance is worse than the mean discharge. If we ignore outliers, the NSE performance is always
greater than 0. Looking at the interquartile ranges (green area of box plots), the results show that 50% of the
R2 BPS produce NSE scores greater than 0.50 in both the calibration and validation periods.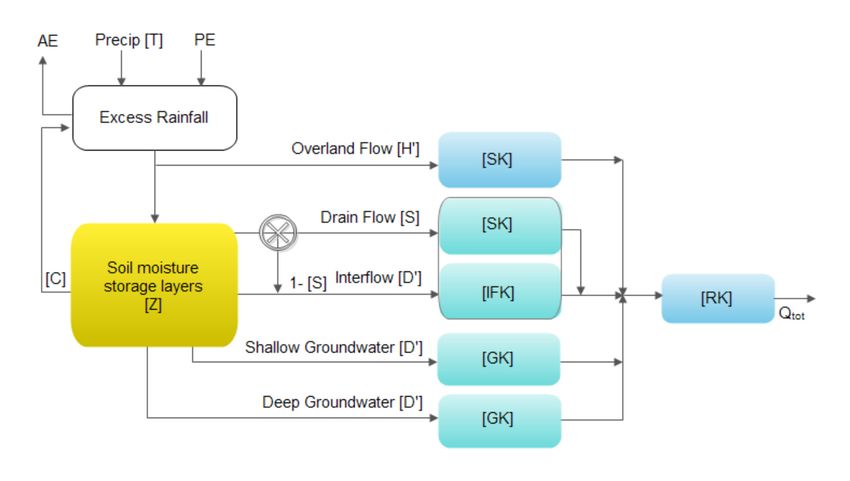
Water 2020, 12, x FOR PEER REVIEW                                                                                8 of 16

       Figure 4 shows the mean and standard deviation of all NSE BPS simulations for all nine study
 catchments compared to in situ observations. With the exception of Feale, it is clearly seen that the
 mean of the NSE BPS simulations is able to closely reproduce the temporal pattern observed in
Water 2020, 12, 2202
                                                                                                      the
                                                                                                   8 of 15
 in situ observations. This is the case for both high and low flow periods. This is not unexpected as the
 use of NSE as an objective function is widely used, though it does place more emphasis on high flows.

     Figure 4. Simulated hydrographs using the NSE BPS compared to in situ observations for all catchments:
     (a) Boyne; (b) Barrow; (c) Nore; (d) Blackwater; (e) Moy; (f) Suir; (g) Suck; (h) Feale; and (i) Dee. The mean
     of BPS corresponds to the mean of all BPS simulations.
Water 2020, 12, 2202 9 of 15
Table 4. R2 summary statistics (NSE and R2 ) for calibration and validation using the R2 BPS in the
format calibration (validation).
NSE R2
Calibration (Validation) Calibration (Validation)
Boyne Barrow Nore Boyne Barrow Nore
Mean 0.650 (0.661) 0.679 (0.676) 0.661 (0.634) 0.661 (0.521) 0.639 (0.504) 0.634 (0.513)
Standard Deviation 0.138 (0.150) 0.172 (0.177) 0.132 (0.146) 0.005 (0.017) 0.006 (0.016) 0.007 (0.014)
Max 0.882 (0.885) 0.92 (0.928) 0.906 (0.885) 0.679 (0.588) 0.662 (0.561) 0.661 (0.564)
Blackwater Moy Suir Blackwater Moy Suir
Mean 0.683 (0.655) 0.691 (0.73) 0.743 (0.732) 0.64 (0.459) 0.656 (0.485) 0.66 (0.487)
Standard Deviation 0.115 (0.12) 0.135 (0.135) 0.133 (0.128) 0.007 (0.01) 0.006 (0.015) 0.004 (0.007)
Max 0.901 (0.9) 0.922 (0.943) 0.94 (0.912) 0.672 (0.49) 0.682 (0.548) 0.68 (0.513)
Suck Feale Dee Suck Feale Dee
Mean 0.651 (0.637) 0.297 (0.268) 0.614 (0.627) 0.692 (0.515) 0.651 (0.402) 0.645 (0.507)
Standard Deviation 0.161 (0.166) 0.119 (0.119) 0.15 (0.163) 0.005 (0.012) 0.006 (0.016) 0.007 (0.015)
Max
Water 2020, 0.925
12, x FOR PEER (0.939)
REVIEW 0.717 (0.717) 0.88 (0.915) 0.712 (0.551) 0.678 (0.457) 0.674 (0.561)
10 of 16
Figure5.5.Boxplot
Figure Boxplotofof
NSE
NSE and R2 R
and performance using
2 performance the R
using
2
theBPS, (a) NSE
R2 BPS, results
(a) NSE for Calibration;
results (b) NSE
for Calibration; (b)
results for Validation; (c) R2 results for Calibration; and (d) R 2 results in Validation.
NSE results for Validation; (c) R results for Calibration; and (d) R results in Validation.
2 2
Figure 6 shows the mean and standard deviation of all R2 2BPS simulations for all nine study
Figure 6 shows the mean and standard deviation of all R BPS simulations for all nine study
catchments compared to in situ observations. A similar pattern to the hydrographs shown in Figure 4
catchments compared to in situ observations. A similar2pattern to the hydrographs shown in Figure
can be seen in the mean and standard deviation of the R BPS simulations, with the Feale catchment
4 can be seen in the mean and standard deviation of the R2 BPS simulations, with the Feale catchment
performing worse. For all other catchments, it is clearly seen that the simulations perform better for
performing worse. For all other catchments, it is clearly seen that the simulations perform better for
low flow periods than for higher flow periods. This is clearly visible for the larger catchments, such as
low flow periods than for higher flow periods. This is clearly visible for the larger catchments, such
Nore or Blackwater, where the mean and standard deviation of the R2 BPS are unable to match the
as Nore or Blackwater, where the mean and standard deviation of the R2 BPS are unable to match the
observed peak flows but are able to capture the low flow periods.
observed peak flows but are able to capture the low flow periods.Water 2020, 12, 2202 10 of 15
Water 2020, 12, x FOR PEER REVIEW 11 of 16
Figure 6. Simulated hydrographs using the R22 BPS compared to in situ observations for all catchments:
Figure 6. Simulated hydrographs using the R BPS compared to in situ observations for all catchments:
(a) Boyne; (b) Barrow; (c) Nore; (d) Blackwater; (e) Moy; (f) Suir; (g) Suck; (h) Feale; and (i) Dee.
(a) Boyne; (b) Barrow; (c) Nore; (d) Blackwater; (e) Moy; (f) Suir; (g) Suck; (h) Feale; and (i) Dee. The
The mean of BPS corresponds to the mean of all BPS simulations.
mean of BPS corresponds to the mean of all BPS simulations.
4. DiscussionWater 2020, 12, 2202 11 of 15
4. Discussion
4.1. Hydrograph Comparison
It is clear from Figures 4 and 6 that the NSE BPS can match the observed temporal variation in
discharge better than the R2 BPS. Both BPSs were able to capture low flow periods within the one
standard deviation of the mean of all simulations, while the R2 BPSs were unable to match either
the NSE BPS or the observations during high flows. However, this is expected as the NSE BPSs
were determined by comparing simulated discharge to in situ observations while the R2 BPSs were
determined by comparing the top soil layer in the SMART model to remote sensed soil moisture
estimates. Therefore, in the case of the R2 BPS, no information the hydrograph response was used.
4.2. Hypothesis Tests
Prior to analysing the results, it was hypothesized that calibration of the SMART model using
only soil moisture from satellite remote sensing would (1) perform worse than calibrating to discharge
data; (2) provide only a small benefit to simulate discharge in ungauged basins, especially in the case
of Ireland; and (3) exhibit a clear relationship with catchment size.
By comparing the results of the two sets of behavioural parameters, it is clear that hypothesis 1 is
true but not to the scale expected. A far larger difference in performance was expected, as the catchments
studied were relatively small compared to the spatial footprint of the soil moisture data. The spatial
footprint of the soil moisture product is 625 km2 , while the catchments studied varied between 305 km2
and 2467 km2 . Using the NSE BPS, the average of NSE performance across all catchments was 0.815 and
0.820 in the calibration and validation periods, respectively, while the performances across the same two
period using the R2 BPS were 0.630 and 0.624. While this clearly shows that calibrating with discharge
data is superior than calibrating with remotely sensed soil moisture data, it does show that, for the nine
catchments in this study, soil moisture is a very important model state in simulating discharge. This is
also supported by Figures 4 and 6.
This also disproves our second hypothesis that remotely sensed soil moisture would only have a
small benefit in ungauged catchments. Across all the catchments calibrated using the R2 BPS, the SMART
model was able to produce simulated hydrographs that produced good NSE scores. The calibration of
the SMART model with only remotely sensed soil moisture was able to simulate realistic hydrographs,
as shown in Figure 6, though higher flows may be underestimated if only remotely sensed soil moisture
for calibration is used and though in an ungauged catchment this might be the only information available.
There were a small number of behavioural parameter sets that resulted in negative NSE values, indicating
that, for these small number of simulations, the performances were worse than the mean discharge;
however, these did not result in the mean and standard deviations of all R2 BPS simulation being unusable.
As previously stated, it was expected that there would be a clear relationship between catchment
size and the benefit of remotely sensed soil moisture. It was expected, based off a previous study [52],
that the larger catchments would produce better results than smaller catchments in the study. The results
would indicate that there is no relationship between remote sensed soil moisture, catchment size and
model performance. From the results, it is clear that the result using the R2 BPS follow the same pattern
as the NSE BPS. Neither set exhibits any relationship with catchment size, and both sets performed
poorly for the same catchment (Feale).
4.3. Limitation and Future Work
In this study, nine catchments were chosen for the purpose of this research. These were chosen
to be representative of the geography, meteorology and topography of Ireland. No strong inference
to the value of remotely sensed soil moisture for smaller catchments can be made from this study,
as the smallest catchment chosen was Dee for which catchment area is 305 km2 . However, a previous
study [52] noted that it is better to choose catchments where the area is greater than one pixel of the
remote sensing product. Four catchments (Boyne, Barrow, Nore and Blackwater) were chosen in whichWater 2020, 12, 2202 12 of 15
the catchment areas are greater than 2000 km2 and these cover the majority of the large Irish rivers.
Catchments that are heavily influenced by Karst features were also excluded from this study.
Any further study should try to address the limitations mentioned and investigate if the value of
remotely sensed soil moisture is consistent throughout larger catchments, if including more layers in
the analysis would improve the results, if including existing methods of estimating soil moisture to
depths of 1 m have any benefit and if the results are model dependent.
5. Conclusions
Nine gauged catchments across Ireland with catchment areas ranging from 305 km2 to 2467 km2 were
chosen to investigate the feasibility of discharge prediction in ungauged basins using only remotely sensed
soil moisture. A lumped conceptual hydrological model, the Soil Moisture Accounting and Routing
for Transport (SMART) was calibrated and validated by observed discharge and remotely sensed soil
moisture using the Nash Sutcliffe Efficiency (NSE) and coefficient of determination (R2 ) respectively to
select Behavioural Parameter Sets (BPS) for each objective function. Using these BPS, three hypotheses
were tested: (1) calibration using only remotely sensed soil moisture would perform worse than calibrating
to discharge data; (2) remote sensed soil moisture will only be able to provide small benefits to simulate
discharge in ungauged basins, especially in the case of Ireland; and (3) a clear relationship between
catchment size and model performance will be exhibited when using the R2 BPS.
From the results, hypothesis 1 was proven true but to a smaller degree than expected. Calibrating the
SMART model using remotely sensed soil moisture was able to simulate hydrographs that captured the
low flows though underestimated the peak flow while still obtaining good NSE values (on average 0.630
across all nine catchments in the calibration period). Hypothesis 2 was disproven. Simulated hydrographs
using parameter only estimated from remotely sensed soil moisture was able to closely reproduce the
temporal variation of the in situ observations, though performing better at low flow periods compared to
peak flows. Finally, the third hypothesis was disproven. It was assumed that a relationship in performance
and catchment size would be visible in the results, especially when using remotely sensed soil moisture.
However, this relationship was not apparent with either objective function or in the simulated hydrographs.
Care must be taken using only remotely sensed soil moisture for calibration as it provides no
information on the hydrological response of the river, which is necessary to accurately capture peak flow.
Nonetheless, this study found that remotely sensed soil moisture is feasible for the parameterization of
hydrological model for use in ungauged basins.
Author Contributions: Conceptualization, F.E.O.; methodology, C.Y. and F.E.O.; simulations, C.Y.; data Analysis,
C.Y. and F.E.O.; original draft preparation, C.Y.; review and editing, F.E.O.; visualization, C.Y.; supervision, F.E.O.
All coauthors reviewed the manuscript prior to and during the submission process to the Water MDPI journal.
All authors have read and agreed to the published version of the manuscript.
Funding: This research received no external funding.
Acknowledgments: The authors would like to thank Thibault Hallouin for providing the SMART model code in
python for this study.
Conflicts of Interest: The authors declare no conflict of interest.
References
1. Sivapalan, M. Prediction in ungauged basins: A grand challenge for theoretical hydrology. Hydrol. Process.
2003, 17, 3163–3170. [CrossRef]
2. Fekete, B.M.; Vörösmarty, C.J. The current status of global river discharge monitoring and potential new
technologies complementing traditional discharge measurements. IAHS Publ. 2007, 309, 129–136.
3. Shiklomanov, A.; Lammers, R.B.; Vörösmarty, C.J. Widespread decline in hydrological monitoring threatens
Pan-Arctic Research. Eos Trans. Am. Geophys. Union 2002, 83, 13. [CrossRef]
4. Becker, M.; Da Silva, J.S.; Calmant, S.; Robinet, V.; Linguet, L.; Seyler, F. Water level fluctuations in the congo
basin derived from ENVISAT satellite altimetry. Remote. Sens. 2014, 6, 9340–9358. [CrossRef]Water 2020, 12, 2202 13 of 15
5. O’Loughlin, F.; Neal, J.; Yamazaki, D.; Bates, P.D. ICESat-derived inland water surface spot heights. Water
Resour. Res. 2016, 52, 3276–3284. [CrossRef]
6. Brocca, L.; Ciabatta, L.; Massari, C.; Camici, S.; Tarpanelli, A. Soil moisture for hydrological applications:
Open questions and new opportunities. Water 2017, 9, 140. [CrossRef]
7. Massari, C.; Brocca, L.; Moramarco, T.; Tramblay, Y.; Lescot, J.-F.D. Potential of soil moisture observations in
flood modelling: Estimating initial conditions and correcting rainfall. Adv. Water Resour. 2014, 74, 44–53.
[CrossRef]
8. Tramblay, Y.; Bouvier, C.; Martin, C.; Didon-Lescot, J.-F.; Todorovik, D.; Domergue, J.-M. Assessment of initial
soil moisture conditions for event-based rainfall–runoff modelling. J. Hydrol. 2010, 387, 176–187. [CrossRef]
9. Wooldridge, S.; Kalma, J.; Walker, J. Importance of soil moisture measurements for inferring parameters in
hydrologic models of low-yielding ephemeral catchments. Environ. Model. Softw. 2003, 18, 35–48. [CrossRef]
10. Koren, V.; Moreda, F.; Smith, M. Use of soil moisture observations to improve parameter consistency in
watershed calibration. Phys. Chem. Earth Parts A/B/C 2008, 33, 1068–1080. [CrossRef]
11. Matgen, P.; Fenicia, F.; Heitz, S.; Plaza, D.; De Keyser, R.; Pauwels, V.R.N.; Wagner, W.; Savenije, H. Can
ASCAT-derived soil wetness indices reduce predictive uncertainty in well-gauged areas? A comparison with
in situ observed soil moisture in an assimilation application. Adv. Water Resour. 2012, 44, 49–65. [CrossRef]
12. Aubert, D.; Loumagne, C.; Oudin, L. Sequential assimilation of soil moisture and streamflow data in a
conceptual rainfall–runoff model. J. Hydrol. 2003, 280, 145–161. [CrossRef]
13. Chen, F.; Crow, W.T.; Starks, P.J.; Moriasi, D.N. Improving hydrologic predictions of a catchment model via
assimilation of surface soil moisture. Adv. Water Resour. 2011, 34, 526–536. [CrossRef]
14. Peng, J.; Niesel, J.; Loew, A. Evaluation of soil moisture downscaling using a simple thermal-based proxy
REMEDHUS network (Spain) example. Hydrol. Earth Syst. Sci. 2015, 19, 4765–4782. [CrossRef]
15. Petropoulos, G.P.; Ireland, G.; Barrett, B. Surface soil moisture retrievals from remote sensing: Current status,
products & future trends. Phys. Chem. Earth Parts A/B/C 2015, 83, 36–56. [CrossRef]
16. Loew, A.; Ludwig, R.; Mauser, W. Derivation of surface soil moisture from ENVISAT ASAR wide swath and
image mode data in agricultural areas. IEEE Trans. Geosci. Remote Sens. 2006, 44, 889–899. [CrossRef]
17. Njoku, E.; Jackson, T.J.; Lakshmi, V.; Chan, T.; Nghiem, S. Soil moisture retrieval from AMSR-E. IEEE Trans.
Geosci. Remote Sens. 2003, 41, 215–229. [CrossRef]
18. Wagner, W.; Blöschl, G.; Pampaloni, P.; Calvet, J.-C.; Bizzarri, B.; Wigneron, J.-P.; Kerr, Y. Operational readiness
of microwave remote sensing of soil moisture for hydrologic applications. Hydrol. Res. 2007, 38, 1–20. [CrossRef]
19. Owe, M.; De Jeu, R.; Holmes, T.R. Multisensor historical climatology of satellite-derived global land surface
moisture. J. Geophys. Res. Space Phys. 2008, 113. [CrossRef]
20. Naeimi, V.; Scipal, K.; Bartalis, Z.; Hasenauer, S.; Wagner, W. An improved soil moisture retrieval algorithm for
ERS and METOP scatterometer observations. IEEE Trans. Geosci. Remote Sens. 2009, 47, 1999–2013. [CrossRef]
21. Kerr, Y.; Waldteufel, P.; Wigneron, J.-P.; Martinuzzi, J.; Font, J.; Berger, M. Soil moisture retrieval from space:
The Soil Moisture and Ocean Salinity (SMOS) mission. IEEE Trans. Geosci. Remote Sens. 2001, 39, 1729–1735.
[CrossRef]
22. Entekhabi, D.; Njoku, E.G.; O’Neill, P.E.; Kellogg, K.H.; Crow, W.T.; Edelstein, W.N.; Entin, J.K.; Goodman, S.D.;
Jackson, T.J.; Johnson, J.; et al. The Soil Moisture Active Passive (SMAP) mission. Proc. IEEE 2010, 98, 704–716.
[CrossRef]
23. Liu, Y.Y.; Parinussa, R.M.; Dorigo, W.A.; De Jeu, R.A.M.; Wagner, W.; Van Dijk, A.I.J.M.; McCabe, M.F.; Evans, J.
Developing an improved soil moisture dataset by blending passive and active microwave satellite-based
retrievals. Hydrol. Earth Syst. Sci. 2011, 15, 425–436. [CrossRef]
24. Wagner, W.; Dorigo, W.; De Jeu, R.; Fernandez, D.; Benveniste, J.; Haas, E.; Ertl, M. Fusion of active and
passive microwave observations to create an essential climate variable data record on soil moisture. ISPRS
Ann. Photogramm. Remote Sens. Spat. Inf. Sci. 2012, 7, 315–321.
25. Dorigo, W.; Gruber, A.; De Jeu, R.; Wagner, W.; Stacke, T.; Loew, A.; Calvet, J.-C.; Brocca, L.; Chung, D.;
Parinussa, R.; et al. Evaluation of the ESA CCI soil moisture product using ground-based observations.
Remote Sens. Environ. 2015, 162, 380–395. [CrossRef]
26. Albergel, C.; De Rosnay, P.; Gruhier, C.; Muñoz-Sabater, J.; Hasenauer, S.; Isaksen, L.; Kerr, Y.; Wagner, W.
Evaluation of remotely sensed and modelled soil moisture products using global ground-based in situ
observations. Remote Sens. Environ. 2012, 118, 215–226. [CrossRef]Water 2020, 12, 2202 14 of 15
27. Jackson, T.J.; Bindlish, R.; Cosh, M.H.; Zhao, T.; Starks, P.J.; Bosch, D.D.; Seyfried, M.; Moran, M.S.;
Goodrich, D.C.; Kerr, Y.H.; et al. Validation of Soil Moisture and Ocean Salinity (SMOS) soil moisture over
watershed networks in the U.S. IEEE Trans. Geosci. Remote Sens. 2011, 50, 1530–1543. [CrossRef]
28. Peng, J.; Niesel, J.; Loew, A.; Zhang, S.; Wang, J. Evaluation of satellite and reanalysis soil moisture products
over southwest China using ground-based measurements. Remote Sens. 2015, 7, 15729–15747. [CrossRef]
29. Sanchez, N.; Perez-Gutierrez, C.; Martinez-Fernandez, J.; Scaini, A. Validation of the SMOS L2 soil moisture
data in the REMEDHUS network (Spain). IEEE Trans. Geosci. Remote Sens. 2012, 50, 1602–1611. [CrossRef]
30. Parajka, J.; Naeimi, V.; Blöschl, G.; Komma, J. Matching ERS scatterometer based soil moisture patterns with
simulations of a conceptual dual layer hydrologic model over Austria. Hydrol. Earth Syst. Sci. 2009, 13,
259–271. [CrossRef]
31. Brocca, L.; Crow, W.T.; Ciabatta, L.; Massari, C.; De Rosnay, P.; Enenkel, M.; Hahn, S.; Amarnath, G.; Camici, S.;
Tarpanelli, A.; et al. A review of the applications of ASCAT soil moisture products. IEEE J. Sel. Top. Appl.
Earth Obs. Remote Sens. 2017, 10, 2285–2306. [CrossRef]
32. Moran, M.S.; Doorn, B.; Escobar, V.; Brown, M.E. Connecting NASA science and engineering with earth
science applications. J. Hydrometeorol. 2015, 16, 473–483. [CrossRef]
33. Kunnath-Poovakka, A.; Ryu, D.; Renzullo, L.; George, B. The efficacy of calibrating hydrologic model using
remotely sensed evapotranspiration and soil moisture for streamflow prediction. J. Hydrol. 2016, 535, 509–524.
[CrossRef]
34. Sutanudjaja, E.H.; Van Beek, L.P.H.; De Jong, S.; Van Geer, F.C.; Bierkens, M.F.P. Calibrating a large-extent
high-resolution coupled groundwater-land surface model using soil moisture and discharge data. Water
Resour. Res. 2014, 50, 687–705. [CrossRef]
35. Silvestro, F.; Gabellani, S.; Rudari, R.; Delogu, F.; Laiolo, P.; Boni, G. Uncertainty reduction and parameter
estimation of a distributed hydrological model with ground and remote-sensing data. Hydrol. Earth Syst. Sci.
2015, 19, 1727–1751. [CrossRef]
36. Rajib, A.; Merwade, V.; Yu, Z. Multi-objective calibration of a hydrologic model using spatially distributed
remotely sensed/in-situ soil moisture. J. Hydrol. 2016, 536, 192–207. [CrossRef]
37. Kundu, D.; Vervoort, R.W.; Van Ogtrop, F. The value of remotely sensed surface soil moisture for model
calibration using SWAT. Hydrol. Process. 2017, 31, 2764–2780. [CrossRef]
38. Tebbs, E.; Gerard, F.; Petrie, A.; De Witte, E. Emerging and potential future applications of satellite-based soil
moisture products. In Satellite Soil Moisture Retrieval; Petropoulos, G.P., Srivastava, P., Kerr, Y., Eds.; Elsevier:
Amsterdam, The Netherlands, 2016; Volume 19, pp. 379–400.
39. Peng, J.; Loew, A.; Merlin, O.; Verhoest, N.E.C. A review of spatial downscaling of satellite remotely sensed
soil moisture. Rev. Geophys. 2017, 55, 341–366. [CrossRef]
40. Abbaszadeh, P.; Moradkhani, H.; Zhan, X. Downscaling SMAP radiometer soil moisture over the CONUS
using an ensemble learning method. Water Resour. Res. 2019, 55, 324–344. [CrossRef]
41. Piles, M.; Sanchez, N.; Vall-Llossera, M.; Camps, A.; Martinez-Fernandez, J.; Martinez, J.; González-Gambau, V.
A downscaling approach for SMOS land observations: Evaluation of high-resolution soil moisture maps
over the Iberian Peninsula. IEEE J. Sel. Top. Appl. Earth Obs. Remote Sens. 2014, 7, 3845–3857. [CrossRef]
42. Wagner, W.; Lemoine, G.; Rott, H. A method for estimating soil moisture from ERS scatterometer and soil
data. Remote Sens. Environ. 1999, 70, 191–207. [CrossRef]
43. Manfreda, S.; Brocca, L.; Moramarco, T.; Melone, F.; Sheffield, J. A physically based approach for the
estimation of root-zone soil moisture from surface measurements. Hydrol. Earth Syst. Sci. 2014, 18, 1199–1212.
[CrossRef]
44. Nielsen, S.A.; Hansen, E. Numerical simulation of the rainfall-runoff process on a daily basis. Hydrol. Res.
1973, 4, 171–190. [CrossRef]
45. Mockler, E.M.; O’Loughlin, F.E.; Bruen, M. Understanding hydrological flow paths in conceptual catchment
models using uncertainty and sensitivity analysis. Comput. Geosci. 2016, 90, 66–77. [CrossRef]
46. Hallouin, T.; Bruen, M.; O’Loughlin, F.E.; Fiachra, E. Calibration of hydrological models for ecologically
relevant streamflow predictions: A trade-off between fitting well to data and estimating consistent parameter
sets? Hydrol. Earth Syst. Sci. 2020, 24, 1031–1054. [CrossRef]
47. O’Loughlin, F.; Bruen, M.; Wagener, T. Parameter sensitivity of a watershed-scale flood forecasting model as
a function of modelling time-step. Hydrol. Res. 2012, 44, 334–350. [CrossRef]Water 2020, 12, 2202 15 of 15
48. Wagner, W. Soil Moisture Retrieval from ERS Scatterometer Data; Vienna University of Technology: Vienna,
Austria, 1998.
49. Bartalis, Z.; Naeimi, V.; Hasenauer, S.; Wagner, W. ASCAT Soil Moisture Product Handbook; ASCAT Soil
Moisture Report Series; Institute of Photogrammetry and Remote Sensing, Vienna University of Technology:
Vienna, Austria, 2008.
50. Nash, J.E.; Sutcliffe, J.V. River flow forecasting through conceptual models-part I: A discussion of principles.
J. Hydrol. 1970, 10, 282–290. [CrossRef]
51. Beven, K.; Binley, A. The future of distributed models: Model calibration and uncertainty prediction. Hydrol. Process.
1992, 6, 279–298. [CrossRef]
52. Li, Y.; Grimaldi, S.; Pauwels, V.R.N.; Walker, J.P. Hydrologic model calibration using remotely sensed soil
moisture and discharge measurements: The impact on predictions at gauged and ungauged locations. J. Hydrol.
2018, 557, 897–909. [CrossRef]
© 2020 by the authors. Licensee MDPI, Basel, Switzerland. This article is an open access
article distributed under the terms and conditions of the Creative Commons Attribution
(CC BY) license (http://creativecommons.org/licenses/by/4.0/).You can also read