Report on the University of Liverpool's Statutory Gender Pay Gap 2017
←
→
Page content transcription
If your browser does not render page correctly, please read the page content below
Report on the University of Liverpool’s
                                       Statutory Gender Pay Gap
                                                           2017

                                                                  1
‘Icons made by CC3.0 BY/Flat Icon from www.flaticon.com’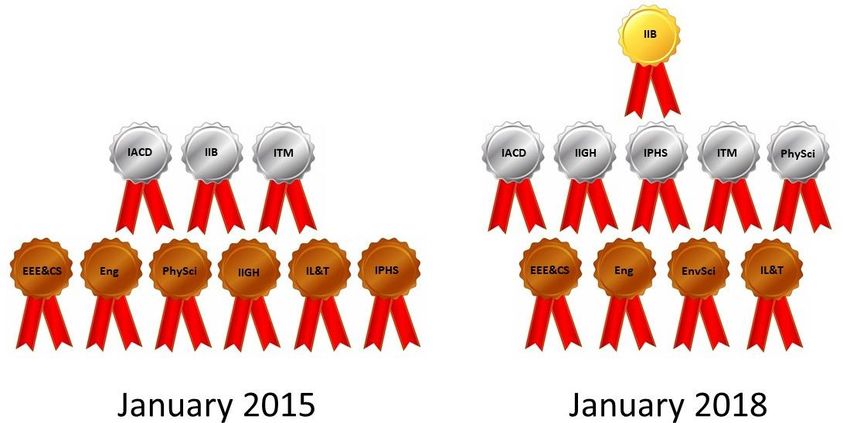
Contents

   Tables and Figures Index ..................................................................................................................... 3
   1.      Statement from the Vice Chancellor........................................................................................... 4
   2.      Introduction ................................................................................................................................ 5
   3.      About the University of Liverpool ............................................................................................... 6
   4.      Headline Gender Pay Gap figures and infographics ................................................................... 9
   5.      Statutory Gender Pay Gap Report ............................................................................................ 14
   5.1.        Statutory Gender Pay Gap .................................................................................................... 14
   5.1.1.         Understanding Bonus Pay ................................................................................................. 16
   5.2.        Gender Pay Gap – Excluding Casual Staff ............................................................................. 19
   6.      Causes of the Gender Pay Gap .................................................................................................. 20
   7.      Staff Satisfaction Survey ........................................................................................................... 24
   8.      Initiatives helping us to address our Gender Pay Gap .............................................................. 26
        8.1.      Athena SWAN.................................................................................................................... 26
        8.2.      Family Friendly Employer .................................................................................................. 27
        8.3.      Academic Promotion......................................................................................................... 27
        8.4.      Senior Management.......................................................................................................... 30
        8.5.      Training and Development................................................................................................ 31
        8.6.      Support Networks and Advice .......................................................................................... 32
   9.      Further Analysis ........................................................................................................................ 33
   Appendix 1: Calculating the Gender Pay Gap ................................................................................... 34
   Appendix 2: National Benchmark ..................................................................................................... 36

                                                                                                                                                        2
‘Icons made by CC3.0 BY/Flat Icon from www.flaticon.com’
Tables and Figures Index

Table Index

Table 1: Part Time contract type............................................................................................................. 7
Table 2: Statutory Gender Pay Gap data .............................................................................................. 14
Table 3: Mean and Median hourly income and annual bonus income ................................................ 15
Table 4: Quartile population ................................................................................................................. 15
Table 5: Hourly income and Gender Pay Gaps by quartiles.................................................................. 15
Table 6: Recipients of Exceptional Perforance Awards ........................................................................ 16
Table 7: Recipients of Clinical Excellence Awards................................................................................. 18
Table 8: Mean and median annual Clinical Excellence Awards pay ..................................................... 18
Table 9: Bonus pay gaps for those in receipt of CEA only..................................................................... 18
Table 10: Bonus pay gaps (excluding CEA)............................................................................................ 18
Table 11: Gender Pay Gap (excluding casuals) ..................................................................................... 19
Table 12: Quartile population (excluding casuals)................................................................................ 19
Table 13: Gender Pay Gaps by pay grade ............................................................................................. 20
Table 14: Gender Pay Gaps by job category ......................................................................................... 21
Table 15: Senior Management and gender .......................................................................................... 30
Table 16: Training opportunity uptake by female staff ........................................................................ 31
Table 17: UK National Gender Pay Gap benchmarks ............................................................................ 36

Figure Index

Figure 1: Job categories and gender ....................................................................................................... 6
Figure 2: Faculties and gender ................................................................................................................ 7
Figure 3: Working hours and gender ...................................................................................................... 7
Figure 4: Contract type and gender ........................................................................................................ 8
Figure 5: Pay grades and gender ............................................................................................................. 8
Figure 6: Mean hourly income ................................................................................................................ 9
Figure 7: Median hourly income ............................................................................................................. 9
Figure 8: Bonus pay ............................................................................................................................... 10
Figure 9: Pay quartiles and gender ....................................................................................................... 11
Figure 10: Hourly pay bands and gender .............................................................................................. 12
Figure 11: Hourly income by job category ............................................................................................ 13
Figure 12: Pay gap analysis by excluding defined categories ............................................................... 22
Figure 13: Staff Survey results .............................................................................................................. 24
Figure 14: Athena SWAN awards .......................................................................................................... 26
Figure 15: % Female Professors ............................................................................................................ 28
Figure 16: Senior Lecturer promotions ................................................................................................. 29
Figure 17: Reader promotions .............................................................................................................. 29
Figure 18: Chair promotions ................................................................................................................. 29
Figure 19: Senior Management and gender ......................................................................................... 30

                                                                                                                                                    3
‘Icons made by CC3.0 BY/Flat Icon from www.flaticon.com’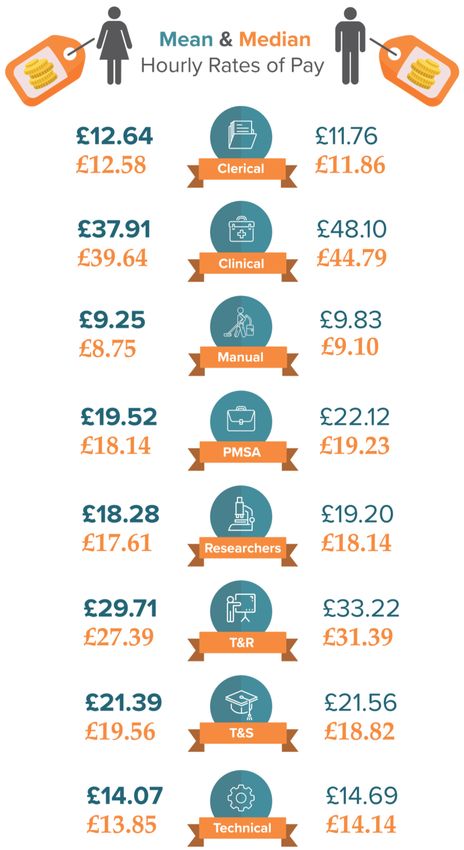
1. Statement from the Vice Chancellor

Here at the University of Liverpool, we are committed to improving equality for staff and
students and increasing our diversity as an institution. These values are enshrined in
Strategy 2026 and specifically our People Strategy, and they underpin everything we do.
As part of this we’ve made great strides in our work around gender equality, and we’re at
the start of a journey to achieve a sustainable, long-term approach to the gender pay gap.
This report is an important step in understanding the factors influencing our pay gap in
more detail and developing on our action plan designed to address them.
In order to do that we aim to remove those barriers that persist in stopping women
progressing to some senior roles and promote choice for all our staff to seek opportunities
across the many roles and careers available to us in the HE sector.
I am hugely proud of our work as a University to advance equality and diversity. I confirm
that the information within the report is accurate and will be used to further focus our
activity and increase the impact of the work that is already ongoing to create an equal
environment for everyone.
Yours sincerely,

Professor Dame Janet Beer
Vice Chancellor

                                                                                              4
‘Icons made by CC3.0 BY/Flat Icon from www.flaticon.com’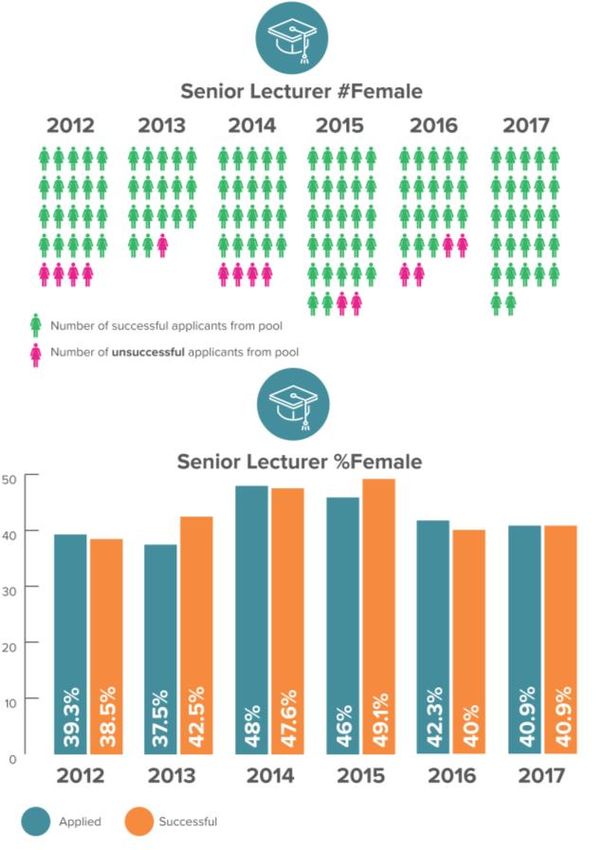
2. Introduction
In this report we provide the Statutory Gender Pay Gap data that is required to be published by the
Equality Act 2010 (Specific Duties and Public Authorities) Regulations 2017. The statutory data
requirements are:
The Mean Hourly Pay Gap (%) of all Full Pay Relevant Employees
The Median Hourly Pay Gap (%) of all Full Pay Relevant Employees
The Mean Bonus Pay Gap (%) of all Full Pay Relevant Employees
The Median Bonus Pay Gap (%) of all Full Pay Relevant Employees
The proportion (%) of women and men who received Bonus Pay
The proportion (%) of women and men on 4 equal population quartiles.
We have also expanded on the data analysis beyond these categories to help contextualise the
relevant pay gaps and make them more meaningful to the reader, and to help analyse and explain
the causes of the gender pay gap.
We have also completed a number of additional assessments which are not presented within this
report, but which are available in the Addendum. These additional assessments will be reported on
at a later date and include:
Equal Pay Audit
Gender Pay Gap by Grade and Increment Point
Gender Pay Gap by Job Category and Increment Point
Equality Characteristics and Intersectionality
Disability Pay Gap
Ethnicity Pay Gap
Sexual Orientation Pay Gaps
The analysis has been completed on the March 2017 payroll for all Full Pay Relevant Employees. The
analysis has been completed for each ‘post’ and not for each individual person, so where a person
has 2 different posts, each post has been counted and no attempt has been made to add posts
together.
Ordinary Pay, which the mean and median is calculated from, is a calculation of the hourly income
of an employee composed of their basic pay, allowances, shift premium pay, and any pay for
piecework. Bonus Pay is any form of money, vouchers, securities, securities options, or interests
received by an employee which is awarded as a result of profit sharing arrangements, productivity,
performance, incentives or commission. More detail on what is specifically included in this category
can be found on page 15-16.
A “Full Pay Relevant Employee” is defined as any employee who is not being paid either at a
reduced rate or nil as a result of being on leave. The methodology of how the hourly pay rate is
calculated is included in Appendix 1: Calculating the Gender Pay Gap.
5
‘Icons made by CC3.0 BY/Flat Icon from www.flaticon.com’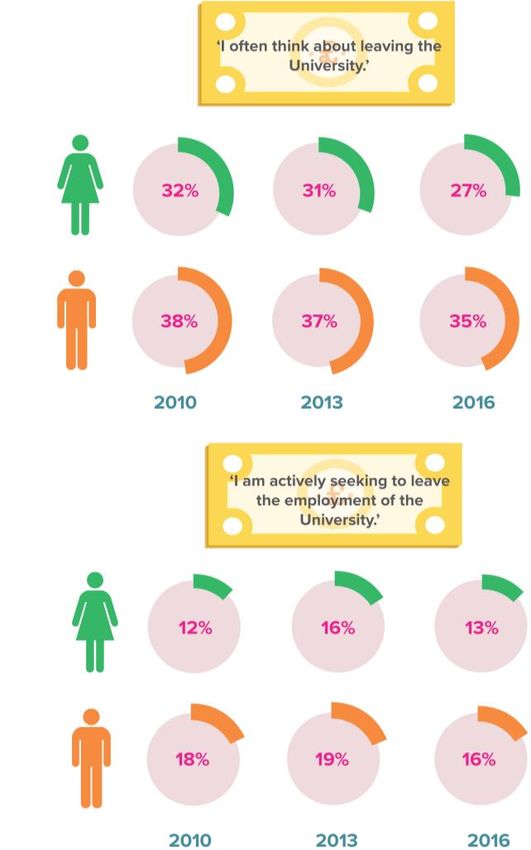
3. About the University of Liverpool

At the University of Liverpool we are committed to the principles of equality of opportunity for all, of
fairness and of inclusion. We are committed to providing an environment within which we recognise
and value people’s differences, and aim to capitalise on the strengths that these differences bring to
the institution.

Specifically we are committed to ensuring that our employees receive equal pay for equal work of
equal value, and more broadly we are committed to addressing the causes of our Gender Pay Gap.

In March 2017, the University employed 6817 full pay relevant employees at our Liverpool, Leahurst
(Wirral) and London campuses, of which 3783 (55.5%) were Female, and 3034 (44.5%) were Male.

These staff were engaged in a wide range of activities and are categorised as Clerical, Clinical,
Manual, Technical, Research, Teaching & Research (T&R), Teaching & Scholarship (T&S), and
Professional, Management & Specialist Administration (PMSA) staff.

Figure 1: Job categories and gender

The University delivers teaching at undergraduate, postgraduate taught and postgraduate research
level and undertakes world leading research in the Faculty of Health & Life Sciences (FHLS), Faculty
of Humanities & Social Sciences (FHSS), and the Faculty of Science and Engineering (FS&E);
supported by the Central Professional Services (CPS) departments such as Human Resources and
Student Administration & Support.

                                                                                                       6
‘Icons made by CC3.0 BY/Flat Icon from www.flaticon.com’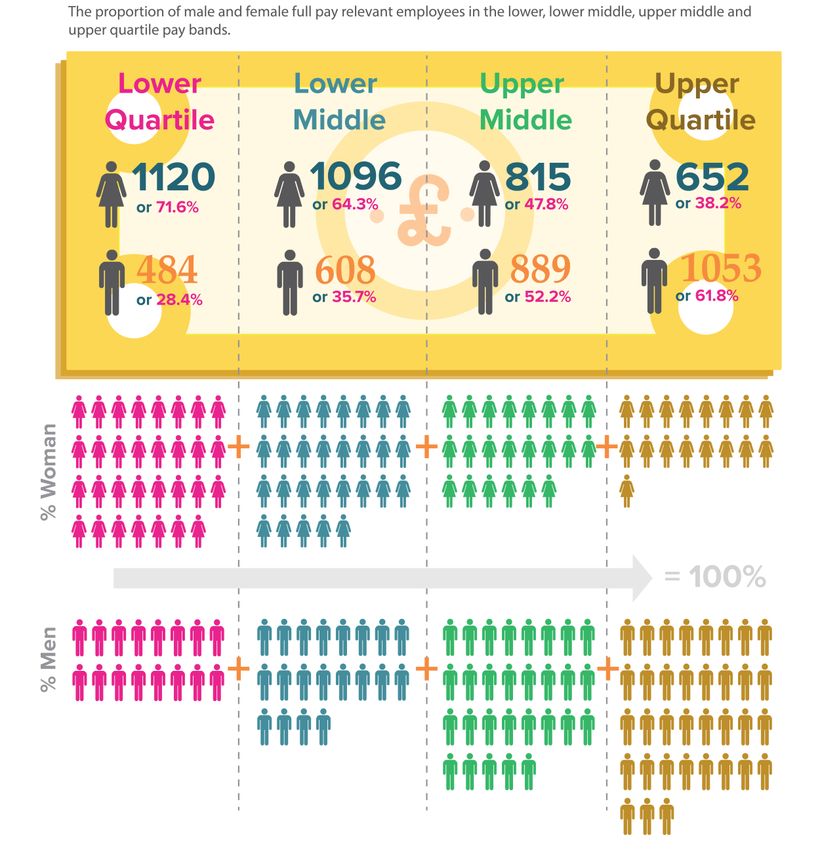
Figure 2: Faculties and gender

62.7% of employees work full time, of which 48.05% are female. 2542 employees work part time, of
which 779 are casual staff and 217 zero hour staff. 68% of part time staff are female.
Table 1: Part Time contract type

                                                                Female   Male
                                                    Part Time   1145     401
                                                    Zero Hour   86       131
                                                    Casual      498      281
                                                                1729     813

Figure 3: Working hours and gender

                                                                                               7
‘Icons made by CC3.0 BY/Flat Icon from www.flaticon.com’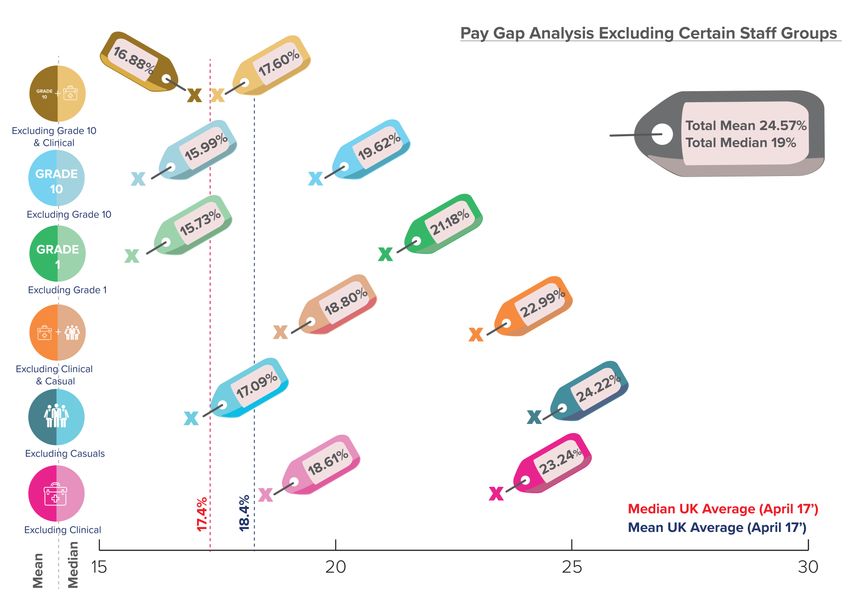
Excluding the Casual employees, 27.8% of employees are on a fixed term contract of which 55.3%
are female. Of the 4362 employees on a permanent contract, 54.1% are female.
Figure 4: Contract type and gender
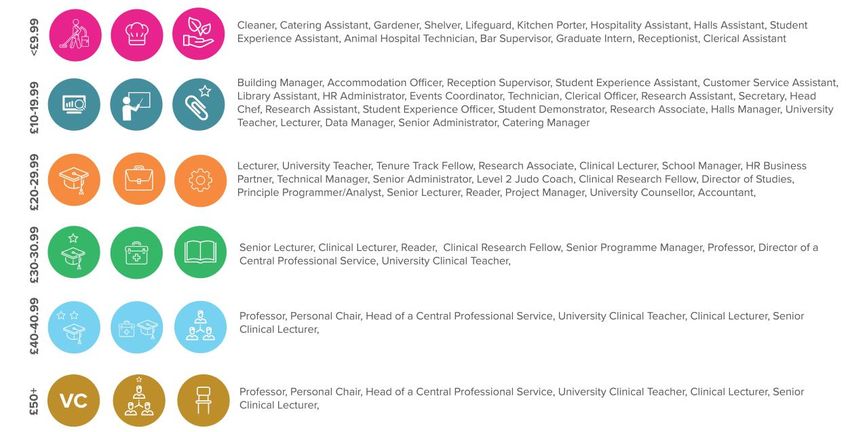
The University has a single pay spine made up of 10 grades and 59 increment points. Clinical staff are
linked to the NHS pay spine. Female employees make up a majority of staff on grades 1 to 7, and
male staff make up a majority on grades 8 to 10 and on Clinical grades.
Figure 5: Pay grades and gender
8
‘Icons made by CC3.0 BY/Flat Icon from www.flaticon.com’
4. Headline Gender Pay Gap figures and infographics

The Gender Pay Gap is defined as the difference between the mean and median hourly rate of pay
that male and female employees received in March 2017.

    The Mean Pay Gap is the difference                                       The Median Pay Gap is the difference
    between the average hourly earnings of                                   between the midpoints in the ranges of
    men and women.                                                           hourly earnings of men and women.1

A pay gap in favour of men is presented as a positive number and coloured black, and a pay gap in
favour of women is presented as a negative number and coloured red.

All data presented in this section has been calculated using the statutory reporting requirements,
unless otherwise stated.

Gender Pay Gap

    Mean Pay Gap

    24.57%
    vs 17.4% UK National                               (April 172)

    Median Pay Gap

    19.00%
    vs 18.4% UK National                               (April 17)

                                                                                                           Figure 6: Mean hourly income

                                                                                                         Figure 7: Median hourly income

1 The Median is the Office of National Statistics (ONS) preferred measure of average earnings as it is less affected by a relatively small
number of very high earners and the skewed distribution of earnings. It therefore gives a better indication of typical pay than the mean.
2 See

Appendix 2: National Benchmark for further details.

                                                                                                                                             9
‘Icons made by CC3.0 BY/Flat Icon from www.flaticon.com’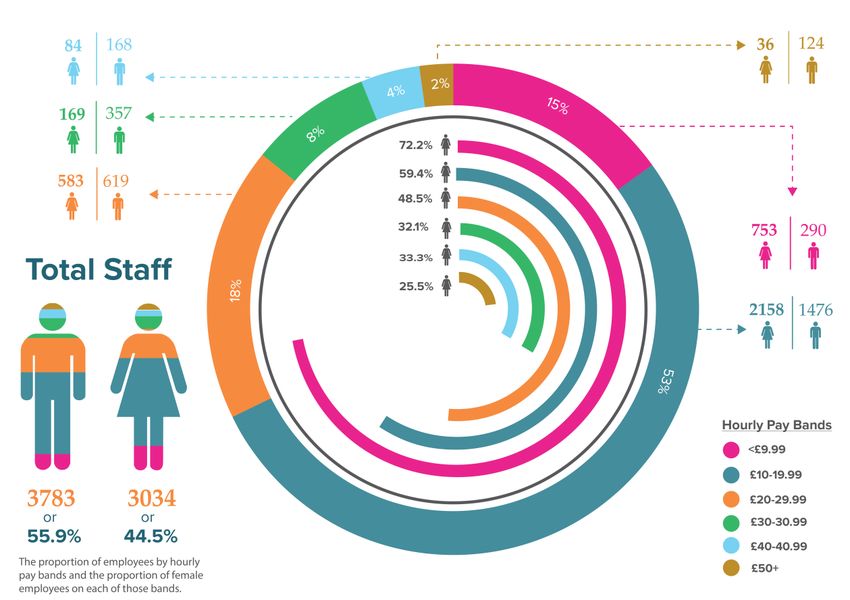
Gender Bonus Pay Gap
The Bonus Gender Pay Gap is defined as the difference between the mean and median bonus pay
that male and female employees received between the 1st April 2016 and the 31st March 2017.

 Bonus Pay is defined as any form of money, vouchers, securities, securities options, or interests
 received by an employee which is awarded as a result of profit sharing arrangements,
 productivity, performance, incentives or commission.

The University has 3 categories of bonus pay which are included in this analysis, 1) a contractual
bonus, 2) an Exceptional Performance Award (EPA), and 3) a Clinical Excellence Award (CEA).

 Mean Bonus Pay Gap                                                       Median Bonus Pay Gap

 76.16%                                                                   89.95%
 % Female Staff received Bonus Pay                                        % Male Staff received Bonus Pay

 1.30%                                                                    2.01%
                      Proportion of bonuses received by male and female employees

                                                           Figure 8: Bonus pay

For a further analysis of Bonus Pay see 5.1.1 Understanding Bonus Pay, page 16.

                                                                                                            10
‘Icons made by CC3.0 BY/Flat Icon from www.flaticon.com’
Proportion of male and female employees in each pay quartile
Figure 9: Pay quartiles and gender
Further details are available in Table 4: Quartile population and Table 5: Hourly income and Gender
Pay Gaps by quartiles, page 15.
11
‘Icons made by CC3.0 BY/Flat Icon from www.flaticon.com’Proportion of employees by hourly pay bands and the proportion of women
on each of those bands
We have assigned all employees to one of the below hourly pay bands to better illustrate the hourly
earnings of staff, and we have presented the proportion of male and female employees in each
group.
Figure 10: Hourly pay bands and gender
12
‘Icons made by CC3.0 BY/Flat Icon from www.flaticon.com’Hourly Pay by Job Category
Figure 11: Hourly income by job category
Further details are available in Table 14: Gender Pay Gaps by job category, page 21.
13
‘Icons made by CC3.0 BY/Flat Icon from www.flaticon.com’5. Statutory Gender Pay Gap Report
The Statutory Pay Gap calculation includes all full time relevant employees in March 2017, after
Salary Sacrifice deductions have been made. In addition to the statutory reporting requirements, we
have completed further analysis in order to help determine the causes of the gender pay gap.
Ordinary Pay, which the mean and median is calculated from, is a calculation of the hourly income
of an employee composed of their basic pay, allowances, shift premium pay, and any pay for
piecework. Ordinary Pay is calculated from monies received in March 2017.
Bonus Pay is any form of money, vouchers, securities, securities options, or interests received by an
employee which is awarded as a result of profit sharing arrangements, productivity, performance,
incentives or commission. Bonus Pay is calculated from monies received in the 12 months leading up
to March 2017.
Where a pay gap number is a positive figure and black, this means that there is a pay gap in favour
of men, where a number is a negative figure and red, this means that there is a pay gap in favour of
women.
5.1. Statutory Gender Pay Gap
6817 Full Pay Relevant Employees are included in the Statutory Gender Pay Gap calculation, of which
3783 (55.5%) are female, and 3034 (44.5%) are male.
Table 2: Statutory Gender Pay Gap data
#F #M Statutory
Pay Gap
i. Mean Hourly Gender Pay Gap 3783 3034 24.57%
ii. Median Hourly Gender Pay Gap 3783 3034 19.00%
iii. Mean Bonus Pay Gender Pay Gap 49 61 76.16%
iv. Median Bonus Pay Gender Pay Gap 49 61 89.95%
v. Proportion of staff in receipt of Bonus Pay:
a. Proportion of Female staff in receipt of bonus pay 1.30%
b. Proportion of Male staff in receipt of bonus pay 2.01%
c. Proportion of staff in receipt of bonus pay who are Female 44.5%
d. Proportion of staff in receipt of bonus pay who are Male 55.5%
14
‘Icons made by CC3.0 BY/Flat Icon from www.flaticon.com’Table 3: Mean and Median hourly income and annual bonus income
Hourly ££
Mean Hourly Pay Rate Male £22.75
Female £17.16
Median Hourly Pay Rate Male £18.68
Female £15.13
Mean Annual Bonus Pay Male £24,613
Female £5,867
Median Annual Bonus Pay Male £14,930
Female £1,500
vi. Proportion of staff on quartile pay bands
The proportion of male and female full pay relevant employees in the lower, lower middle, upper
middle and upper quartile pay bands:
Table 4: Quartile population
# Female # Male Female Male Female Male
↕ ↕ ↔ ↔
Q1 Lower 1220 484 32.25% 15.95% 71.60% 28.40%
Q2 Lower Middle 1096 608 28.97% 20.04% 64.32% 35.68%
Q3 Upper Middle 815 889 21.54% 29.30% 47.82% 52.18%
Q4 Upper 652 1053 17.24% 34.71% 38.24% 61.76%
We have also analysed the Gender Pay Gap and the hourly income levels for each of these quartiles:
Table 5: Hourly income and Gender Pay Gaps by quartiles
Hourly ££ Statutory
Pay Gap
Mean Q1 Lower Male £9.88 0.63%
Female £9.82
Q2 Lower Middle Male £14.99 2.25%
Female £14.65
Q3 Upper Middle Male £18.97 -0.33%
Female £19.03
Q4 Upper Male £36.33 9.82%
Female £32.76
15
‘Icons made by CC3.0 BY/Flat Icon from www.flaticon.com’Hourly ££ Statutory
Pay Gap
Median Q1 Lower Male £9.36 1.22%
Female £9.25
Q2 Lower Middle Male £15.13 5.26%
Female £14.33
Q3 Upper Middle Male £18.68 -1.46%
Female £18.95
Q4 Upper Male £32.33 10.89
Female £28.81
5.1.1. Understanding Bonus Pay
Bonus Pay is defined as any form of money, vouchers, securities, securities options, or interests
received by an employee which is awarded as a result of profit sharing arrangements, productivity,
performance, incentives or commission.
It includes all forms of bonus received in the 12 month period prior the statutory snap shot date (1st
April 2016 to 31st March 2017).
The University has 3 categories of bonus what are included in this analysis:
1) A contractual bonus
2) An Exceptional Performance Award (EPA)
3) A Clinical Excellence Award (CEA).
110 employees received a bonus payment between the 1st April 2016 and the 31st March 2017. 44%
were Exceptional Performance Awards, 49.5% were Clinical Excellence Awards, and the remaining
6.5% were contractual bonuses awarded to senior managers.
• Exceptional Performance Awards
An Exceptional Performance Award is a one-off, non-consolidated payment of £1500 in recognition
of exceptional performance that is not normally expected to be sustained for more than a year. An
EPA is open to all members of staff and applications are made during the Annual Review process.
Table 6 outlines who received the EPA in the 2016 Annual Review process:
Table 6: Recipients of Exceptional Perforance Awards
Female Male Total %F↔ %F↕
CPS 24 7 31 77.4 70.6
FHLS 7 1 8 87.5 20.6
FHSS 3 3 6 50 8.8
FS&E 0 3 3 0 0
34 14 48 70.8
Clerical 12 3 15 80 31.3
Clinical 1 0 1 100 2.1
16
‘Icons made by CC3.0 BY/Flat Icon from www.flaticon.com’Manual 0 0 0 0 0
PMSA 19 6 25 76 52.1
Research 0 0 0 0 0
T&R 0 2 2 0 4.2
T&S 0 0 0 0 0
Technical 2 3 5 40 10.4
Full Time 28 14 42 58.3 87.5
Part Time 6 0 6 100 12.5
Fixed Term 3 1 4 75 8.3
Permanent 31 13 44 70.5 91.7
Grade 4 4 0 4 100 8.3
Grade 5 4 3 7 57.1 14.6
Grade 6 9 3 12 75 25
Grade 7 6 3 9 66.7 18.8
Grade 8 8 5 13 61.5 27.1
Grade 9 1 0 1 100 2.1
Clinical 1 0 1 100 2.1
Of the 48 employees who received an EPA in 2016/2017, 71% were female employees. The majority
of recipients were Clerical or PMSA staff, largely in the Central Professional Services. They were
more likely to be on permanent contract and work full time in grades 6, 7 or 8.
No Manual, Research or T&S staff received an EPA in 2016/2017 nor any staff on grades 1, 2 or 3.
• Clinical Excellence Awards
The Clinical Excellence Awards (CEA) scheme is a NHS reward programme which is intended to
recognise and reward consultants who contribute most towards the delivery of safe and high quality
care to patients and to the continuous improvement of NHS services. This includes those consultants
and senior academic GPs who do so through their contribution to academic medicine. CEA levels
range from £3,016 at Level 1 to £77,320 at Level 12 (Platinum). Awards can be made for both local
and national contributions to the NHS3.
Clinicians apply for the award through the relevant NHS processes however, the University
administers the payment of the award through our payroll.
Legal advice provided by UCEA in January 2018 advised that CEA should be classed as a bonus
payment by the University in the Statutory Gender Pay Gap calculations, although there has been
some disagreement within the sector whether these payments should be included by universities at
all. Until further advice is received CEA’s will be included in our figures.
Not all clinical staff will be eligible for a CEA, only those that are consultants. The proportion of
clinical staff in receipt of a CEA is:
3
See: https://www.bma.org.uk/advice/employment/pay/clinical-excellence-awards-for-nhs-consultants
17
‘Icons made by CC3.0 BY/Flat Icon from www.flaticon.com’Table 7: Recipients of Clinical Excellence Awards
Clinical Staff Received CEA % Received CEA %F/M↕
Female 119 11 9.2% 20%
Male 145 44 30.4% 80%
All 264 55 20.1% 100%
The CEA’s range from £3K to £77K per year, and the mean and median annual value just of CEA staff
are (see: Table 3, page 15 for all bonus pay amounts):
Table 8: Mean and median annual Clinical Excellence Awards pay
££ Annual
Mean Annual CEA Bonus Pay Male £33,346
Female £18,805
Median Annual CEA Bonus Rate Male £35,832
Female £11,944
The CEA are considerable sums which have a significant impact on the University’s Bonus Pay Gaps.
The pay gaps just for those receiving a CEA is:
Table 9: Bonus pay gaps for those in receipt of CEA only
#F #M Pay Gap
i. Mean Bonus Pay Gender Pay Gap 11 44 43.6%
ii. Median Bonus Pay Gender Pay Gap 11 44 66.7%
However, if we omit the CEA from the Bonus calculation, the pay gaps would be:
Table 10: Bonus pay gaps (excluding CEA)
#F #M Pay Gap
i. Mean Bonus Pay Gender Pay Gap 38 17 -5.52%
ii. Median Bonus Pay Gender Pay Gap 38 17 0.00%
18
‘Icons made by CC3.0 BY/Flat Icon from www.flaticon.com’5.2. Gender Pay Gap – Excluding Casual Staff
In order to help us understand the causes of the Gender Pay Gap, we have completed an additional
assessment which has excluded the 779 Casual Employees from the assessment. This assists in
pinpointing more precisely areas that may be disproportionately adding to the Gender Pay Gap.
Of the remaining 6038 staff 3285 (54.4%) were female and 2753 (45.6%) were male:
Table 11: Gender Pay Gap (excluding casuals)
#F #M Statutory
Pay Gap
i. Mean Hourly Gender Pay Gap 3285 2753 24.22%
ii. Median Hourly Gender Pay Gap 3285 2753 17.09%
iii. Mean Bonus Pay Gender Pay Gap 49 61 76.16%
iv. Median Bonus Pay Gender Pay Gap 49 61 89.95%
v. Proportion of staff in receipt of Bonus Pay:
a. Proportion of Female staff in receipt of bonus pay 1.5%
b. Proportion of Male staff in receipt of bonus pay 2.2%
c. Proportion of staff in receipt of bonus pay who are Female 44.5%
d. Proportion of staff in receipt of bonus pay who are Male 55.5%
Excluding the Casual staff has had only a marginal improvement on the Mean Pay Gap reducing it
from 24.57% to 24.22%; however there is a larger decrease in the Median Pay Gap from 19.00% to
17.09%.
i. Proportion of staff on quartile pay bands
Removing the Casual staff results in a lower proportion of female staff being in Quarter 2 and
Quarter 4 with a corresponding increase in the proportion of men in those areas:
Table 12: Quartile population (excluding casuals)
#F #M Female Male Female Male F
↕ ↕ ↔ ↔ Change
Q1 Lower 1085 424 33.03% 15.40% 71.90% 28.10% ↑
Q2 Lower Middle 916 594 27.88% 21.58% 60.66% 39.34% ↓
Q3 Upper Middle 734 775 22.34% 28.15% 48.64% 51.36% ↑
Q4 Upper 550 960 16.74% 34.87% 36.42% 63.58% ↓
19
‘Icons made by CC3.0 BY/Flat Icon from www.flaticon.com’6. Causes of the Gender Pay Gap
The University of Liverpool has an overall Mean Pay Gap of 24.57% and a Median Pay Gap of 19.00%.
However, when analysed at grade level:
Mean:
< 1% Pay Gap on Grades 1, 2, 8
The largest mean pay gaps exist for Clinical staff at 21.19% who are paid according to NHS pay scales
which the University has no control over.
Median
Research, Research and Clinical roles. See Figure 4: Contract type and gender and Table 14:
            Gender Pay Gaps by job category.

  iii.      There is a higher proportion of men in Academic roles which have a defined promotion
            route compared to Professional Services roles where women are concentrated, which does
            not have a defined promotion route. As there is no notional maximum on the number of
            senior academic positions, the promotion route enables a larger proportion of men to
            progress up the pay scales than women, coupled with the relatively fixed number of senior
            professional services positions which do not provide the same number of opportunities for
            female advancement.

  iv.       The effects of the ‘leaky pipeline’ of female progression in academia, in particular in Science,
            Technology, Engineering and Maths (STEM) resulting in a large gender imbalance across the
            Faculty of Science and Engineering.

   v.       The University has retained its own student accommodation, cleaning services,
            maintenance, and catering departments which means that the University has a relatively
            large population of staff on grades 1 to 3, which are predominantly female and working part
            time.

  vi.       A broader cultural impact on the Gender Pay Gap is the uptake of family leave by male
            members of staff and the subsequent decisions to take up flexible working arrangements
            and/or reduce hours to part time. Women are predominantly the primary carer for children
            and dependants which can, over the course of a career, reduce the opportunities for
            progression or place other limits on gaining the relevant experience for promotion. To
            combat this requires cultural change across the organisation and the sector overall.

A number of these points can be illustrated using the following infographic. Here we have re-
calculated the Mean and Median Gender Pay Gaps by removing different data sets from the
calculation. This has been done by excluding certain groups to explore which ones might be having a
disproportionate impact. The calculation has been done by excluding:

        •         Clinical staff
        •         Casual staff
        •         Clinical and Casual staff
        •         Grade 1 staff
        •         Grade 10 staff
        •         Grade 10 and Clinical staff

The infographic compares the results against the UK National Mean and Median Gender Pay Gaps.
What this demonstrates is that is the gender imbalance within our grade structure is significantly
influencing the Gender Pay Gap. When grade 10 staff and Clinical staff for example are removed, the
Mean Pay Gap drops from 24.57% to 16.88% and the Median drops from 19.00% to 17.60%:

Figure 12: Pay gap analysis by excluding defined categories

                                                                                                          22
‘Icons made by CC3.0 BY/Flat Icon from www.flaticon.com’
23 ‘Icons made by CC3.0 BY/Flat Icon from www.flaticon.com’
7. Staff Satisfaction Survey

Figure 13: Staff Survey results

To help understand the broader context of the Gender Pay Gap, the results of the Staff Satisfaction Survey completed in 2010, 2013 and 2016 have been
reviewed, specifically questions relating to pay and reward, work life balance, and intention to leave the University.

                                                                                                                                                        24
‘Icons made by CC3.0 BY/Flat Icon from www.flaticon.com’
The results are inclusive of all “Tend to Agree” and “Agree” responses for each of the questions.
Pay and Reward
i. Overall we have high satisfaction rates with the University’s pay and benefits package, with
female employees more likely to be satisfied than male employees.
ii. There has been an increase in satisfaction on both of these measures between 2013 and
2016 for both men and women, however, the trend has remained flat since 2010.
Work-life Balance
iii. Staff satisfaction with the support provided by the University to help balance work and
personal commitments has increased year on year with female employees showing a 15
point increase from 2010 and male employees a 12 point increase. Female employees
overall are more likely than their male colleagues to be satisfied with this support.
iv. In terms of employee’s perception of their actual work-life balance, once again female
employees are more likely to be satisfied than their male colleagues and the improvement in
this area is not as pronounced as with the previous question. However, a majority of staff do
believe that they have a good work-life balance.
Intention to leave the University
v. Although there are numerous reasons why members of staff may be considering leaving the
University, their pay, benefits, work-life balance, promotion opportunities and career
development may all play a part.
vi. Staff turnover provides opportunities and challenges to address the Gender Pay Gap,
potentially opening up senior posts previously occupied by men to women, but also the risk
of losing those women that are already in senior positions.
vii. The results from the survey show that a significant proportion of both male and female
employees consider leaving the organisation, though a lower proportion of women
compared to men; and that a large number of staff are actively looking for new employment
opportunities, though once again there being a smaller proportion of women doing so
compared to men.
25
‘Icons made by CC3.0 BY/Flat Icon from www.flaticon.com’8. Initiatives helping us to address our Gender Pay Gap
The University has been working to promote gender equality across the organisation for a number of
years. This has included the following initiatives and activities:
8.1. Athena SWAN
The University joined the Athena SWAN Gender Equality Charter in 2009. In 2010 and 2013 the
University was recognised by the Equality Challenge Unit with Athena SWAN Bronze University
status.
Since 2013 the University has developed and strengthened its commitment to address gender
equality for staff and students and was awarded Silver University status in 2016. A significant
amount of work as taken place at School/Institute level since 2013, and now 10 Schools/Institutes
have their own Athena SWAN awards including a Gold for the Institute of Integrative Biology4.
Figure 14: Athena SWAN awards
Work is currently ongoing in Schools in the Faculty of Humanities and Social Sciences who are
working to achieve Bronze awards. The University is aiming to achieve Institutional Gold by 2020.
Although Athena SWAN awards are only available to academic departments, Professional Services
staff set up a Self-Assessment Team in 2017 to assess the need for and to develop any actions that
might be needed to address gender equality concerns specific to these staff groups. The Deputy Vice
Chancellor is the group’s Professional Services Champion. The group will develop actions by mid-
2018. For further information about our work on Athena SWAN please visit the webpages and
download the Award Submissions.
4
IIB is one of only 10 departments nationally to have achieved a Gold Department award.
26
‘Icons made by CC3.0 BY/Flat Icon from www.flaticon.com’8.2. Family Friendly Employer
The University is working towards being a sector leading family friendly employer. Since 2012 we
have:
i. Introduced a Shared Parental Leave policy with an Occupational Pay entitlement on a par
with our Maternity and Adoption Leave policies
ii. Introduced Surrogacy Leave entitlements on a par with the Adoption Leave entitlement
iii. Introduced paid fertility treatment leave for up to 3 treatment cycles
iv. Extended flexible working requests to all members of staff
v. Extended bereavement leave from 5 days to 10 days for the bereavement of all immediate
family members
vi. Opened 2 Carers’ Car Parks to support parents and carers who are unable to arrive at work
before 8:45am who otherwise would be unable to park on campus
vii. Launched a Parents’ Network and a Carers’ Network to provide a space where staff can
share experiences, network, and raise issues with HR
viii. Tendered for a new provider for the University’s onsite nursery which has extended the
available options to include part time and flexible childcare arrangements, as well as
operating a paid for crèche service for staff working weekend open days
ix. Opened a number of Milk Expression Rooms for staff who are breast feeding after returning
from maternity leave, and introduced a mini-fridge loan system to store the milk.
Our aim is to ensure that the University is a supportive workplace for working families, in particular
women who currently take on the larger proportion of family and caring responsibilities. Our long
term goal is to encourage and support more male staff to take up family leave and flexible working
arrangements.
8.3. Academic Promotion
We have worked to encourage the broadest range of applications for promotion and convert them
to successful outcomes for all qualified staff. Data suggested reticence on the part of women to
apply, and our 2013 staff survey showed concerns about transparency. We sought best practices in
HEIs and beyond, shared emerging views with focus groups and refined our plans:
i. Promotion panel members are representative of the academic workforce
ii. We have a range of career paths reflecting type of academic roles
iii. Career and CV mentoring
iv. Unconscious Bias training for panel members
v. Promotion workshops, led by recently promoted staff and panel members – with some
sessions ring-fenced for women
vi. Communications re-written for clarity for applicants and managers
vii. Feedback for unsuccessful applicants is provided by School/Institute heads and line
managers
viii. On-line resources including case studies linked to career paths and films of successful
candidates, drawn from across the protected characteristics, sharing tips.
27
‘Icons made by CC3.0 BY/Flat Icon from www.flaticon.com’When looking at promotion data we must always take into account that there is a finite applicant
pool at any one time in a position to apply for promotion. Our data shows that there was a peak of
applications from female staff in 2014 and 2015 resulting in a drop off in 2016. However, overall
work to support staff in applying for promotion has resulted in the following:
ix. From 2012 to 2017 in total there were 144 applications for Senior Lecturer, 47 applications
for Reader, and 50 for a Professorial Chair from female staff. 129 (89.6%), 42 (89.4%) and 45
(90%) applicants respectively were successful, or 90% overall. The overall success rate of
male applications for the same period is 87% (SL), 79% (Reader) and 91% (Chair), or 85%
overall.
x. From 2012 to 2015 there was an increase in the number of female applicants for Senior
Lecturer, and the proportion of applicants who are female increased from 39.3% to 48%.
xi. From 2012 to 2015 there was an increase in the number of female applicants for Reader,
and the proportion of applicants who are female increased from 21% to 44%. The number
and proportion of applicants reduced in 2016 but increased again in 2017.
xii. Since 2012, 45 women were promoted to Professorial level and we have doubled the
proportion of female clinical professors (from 7% to 14%), and appointed our first two
female chairs on the newly developed Teaching and Scholarship pathway.
xiii. In the Faculty of Health and Life Sciences the percent of women with Chairs increased from
25% to 33% and is above the sector benchmark of 25%.
xiv. In 2016, the Faculty of Science and Engineering increased the number of female Professors
from 6 to 9 via the promotions process.
xv. In the Faculty of Humanities and Social Sciences, female professors now make up 32% of
staff (up from 26%) and at grade 9, the proportion of women has increased from 34% to 37%
over this period.
xvi. Currently 25% of Professors are women, an increase from 18% in 2012.
Figure 15: % Female Professors
28
‘Icons made by CC3.0 BY/Flat Icon from www.flaticon.com’Figure 16: Senior Lecturer promotions
Figure 17: Reader promotions
Figure 18: Chair promotions
29
‘Icons made by CC3.0 BY/Flat Icon from www.flaticon.com’8.4. Senior Management
Figure 19: Senior Management and gender
Since 2012 the proportion of women who are members of the University Senior Management5 has
increased from 11 (30.6%) to 19 (40.4%).
Table 15: Senior Management and gender
2012 2017 %2012 %2017
F M F M F F
Vice Chancellor 1 1 - 100%
Deputy Vice Chancellor 1 1 - -
Executive & Pro-Vice Chancellors 1 5 2 4 16.7% 33.3%
Associate Pro-Vice Chancellors - - 4 6 n/a 40%
Professional Services Leadership Team 7 7 8 5 50% 61.5%
School/Institute Deans 3 11 4 12 21.4% 25%
TOTAL 11 25 19 28 30.6% 40.4%
5
Calculation based on those listed in the University Management Structure Organogram.
30
‘Icons made by CC3.0 BY/Flat Icon from www.flaticon.com’8.5. Training and Development
The University has invested in the professional development of female employees through the
female only Aurora Leadership Programme and the Springboard Careers Programme. Additional in-
house development programmes have included the Stepping into Management Programme, the
Level 5 ILM in Leadership & Management, and the University of Liverpool Mentoring Network.
Table 16: Training opportunity uptake by female staff
2013/14 2014/15 2015/16 2016/17 2017/18*
Aurora 9 23 17 23 TBC
Springboard n/a n/a 16 23 TBC
Stepping into Management n/a n/a 14/17 68/100 10/16
87.5% 68% 62.5%
Mentor Training n/a 24/39 17/23 21/32 7/9
61.5% 73.9% 65.6% 77.8%
Mentee Training n/a 23/30 23/26 21/29 8/10
76.7% 88.5% 72.4% 80%
ILM Leadership & n/a n/a n/a 9/13 13/18
Management 69.2% 72.2%
Aurora Aurora aims to help address the under-representation of women in senior posts in
higher education. It is a four day women-only leadership development programme
developed and run by The Leadership Foundation. It brings together leadership
experts and higher education institutions across the country, to take positive action
to address the under-representation of women in leadership positions in the sector.
Since 2013 the University has supported 71 delegates on the Aurora Programme.
Springboard The Springboard Women’s Development programme is designed for women from all
backgrounds, ages and stages of their lives. It allows women to enhance their own
skills and abilities, challenge power and equality, while building confidence,
assertiveness and a positive image. The University has focused particularly on
women in the early or middle stages of their research career.
Since 2015 the University has delivered the programme to 39 delegates.
31
‘Icons made by CC3.0 BY/Flat Icon from www.flaticon.com’Mentoring The University Mentoring Network is available to all staff and enables mentors to
upload a profile so that mentees can browse and then contact potential mentors
with a view to beginning a mentoring relationship.
Training is provided to mentors as well as potential mentees on how to manage and
build successful mentor relationships.
Since 2014, 69 female staff have been trained as mentors and 75 female staff have
attended mentee training. This compares to 26 and 20 men respectively.
8.6. Support Networks and Advice
In addition to the Parents’ Network and the Carers’ Network, in 2013 we launched a Female Early
Career Researcher Network (FECRN) with the aim to provide career related development and
networking opportunities for female researchers and early career academics. In 2014, the Liverpool
Women in Science and Engineering Society (LivWiSE) was launched. The aim of this network is to
promote Science, Engineering, Technology, Maths and Medicine (STEMM) careers, to promote the
achievements of female scientists, and to provide opportunities for female scientists to engage with
the public and network, with the long term aims to help support their career development.
32
‘Icons made by CC3.0 BY/Flat Icon from www.flaticon.com’9. Further Analysis
This report has detailed the Statutory Gender Pay Gap data and presented some additional analysis
at Grade and Job Category level.
In order to understand the reasons behind the gender pay gaps further analysis has been completed
which is not presented in this report. This is available in the Addendum.
Equal Pay Audit
Analysis of Mean and Median Gender Pay Gap by Grade and Increment Point
Analysis of Mean and Median Gender Pay Gap by Job Category, Grade and Increment Point
Equality Groups and Intersectionality
Analysis of Mean and Median:
Disability Pay Gap
Ethnicity Pay Gap
Sexual Orientation Pay Gap
Future Actions
Throughout March and April 2018 we will be consulting with our key stakeholders, asking:
What questions does this data raise?
What further analysis would help us understand the causes of the GPG?
What can we do to improve current initiatives/policies to close the GPG?
What potential new activity could be introduce that would contribute to reducing the GDP?
Staff can contribute to the discussion by sending any suggestion to equality@liverpool.ac.uk or
posting to:
Diversity & Equality Team
Human Resources
Hart Building.
Further Reading
You can review the University’s current commitments to gender equality in the following
documents:
University Athena SWAN Action Plan 2016-2020
https://www.liverpool.ac.uk/hr/diversityandequality/athenaswan/
School and Institute Athena SWAN Action Plans (various)
https://www.liverpool.ac.uk/hr/diversityandequality/athenaswan/
Equality Framework 2016-2026
https://www.liverpool.ac.uk/hr/diversityandequality/policies/
Equality Framework Action Plan 2016-2026
https://www.liverpool.ac.uk/hr/diversityandequality/policies/
33
‘Icons made by CC3.0 BY/Flat Icon from www.flaticon.com’Appendix 1: Calculating the Gender Pay Gap
The Equality Act 2010 (Specific Duties and Public Authorities) Regulations 2017 sets out the
requirements of the University to annually publish its Gender Pay Gap based on a March snapshot
date. This is calculated as follows:
The pay gap is calculated as a percentage of the difference between the average gross
hourly pay of male employees compared to female employees.
An employee is defined as a person who is employed by the University, is a worker
contracted to provide a service, or a self-employed person contracted directly to provide a
service. Workers employed through agencies, or self-employed workers paid via a company
are excluded from the calculation, for example Apprentices.
The Hourly Pay Rate is a calculation which combines the Ordinary Pay and any Bonus Pay
received on the relevant census dates. Ordinary Pay itself is a combination of basic pay,
allowances, pay for piecework, pay for leave, and shift premium pay.
Ordinary pay does not include overtime, redundancy/termination payments, payment in lieu
of leave, or other remunerations that are not money.
Gross pay is calculated after the deduction of salary sacrifice payments such as pension, but
before all other taxes.
Only staff who are considered “full pay relevant employee” are included in the calculation.
Any staff who were not receiving their full hourly pay equivalent because of a reduced
payment, such as statutory maternity or sickness pay, are excluded. Also excluded are staff
who received £0 pay in March but would otherwise be considered full pay relevant
employee e.g. some Zero Hour staff. Clinical staff are included in the calculation.
The calculation is based on posts, and not individual people. Where an individual has 2 or
more contracts or roles, they are included in the calculation as separate data sets.
Before the Gender Pay Gap can be calculated, the hourly rate of pay for each Full Pay Relevant
Employee needs to be calculated first. This is done as follows:
Once the Hourly Rate of Pay for each Full Pay Relevant Employee is known, the Gender Pay Gap can
be calculated as follows:
34
‘Icons made by CC3.0 BY/Flat Icon from www.flaticon.com’When the result is a positive percentage (%) this means that there is a pay gap in favour of men, and
where the result is a negative percentage (-%) this means that there is a pay gap in favour of women,
and the text will be coloured red.
The same formula is used to calculate other pay gaps such as ethnicity or disability by substituting
Male for the Base Group and Female for the Comparator for example White Employees vs Black
Employees.
A full description of how the Hourly Rate of Pay is calculated and the means of the terms outlined
above are included in the Appendices or you can download The Equality Act 2010 (Specific Duties
and Public Authorities) Regulations 2017 which set out how the Pay Gap is calculated.
35
‘Icons made by CC3.0 BY/Flat Icon from www.flaticon.com’Appendix 2: National Benchmark
The Office for National Statistics annually publishes the UK’s Median and Mean Gender Pay Gaps.
This figure is calculated using the income data collected in the Annual Survey of Hours and Earnings
(ASHE).
The Annual Survey of Hours and Earnings (ASHE) is the most detailed and comprehensive source of
earnings information in the UK. ASHE is based on a 1% sample of employee jobs, drawn from HM
Revenue and Customs Pay As You Earn (PAYE) records.
Although the Mean and Median are calculated the ONS use the Median for its headline statistics
when discussing the gender pay gap. The median is the value below which 50% of employees fall.
The median is used because the distribution of earnings is skewed, with more people earning lower
salaries than higher salaries. When using the mean to calculate the average of a skewed distribution,
it is highly influenced by those values at the upper end of the distribution and thus may not be truly
representative of the average earnings of a typical person.
By taking the middle value of the data after sorting in ascending order, the median avoids this issue
and is consequently considered a better indicator of typical “average” earnings.
The ONS publishes the pay gap for All Employees, Full Time Employees, and Part Time Employees. A
Full Time employee is classed as someone working more than 30 paid hours per week (or 25 or more
for the teaching professions).
For benchmark purposes we have used the ‘All Employee’ figures.
The benchmark data has been sourced from the Annual survey of hours and earnings (ASHE) gender
pay gap tables’ and relate to April of the relevant year, e.g. 26th April 2017.
Table 17: UK National Gender Pay Gap benchmarks
Median Mean
All Full Time Part Time All Full Time Part Time
2012 19.6% 9.5% -5.5% 18.6% 14.8% 6.9%
2013 19.8% 10% -5.9% 19.1% 15.7% 4.6%
2014 19.2% 9.6% -5.5% 17.7% 14.2% 3.9%
2015 19.3% 9.6% -6.8% 17.7% 14.1% 2.1%
2016 18.2% 9.4% -6.1% 17.5% 14.1% 5.1%
2017 18.4% 9.1% -5.1% 17.4% 14.1% 5.2%
36
‘Icons made by CC3.0 BY/Flat Icon from www.flaticon.com’You can also read