COPYRIGHT 2018UNIVERSITYOFBUCHAREST PRINTEDINROMANIA.ALLRIGHTSRESERVED
←
→
Page content transcription
If your browser does not render page correctly, please read the page content below
Romanian Biotechnological Letters                                                        Vol. 23, No. 1, 2018
Copyright © 2018 University of Bucharest                             Printed in Romania. All rights reserved
                                                                                         ORIGINAL PAPER

     Sea buckthorn juice, tomato juice and pumpkin oil microcapsules/
  microspheres with health benefit on prostate disease – obtaining process,
                  characterization and testing properties

                                                                       Received for publication, July 21, 2016
                                                                                      Accepted, June 3, 2017

              FLORINA CSERNATONI1,2, RALUCA MARIA POP2,3, FLORINA ROMACIUC1,2,
              FLORINELA FETEA1, OANA POP1, CARMEN SOCACIU1,2*
              1University of Agricultural Sciences and Veterinary Medicine, Cluj-Napoca, Romania
              2Center for Applied Biotechnology CCD-BIODIATECH, Proplanta Cluj-Napoca, Romania
              3University of Medicine and Pharmacy Iuliu Hatieganu Cluj-Napoca, Romania
              *Corresponding author: University of Agricultural Sciences and Veterinary Medicine, 3-5
              Calea Manastur Street, Cluj-Napoca, Romania
              Tel. 0040741115673; Fax: 0040264428800; Email: carmen.socaciu@usamvcluj.ro

Abstract
                The latest studies show that the active principles of tomatoes, sea buckthorn, and pumpkin oil
        have beneficial effects on prostate disease.The purpose of this study was to encapsulate the bioactive
        compounds of seabuckthorn juice, tomato juice and pumpkin oil, to obtain a functional product.
        Microencapsulation was performed using natural polymers such as sodium alginate to provide stability,
        bioavailability and bioactive compounds controlled release.The CaCl2 gelation technique was used to
        obtain microcapsules with or without chitosan coatings like microspheres and mononuclear
        microcapsules. Bioactive compounds in microcapsules, microspheres, and ingredients were analyzed
        using UV-Vis and FT-IR analysis. Total polyphenols and total carotenoids concentration was between
        (40.90-283.75 mgGAE / 100 g sample;9.16-19.71 mg carotenoids/100g sample) in the case of the
        ingredients while total polyphenols and carotenoids content of microcapsules/microspheres was
        between (14.09-133.93mgGAE / 100 g sample;7.13-18.44 mg carotenoids/100g sample).The release
        rate of the microcapsules and microspheres bioactive compounds was done using simulated gastric
        juice and simulated intestinal juice and monitored by UV-Vis spectrometry.Therefore the data obtained
        in this study regarding the phytonutrients presence and their release in the simulated gastric and
        intestinal juice can be further used to investigate their specific role as natural chemoprotective in
        prostate disease.

Keywords: Microencapsulation, seabuckhorn juice, tomato juice, pumpkin oil, UV-Vis, FT-IR,
prostate protection, simulated gastric juice, simulated intestinal juice

1. Introduction
      Microencapsulation is a relatively new technology with large applications in
pharmaceutical, cosmetic, food and medical industry [1-3]. Microencapsulationprovides
product stability, bioavailability and controlled release of active principles [4-5]. Also, it
offers the possibility to include a series of compounds in liquid form or solid form
(enzymes, micro-organisms, flavors, pigments, vitamins, bioactive molecules, cells) [6-7] in
a specific matrix to obtain their protection and stability [8-9]. Thus a barrier is created
between the bioactive principles and the environment [10, 11], providing protection against
external damage factors (e.g. air, humidity, water, light)and their controlled release [12-14].
That is why the three big stages like the incorporation of the bioactive compounds,
preparation and stability research [15] used in microencapsulation are continuously

13214                                    Romanian Biotechnological Letters, Vol. 23, No. 1, 2018
Sea buckthorn juice, tomato juice and pumpkin oil microcapsules/ microspheres with health benefit
            on prostate disease – obtaining process, characterization and testing properties

evolving to ensure their successful applicability. The most common encapsulation methods
used in food and pharmaceutical industry are spray drying technique, microencapsulation by
fluidized bed coating and microencapsulation by ionotropic gelation [3,5], while the most
important polymers are the natural ones such as sodium alginate, chitosan, starch, pectin,
and cellulose. The natural polymers are preferred since they possess low toxicity, constant
texture and taste, are easily dispersible and have good emulsifying properties [16-17]. The
controlled release of active principles in microcapsules is achieved by changing the external
environmental temperature, humidity, pressure or pH [18-19] and is influenced by several
factors: density, crystallinity, plasticity, crosslinking pretreatment, solubility, diameter, shell
thickness, shape, material, temperature, pH, and water activity [20 – 21, 4]. Recent studies
show that tomatoes, sea buckthorn, and pumpkin oil are rich sources of antioxidants like
polyphenols, phenolic derivatives, vitamins, carotenoids, tocopherols, fatty acids and sterols
[22- 25] with anti-tumor and chemoprotective effects in prostate cancer. Thus these natural
chemoprotective sare intensively studied and used in practical usage, mainly due to their
minimal side effects compared to synthetic drugs. That is why tomatoes, sea buckthorn, and
pumpkin oil were considered both suitable materials for microencapsulation and promising
natural chemoprotective to obtain a functional product. Sea buckthorn (Hippophae
rhamnoides) is a complex and rich source of bioactive compounds. Among them, the most
important are fatty acids like palmitic (23-40%), oleic (20-53%) and palmitoleic (11-27%),
sterols with a total content of up to 400 mg/kg fresh weight (FW) [26-27] and carotenoids
with concentrations between 119.9-1424.9 µg/g DW.The most representative carotenoids
lutein, zeaxanthin, β-cryptoxanthin, lycopene, γ-carotene, β-carotene and esterified
carotenoids [28-29, 30]. Other important bioactive molecules are tocochromanols with a
concentration between 4.6-12.4 mg/100g (FW) with α-, β-, γ-, δ- tocopherol and α-, γ-, δ-
tocotrienol as major compounds. The major phenolic derivatives identified in sea buckthorn
are leucocyanidin, catechins, flavonols and flavones trace [31-32] while the most important
vitamins are B complex, vitaminK,A, C, E [33] and minerals like Ca, Mg, Zn, Se [34].
Tomato (Lycopersicum esculentum) is also an important phytonutrients source like
carotenoids (2,6 mg -11,2 mg/100g FW), vitamins, polyphenols, flavonoids and minerals
[35-36]. Lycopene and β-caroteneare the major carotenoids while lycoxanthin,
antheraxanthin, zeaxanthin, lutein, γ-carotene, δ-carotene and phytofluene are minor
carotenoids.Among microelements the highest concentration was in case of K, with an
average value of 2511 mg/100 g, followed by Mg (141 mg/100 g), P (124 mg/100 g), Ca
(60 mg/100 g), Fe (1.39 mg/100 g), Zn (0.97 mg/100 g), Cu (0.57 mg/100 g) and vitamins
C, E and B [36-38]. Pumpkin (Curcubita maxima) is a rich source of fatty acids like
linoleic, oleic, palmitic and stearic acids found between 35.6% to 60.8%, 21% to 46.9%,
9.5% to 14.5% and 3.1% to 7.4%, respectively. Other fatty acids identified in pumpkin oil
are myristic, heptadecanoic, arachidic, eicosenoic and α-linolenic acid. Tocopherols
(between 16.3 - 46.7 mg/100 g), carotenoids and sterols were also identified as important
biomolecules in pumpkin seed oil [39-41]. The major sterols are beta-sitosterol
(24.9±1.4mg/100g), stigmasterol (8.4±0.3 mg/100g) and campesterol. According to recent
studies, sterols are considered essential in the prevention of prostate disease [22, 42, 43].
Therefore, the major aims of this study were to characterize the chemical compounds from
sea buckthorn juice, tomato juice and pumpkin oil with relevant importance in prostate
disease, to encapsulate these bioactive compounds in microcapsules and microspheres with
stable properties and to obtain the active principles controlled release.

Romanian Biotechnological Letters, Vol. 23, No. 1, 2018                                         13215
FLORINA CSERNATONI, RALUCA MARIAPOP, FLORINA ROMACIUC,
FLORINELA FETEA, OANA POP, CARMEN SOCACIU
2. Materials and methods
2.1. Samples and chemicals
The sea buckthorn and tomatoes were purchased from a local market while pumpkin
seed oil (PSO) was purchased from a specialized company. Further sea buckthorn (SBJ) and
tomato juice (TJ) were obtained from fresh fruits, which were crushed and centrifuged at
2500 rpm to separate the seeds and skin. Chitosan and sodium alginate were purchased from
FMC Biopolymer, Norway, while calcium chloride (CaCl2), pepsin, pancreatinin and bile salt
werepurchased from Merck, Germany.
2.2. Preparation of microspheres and microcapsules
The microspheres and microcapsules were obtained using ionotropic gelation technique
with BuchiB 395 PROencapsulator. The obtaining methodology process was specific for both
microcapsules and microspheres. Thus, the microcapsules were obtained using two types of
nozzle: 400 μm for the shell, and 200 μm for the core. The pressure was 293 mbar and the flow
rate 1.42 ml/min. The microspheres were obtained using a 450 μm nozzle and a 635 mbar
pressure. The combination of ingredients used to obtain microcapsules and microspheres are
listed in the next table.
Table 1. The combination of ingredients used to obtain microcapsules and microspheres
Sample name Sea buckthorn Toamato Pumpkin Observations
juice [%] juice [%] seed oil
[%]
P1 100 - - -
INGREDIENTS
P2 95 - 5 -
P3 - 100 - -
P4 - 95 5 -
P5 50 50 - -
P6 50 50 - +5% PSO
P7 - - 100 -
1A - 100 - +5% PSO and
+2 % sodium alginate
MICROSPHERES
1B 100 - - +5% PSO and
+2 % sodium alginate
1C 50 50 - +5% PSO and
+2 % sodium alginate
1C* 50 50 - +5% PSO and
+2 % sodium alginate
- 0.1% chitosan coating
2A - 100 - +2 % sodium alginate in the shell
MICROCAPSULES
+5% PSO in the core
2B 100 - - +2 % sodium alginate in the shell
+5% PSO in the core
2C 50 50 - +2 % sodium alginate in the shell
+5% PSO in the core
2C* 50 50 - +2 % sodium alginate in the shell
+5% PSO in the core
- 0.1% chitosan coating
In case of microcapsules 2C* and microsphere 1C* the chitosan coating of 0.1% was obtained in CaCl2 solution.
13216 Romanian Biotechnological Letters, Vol. 23, No. 1, 2018Sea buckthorn juice, tomato juice and pumpkin oil microcapsules/ microspheres with health benefit
on prostate disease – obtaining process, characterization and testing properties
2.3. Morphology
The microscopic structure of the microspheres and microcapsules was investigated by
optical microscopy (magnification 5X), using a Microscope Carl Zeiss Observer A1, with
AxioVision image processing software.
2.4. Extraction of bioactive compounds from ingredients and microcapsules/
microspheres
In order to extract a wide range of bioactive compounds, two types of extraction were
performed. The first one was the methanolic extraction specific for polar compounds while
the second one was a methanol/ chloroform extraction specific for non-polar.
Methanolic extraction
Aliquots of 2 g of each ingredient (P1-P7), microcapsules (2A, 2B, 2C) and microspheres
(1A, 1B, 1C) were extracted in 10 ml 96%methanol in water, acidulated with 1% hydrochloric
acid. Samples were sonicated for 30 min, centrifuged and filtered using nylon filters (0.2
m).The clear extracts were kept in the freezer until analysis. The methanolic extract was
further analyzed for its total polyphenol content as further described and for their lipids content.
The lipids were evaluated using their maximum absorption spectra at 215 nm.
Chloroformic extraction
Aliquots of 10 g from each ingredient (P1-P7) microcapsules (2A, 2B, 2C) and
microspheres (1A, 1B, 1C) were extracted in a mixture of chloroform:methanol (2:1, v/v).
Samples were sonicated for 1 h and stirred for another 30 min using a magnetic stirrer in dark
conditions. Further samples were centrifuged for 10 min at 2500rpm and 4 o C. The pellet and
supernatant were recovered. Afterwards, the pellet was reextracted twice using the same
procedure. The three supernatants were combined and then separated in a separation funnel
using water to induce phase separation (lower lipophilic phase and upper hydrophilic phase).
The chloroform phase was further kept in the freezer until analysis and analyzed for its total
carotenoids content.
2.5. Total polyphenols and total carotenoids content
Total polyphenols content of methanolic extracts was determined using Folin Ciocalteu
method. The results were expressed as gallic acid equivalents [mg gallic acid / ml extract].
Total carotenoids content was expressed in mg carotenoids per 100 g sample. The calculation
of the concentration was made according to the standardized method [46]. The results
expressed are the average of two determinations.
2.6. FT-IR analysis
Samples were analyzed on a Shimatzu FTIR spectrophotometer using the Horizontal
Attenuated Total Reflection (HATR). The Fourier Transform Infrared spectrum (FTIR) of
each extract was recorded in the MIR region, from 4500 to 1000 cm-1, and then the fingerprint
region was selected for data analysis [44,45].
2.7. UV-VIS analysis
The methanolic extracts of microcapsules/ microspheres, the simulated gastric and
intestinal juice were evaluated spectrophotometrically (200-700 nm) using a Jasco V 530
spectrophotometer. All data were processed with the specific software Shimadzu LC Solution
and Spectra Manager for Windows 95/NT.
2.8. Testing in simulated gastric and intestinal juice
The simulated juices were prepared according to Brinques et al, 2001[47]. Simulated
gastric juices were prepared by suspending pepsin (P7000, 1:10,000) in sterile sodium chloride
solution (0.5%, w/v) to a final concentration of 3 g/ L. The final pH of 2.0 was obtained using
concentrated HCl or NaOH. Simulated intestinal juices were prepared by suspending pancreatin
USP (P-1500) in sterile sodium chloride solution (0.5%, w/v) to a final concentration of 1 g/L
Romanian Biotechnological Letters, Vol. 23, No. 1, 2018 13217FLORINA CSERNATONI, RALUCA MARIAPOP, FLORINA ROMACIUC,
FLORINELA FETEA, OANA POP, CARMEN SOCACIU
with 4.5% bile salts. The final pH of 8.0 was obtained using NaOH.Further, 2 g of
microcapsules/ microspheressamples (1A, 2A, 1B, 2B, 1C, 2C, 1C * 2C *) were suspended in
20 mL simulated gastric juice and incubated at 370Cfor 30 minutes under continuous stirring
(164 RPM). Next, the microcapsules/ microspheres were transferred in 20 ml of simulated
intestinal juice and incubated at 370C for 2 hours under continuous stirring (164 RPM, Heidolph
Unimax Inkubator 1000).
2.9. Principal Component Analysis (PCA)
Advanced chemometrics was applied to discriminate between samples using
Unscrambler X 9.7 Software, (CAMO Software AS, Norway). The general FTIR metabolic
fingerprints represented by the specific IR absorption spectrum zones (1000-3500 cm-1 for
chloroformic samples and 1000-4000cm-1 for methanolic samples) were further analyzed by
principal component analysis (PCA). Spectra were transformed by normalization of the
absorbance spectra to the most intense band.
3. Results and Discussion
3.1. Microcapsules and microspheres morphology
Figure 1 represents the microscopic difference between microspheres and microcapsules.
Microspheres - 1A Microcapsules - 2A
Figure 1. Optical microscopic image of microspheres vs micricapsules
All microspheres (1A, 1B, 1C) were spherical with sizes ranging between 850 and 900
μm as external diameter, while microcapsules(2A, 2B, 2C)sizes ranged between 750 and 800
μm external diameter with a spherical shape and core sizes between 150-180 μm.
3.2. Total polyphenols and total carotenoids content
The next table represents the total polyphenols contents of the ingredients (P1-P7),
microcapsules and microspheres (1A, 1B, 1C, 2A, 2B, 2C).Sample identification was
previously described under materials and methods section.
Table 2. The mean values of total polyphenols content of methanolic sample extracts
Sample [mg GAE/ 100 g sample] Sample [mg GAE/ 100 g sample]
P1 283.75±0.77 1A 17.87±3.00
P2 263.75±0.38 1B 116.96±4.29
P3 46.5±0.7 1C 56.82±28.49
P4 40.90±1.2 2A 12.72±1.93
P5 162.42±0.98 2B 133.93±0.43
P6 138.78±2.1 2C 49.24±11.14
13218 Romanian Biotechnological Letters, Vol. 23, No. 1, 2018Sea buckthorn juice, tomato juice and pumpkin oil microcapsules/ microspheres with health benefit
on prostate disease – obtaining process, characterization and testing properties
The results indicated that total phenolic compound was 6 times higher in sea buckthorn
juice compared with tomato juice. Also, the addition of 5% pumpkin oil decreases the phenolic
compounds concentration with 10-12% for both ingredients and microcapsules/microspheres.
Moreover approximately 50% of total polyphenols are found in microcapsules, while the other
50% is considered waste being found in the pellet remaining after centrifugation and filtration.
Table 3 represents the mean values of total carotenoids content for each ingredient (P1-
P7) and microcapsules/microspheres (1A, 1B, 1C, 2A, 2B, 2C). Sample identification was
previously described under materials and methods 2.2 section.
Table 3. The mean values of total carotenoids contents of chloroformic sample extracts
Sample [mg carotenoids/ 100 g sample] Sample [mg carotenoids/ 100 g sample]
P1 16.39 ± 0.07 1A 18.44±0.22
P2 17.31 ± 3.80 1B 8.09±0.16
P3 19.71 ± 1.21 1C 9.99±0.17
P4 18.76 ± 0.21 2A 18.14±0.85
P5 14.44 ± 0.44 2B 8.14±0.21
P6 9.16 ± 0.03 2C 7.13±0.17
The evaluation of total carotenoids content highlights that tomato juice and
seabuckthorn juice are the richest sources of carotenoids among samples. Also the addition of
5% PSO does not significantly influence the amount of total carotenoids.The best carotenoid
extraction was achieved from individual samples (TJ or SBJ) and not from mixed samples (TJ
+ SBJ with or withoutPSO), suggesting that extraction efficiency decreased when mixtures
where used for similar extractions.The microcapsules/microspheres(1A, 2A, 1C, 2C)
extraction efficiency was higher than 90%, while the microcapsules/microspheres (1B, 2B)
extraction efficiency was approximately 50%.
3.3. Comparative FT-IR general fingerprints of microcapsules and ingredients
Figure 2 represents the comparative FT-IR fingerprints of the microcapsules and their
ingredients extracts: methanolic (Fig.2A) and chloroformic (Fig. 2B). The peaks assignment
of the extracts were done according to literature [44,48].
P 2
1 . 6
3 P
P
4
6
1 . 4
1 P 1 A
1 . 2
2 P 1 B
Absrobance
1 . 0 P 1 C
P 2 A
0 . 8
P 2 B
0 . 6 P 2 C
0 . 4
0 . 2
0 . 0
4 0 0 0 3 5 0 0 3 0 0 0 2 5 0 0 2 0 0 0 1 5 0 0 1 0 0 0
W a v e n u m b e r c m - 1
Figure 2A. FT-IR general fingerprint region (1000-4000cm-1) of sample vs ingredients methanolic extracts
P 2
1 . 4
P 4
1 . 2 1 2 P 6
P 1 A
1 . 0
4 P 1 B
Absrobance
P 1 C
0 . 8
P 2 A
0 . 6 P 2 B
3 P 2 C
0 . 4
0 . 2
0 . 0
3 0 0 0 2 5 0 0 2 0 0 0 1 5 0 0 1 0 0 0
W a v e n u m b e r c m - 1
Figure 2B. FT-IR general fingerprint region (1000-3500cm-1) of sample vs ingredients chloroformic extracts
Romanian Biotechnological Letters, Vol. 23, No. 1, 2018 13219FLORINA CSERNATONI, RALUCA MARIAPOP, FLORINA ROMACIUC,
FLORINELA FETEA, OANA POP, CARMEN SOCACIU
The general fingerprint region (4000-1000 cm-1) of methanolic extracts analysis yielded
the presence of specific functional groups, included in three areas as follows: area 1 (3300-
3600 cm-1) corresponding to stretching vibrations of OH groups from water, alcohols, phenols
with signals at: 3311, 3332, 3356, 3358, 3383, 3385cm-1; area 2 (1600-1750 cm-1),
corresponding to bending vibrations N-H (amino acids), C=O stretchings (aldehydes and
ketones, esters) as well to free fatty acids and glycerides, with signals at: 1627, 1631,1635,1641,
1722, 1724,1732 and 1741cm-1; area 3 (1000-1130 cm-1) characterized by stretching vibrations
C-O of mono- and oligosaccharides, with signals at 1055, 1072, 1074 and 1076cm-1. The
general fingerprint region (3000-1000 cm-1) of chloroformic extracts analysis was divided into
four specific areas as follows: area 1 (2800-2950 cm-1) corresponding to C-H stretching
vibrations specific to CH3 and CH2 from lipids, with signal at: 2920, 2922 and 2924 cm-1; area
2 (1600-1750 cm-1), corresponding to bending vibrations N-H (amino acids), C=O stretchings
(aldehydes and cetones, esters) as well to free fatty acids and glycerides, with signals at:
1743cm-1 and 1745cm-1; area 3 (1300-1500 cm-1) corresponding to stretching vibrations C-O
(amide) and C-C stretching from phenyl groups, with signals at: 1463cm-1; area 4 (1150-1270
cm-1) corresponding to stretching vibrations of carbonyl C-O or O-H bendings with signals at:
1157, 1159, 1161, 1163 and 1165cm-1.
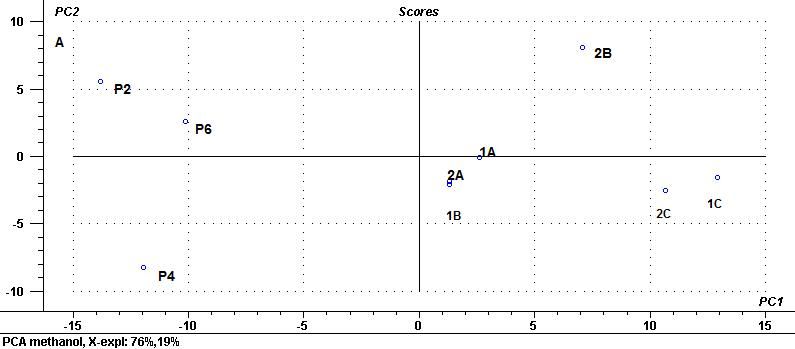
3.4. Principal Component Analysis (PCA)
The normalized FTIR spectra were used in the PCA analysis for both methanolic (Fig. 3A)
and chloroformic (Fig. 3B) sample extracts. The first two principal components (PCs) explained
95% (PC1 with 76% and PC2 with 19%) and 99% (PC1 with 94% and PC2 with 5%) of the
spectra total variance level in case of methanolic and chloroformic samples extract, respectively.
Figure 3. Sample methanolic (A) and chloroformic (B) extracts score plots of the first two principal
components, PC1 and PC2 of the IR general fingerprint region (1000-4000 cm -1)
13220 Romanian Biotechnological Letters, Vol. 23, No. 1, 2018Sea buckthorn juice, tomato juice and pumpkin oil microcapsules/ microspheres with health benefit
on prostate disease – obtaining process, characterization and testing properties
The principal IR bands which characterize the specific absorptions of functional groups
from methanolic extracts were identified in the score loadings plots (data not shown). Thus
the wavelengths that influenced sample grouping P2, P6, P4 located along the PC2 axis and
in the negative PC1 axis(Fig. 3A) ranged from 1020 to 1080 cm-1. The major identified
signals1055, 1072, 1074 and 1076cm-1corresponded to CO mono- and oligosaccharides bands
vibration. Further the group represented by sample 2B is situated at the top of PC2axis and
middle of PC1 axis, the group represented by samples 1B, 1A and 2A is located near the
center of the score plot and the group represented by samples 1C, 2C is placed almost
opposite to P2, P6, P4 samples along the PC1 axis on the right side. The distribution of the
three groups along PC1 and PC2 axes was largely influenced by the wavelength ranging from
1700 to 1732 cm-1in case of group 2B and 3300-3460 cm-1 in the case of group 1C, 2C. The
specific vibration bands identified in the first region corresponded to NH (amino acids),
aldehydes, ketones, esters, fatty acids and glycerides while the specific vibration bands
identified in the second region where the OH vibration bands of water, alcohol or phenol
compounds with major signals at 3311, 3332, 3356, 3358, 3383, 3385cm-1. In case of
chloroformic extract (Fig. 3B) the PCA score plot indicated the formation of three major
groups as follows: 1B, 1A, 2A group, 1C, 2B, 2C group located in the lower and upper PC2
axis and P2, P4 and P6 group situated opposite to the other two groups on the right end side of
PC1 axis.The wavelengths that influenced the first two groups distribution were represented
by the lipids specific vibration bands like CH, CH3, and CH2 from the two regions: 2700-
2800cm-1 and 2920 cm-1.The wavelengths that influenced the third group ranged between 600
and 1750 cm-1with major signals at 1743cm-1 and 1745cm-1of NH (amino acids), aldehydes,
ketones and esters vibration bands as well as fatty acids and glycerides vibration bands.
3.5. Testing in simulated gastric and intestinal juice
The comparison between extraction efficiency of methanolic extracts with simulated
gastric and intestinal juice are presented in Figure 4 and 5, respectively.
L IP ID S
16 P H E N O L IC A C ID S
14
12
10
Absorbance
8
6
4
2
0
1 A -M 1 A -M G 2 A -M 2 A -M G 1 B -M 1 B -M G 2 B -M 2 B -M G 1 C -M 1 C -M G 2 C -M 2 C - M G 1 C * -M 1 C * - M G 2 C * - M 2 C * - M G
S a m p le s
Figure 4. Comparision of extraction efficiency of metanolic extracts (M) with simulated gastric juice (MG)
P H E N O L IC A C ID S
4 .5 C A R O T E N O ID S
4 .0
3 .5
3 .0
Absrobance
2 .5
2 .0
1 .5
1 .0
0 .5
0 .0
1 A -M 1 A -M I 2 A -M 2 A -M I 1 B -M 1 B -M I 2B M 2 B -M I 1 C -M 1 C -M I 2 C -M 2 C -M I 1 C *-M 1 C *-M I 2 C *-M 2 C *-M I
S a m p le s
Figure 5. Comparison of an extraction efficiency of metanolic (M) extracts with simulated intestinal juice (MI).
Romanian Biotechnological Letters, Vol. 23, No. 1, 2018 13221FLORINA CSERNATONI, RALUCA MARIAPOP, FLORINA ROMACIUC,
FLORINELA FETEA, OANA POP, CARMEN SOCACIU
The UV-VIS spectra recorded for both gastric juice and methanolic extract indicated the
presence of two major classes of compounds like lipids (absorption at 210 nm) and phenolic
acids (absorption at 280 nm). To compare the extraction efficiency the maximum absorbance
values of the extracts were compared in accordance with dilution factor.
In general methanolic extracts had a better extraction yield excepting samples 1A and
2A which had better extraction yield in simulated gastric juice (Fig.4).
In the case of microcapsules/ microspheres tested in the intestinal juice, the UV-VIS
spectra indicated the presence of two major classes of compounds like phenolic acids
(absorption at 280 nm) and carotenoids (absorption at 450 nm). The presence of flavonoids
was also observed (absorption at 340 nm). In case of carotenoids over 50% were released in
intestinal juice 1B, 2B, 1C, 2C, 1C* and 2C* samples, while for 1A and 2A samples only
10% were released in the intestinal juice. This can be explained by the fact that these types of
microcapsules/microspheres were not disintegrated in intestinal juice.
4. Conclusions
The use of ionotropic gelation technique yielded microspheres with sizes between 850-
900μm, with a spherical shape and to microcapsule with peripheral diameter between 750-800
μm and the core between 150-180 μm. Regarding the bioactive compounds content, sea
buckthorn microcapsules had the highest concentration of phenolic compounds while tomato
microcapsules had the highest carotenoid concentration. The FT-IR analysis provided relevant
data which allowed Principal Component Analysis to identify significant differences and
similarities between samples based on the vibration and absorption bands. The evaluation of
microcapsules/microspheres methanolic extraction, gastric and intestinal juice extraction
indicated that the methanolic extract and gastric juice extract were rich in lipids and phenolic
acids while the intestinal juice extract was rich in carotenoids, phenolic acids and traces of
flavonoids.
Acknowledgments. This paper was published under the frame of EU Social Fund -Human
Resources Development Operational Programme, project POSDRU/159/1.5/S/132765.
References
1. EG. DONHOWE, F.KONG. Beta-carotene: Digestion, Microencapsulation, and In Vitro Bioavailability. Food
Bioprocess Technol.,7, 338–354, (2014).
2. F. NAZZARO , O. PIERANGELO , F. FLORINDA, R. COPPOLA . Microencapsulation in food science and
biotechnology. Current Opinion in Biotechnology23,182-186, (2012).
3. NJ. ZUIDAM, E. SHIMONI. Overview of Microencapsulates for Use in Food Products or Processes and
Methods to Make Them. NJ. ZUIDAM, VA. NEDOVIC , eds, Springer New York, 2010, pp. 3-5.
4. VJ. SOVILEJ, JL. MILANOVIC, MJ. KATONA, LB. PETROVIC. Preparation of microcapsules containing
different contents of different kinds of oils by a segregative coacervation method and their characterization.
J. Serb. Chem. Soc.,75 (5), 615–627, (2010).
5. S. DIMA. Microincapsularea sistemelor alimentare. T.FLOREA, S.DIMA, GM. COSTIN, eds, Ed. Academica
Galati, 2009, pp. 2-3.
6. R. SOBEL, R. VERSIC, AG. GAONKAR. Introduction to Microencapsulation and Controlled Delivery in
Foods. Academic Press Elsevier 2014, pp.3-12.
7. K. NARSAIAH, SN. JHA, RA. WILSON, HM. MANDGE, MR. MANIKANTAN. Optimizing
microencapsulation of nisin with sodium alginate and guar gum. J. Food Sci Technol.,51(12), 4054-4059,
(2012).
8. D. ACH, S. BRIANÇON, G. BROZE, F. PUEL, A. RIVOIRE, JM. GALVAN, Y. CHEVALIER. Formation
of Microcapsules by Complex Coacervation. The Canadian Journal of Chemical Engineering,93, 183-191,
(2015).
9. P. ALEXE, C. DIMA. Microencapsulation in food products. AgroLife Scientific Journal3(1), 9-11, (2014).
13222 Romanian Biotechnological Letters, Vol. 23, No. 1, 2018Sea buckthorn juice, tomato juice and pumpkin oil microcapsules/ microspheres with health benefit
on prostate disease – obtaining process, characterization and testing properties
10. N. VASISHT. Selection of Materials for Microencapsulation. Academic Press Elsevier, 2014, pp.173-180.
11. CI. ONWULATA. Microencapsulation and functional bioactive foods. Journal of Food Processing and
Preservation37, 510-532, (2013).
12. MR. EL-AASSAR, E. HAFEZ, NM. EL-DEEB, MG. FOUDA. Microencapsulation of lectin anti-cancer agent
and controlled release by alginate beads, biosafety approach. International Journal of Biological
Macromolecules, 69, 88–94, (2014).
13. YK. LEE, SI. AHN, HS-SKWAK. Optimizing microencapsulation of peanut sprout extract by response surface
methodology. Food Hydrocolloids,30, 307-314, (2013).
14. SY. Yoo, YB. Songb, PC. Changc, HG. Lee. Microencapsulation of α-tocopherol using sodium alginate and its
controlled release properties. International Journal of Biological Macromolecules 38, 25–30, (2006).
15. D. PONCELET, C. DREFFIER. Les methodes de microencapsulation de A a Z (ou presque) in
Microencapsulation. Des sciences aux technologies, T. VANDAMME, D. PONCELET, P. SUBRA-
PATERNAULT, eds, 2007, pp. 23-33.
16. C. WANDREY, A. BARTKOWIAK, SE. HARDING. Materials for Encapsulation. NJ. ZUIDAM, VA.
NEDOVIC , eds, Springer New York, 2010, pp. 31-91.
17. SS. KUANG, JC. OLIVEIRA, AM. CREAN. Microencapsulation as a Tool for Incorporating Bioactive
Ingredients into Food. Critical Reviews in Food Science and Nutrition, 50, 951–968, (2010).
18. J. WEI, XJ. JU, XY. ZOU, R. XIE, W. WANG, YM. LIU, LY. Chu. Multi-Stimuli-Responsive Microcapsules
for Adjustable Controlled-Release. Advanced Functional Materials, 24 (22), 3312–3323, (2014).
19. R. ABDERRAHMEN, C. GAVORY, D. CHAUSSY, S. BRIANC, H. FESSI, MN. BELGACEM. Industrial
pressure sensitive adhesives suitable for physicochemical microencapsulation. International Journal of
Adhesion & Adhesives31, 629–633, (2011).
20. C. DIMA, M. COTÂRLET, P. ALEXE, S. DIMA. Microencapsulation of essential oil of pimento [Pimenta
dioica (L) Merr.] by chitosan/k-carrageenan complex coacervation method. Innovative Food Science &
Emerging Technologies, 22, 203-211, (2014).
21. T. FLOREA, S. DIMA. Eliberarea substantei active din microcapsule. T.FLOREA, S.DIMA, GM. COSTIN,
eds, Ed. Academica Galati, 2009, 106-139.
22. J. CHEN, Y. SONG, L. ZHANG. Lycopene/Tomato Consumption and the Risk of Prostate Cancer: A
Systematic Review and Meta-Analysis of Prospective Studies. J Nutr Sci Vitaminol, 59, 213-223, (2013).
23. L. REZIGA, M. CHOUAIBIA, K. MSAADAB, S. HAMDIA. Chemical composition and profile
characterisation of pumpkin (Cucurbita maxima) seed oil, Industrial Crops and Products,37(1), 82-87, (2012).
24. HL. TAN, JM. THOMAS-AHNER, EM. GRAINGERN, L.WAN , DM. FRANCIS, SJ. SCHWARTZ, JW.
JR. ERDMAN, SK. CLINTON. Tomato-based food products for prostate cancer prevention: what have we
learned? Cancer Metastasis Rev.,29, 553–568, (2010).
25. D. BOIVIN, M. BLANCHETTE, S. BARRETTE, A. MOGHRABI, R. BELIVEAU. Inhibition of cancer cell
proliferation and suppresion of TNF-induced Activation of NFkB by edible berry juice, Anticancer Research,
27, 937-948, (2007).
26. B. YANG, H. KALLIO. Lipophilic Components of Seabuckthorn (Hippophae rhamnoides L.) Seeds and
Berries, in: Seabuckthorn (Hippophae L), A Multipurpose Wonder Plant, ed. V.Singh, vol.11,2009, pp. 70-97.
27. FV. DULF, ML. UNGURESAN, DC. VODNAR , C. SOCACIU. Free and Esterified Sterol Distribution in
Four Romanian Vegetable Oil , Not. Bot. Hort. Agrobot.,38 (2), 9-13, (2010).
28. RM. POP, Y. WEESEPOEL, C. SOCACIU, A. PINTEA, JP. VINCKEN, H. GRUPPEN. Carotenoid
composition of berries and leavesfrom six Romanian sea buckthorn (Hippophae rhamnoides L.) varieties. Food
Chemistry147,1-9, (2013).
29. C. SOCACIU, C. MIHIS, A. NOKE. Oleosome Fractions Separated From Sea Buckthorn Berries: Yield And
Stability Studies. in : Seabuckthorn, A Multipurpose Wonder Plant, ed. V.Singh, vol.III, Indus International,
India, 2007, pp. 322-326.
30. SC. ANDERSSON, ME. OLSSON, E JOHANSSON, K. RUMPUNEN.Carotenoids in Sea Buckthorn
(Hippophae rhamnoides L.) Berries during Ripening and Use of Pheophytin a as a Maturity Marker. J. Agric.
Food Chem, 57(1), 250-258, (2009).
31. RM. POP, C. SOCACIU, A. PINTEA, A.D. BUZOIANU, M.G. SANDERS, H. GRUPPEN, JP. VINCKEN.
UHPLC/PDA-ESI/MS Analysis ofthe Main Berry and Leaf Flavonol Glycosides from Different Carpathian
Hippophae rhamnoides L. Varieties. Phytochemical Analysis, 24(5), 484-492, (2013).
32. KS. UPENDRA, K. SHARMA, N. SHARMA, A. HARMA, H. P. SINGH, A. K. SINHA. Microwave-
Assisted Efficient Extraction of Different Parts of Hippophae rhamnoides for the Comparative Evaluation of
Antioxidant Activity and Quantification of Its Phenolic Constituents by Reverse-Phase High-Performance
Liquid hromatography (RP-HPLC). J. Agric. Food Chem.,56, 374-379, (2008).
Romanian Biotechnological Letters, Vol. 23, No. 1, 2018 13223FLORINA CSERNATONI, RALUCA MARIAPOP, FLORINA ROMACIUC,
FLORINELA FETEA, OANA POP, CARMEN SOCACIU
33. YA. JAMYANSAN, D. BADGAA. Bioactive Substances of Mongolian Seabuckthorn Hippophae rhamnoides
L.) in : Seabuckthorn (Hippophae L), A Multipurpose Wonder Plant, ed. V. Singh, vol. II, 2005, pp. 145-150.
34. I. BRAD, GA.VLASCEANU, IL. BRAD, ST. MANEA. Characterisation of seabuckthorn fruits and copses in
terms of serotonin and microelements, Innovative Romanian Food Biotechnology,1, 23-29, (2007).
35. P. KAVITHA, KS. SHIVASHANKARA, VK. RAO, AT. SADASHIVA, KV. RAVISHANKAR,
GJ. SATHISH. Genotypic variability for antioxidant and quality parameters among tomato cultivars, hybrids,
cherry tomatoes and wild species, Jurnal of the Science of Food and Agriculture, 94(5), 993-999, (2014).
36. PG. ACOSTA-QUEZADAA, MD. RAIGÓNB, T. RIOFRÍO-CUENCAA, MD. GARCÍA-MARTÍNEZB, M.
PLAZASC, JI BURNEOA,JG. FIGUEROAA, S. VILANOVAC, J. PROHENSC. Diversity for chemical
composition in a collection of different varietal types of tree tomato (Solanum betaceum Cav.), an Andean
exotic fruit. Food Chemistry, 169, 327–335, (2015).
37. J. LOPEZ-CERVANTES, DI. SANCHEZ-MACHADO, KP. VALENZUELA-SANCHEZ, JA. NUNEZ-
GASTELUM, AA. ESCARCEGA-GALAZ, R. RODRIGUEZ-RAMIREZ. Effect of solvents and methods of
stirring in extraction of lycopene, oleoresin and fatty acids from over-ripe tomato, International Journal
of Food Science and Nutrition,65(2), 187-193, (2014).
38. G. KUMAR RAI, R. KUMAR, AK. SINGH, PK. RAI, M. RAI, AK. CHATURVEDI, AB. RAI. Changes in
antioxidant and phytochemical properties of tomato (LYCOPERSICON ESCULENTUM MILL.) under
anbient condition. Pak. J. Bot.,44(2), 667-670, (2012).
39. MIY. KIM, EJ. KIM, YN. KIM, C. CHOI, BH. LEE.Comparison of the chemical compositions and nutritive
values of various pumpkin (Cucurbitaceae) species and parts, Nutrition Research and Practice, 6(1), 21-27,
(2012).
40. MA. ALFAWAZ. Chemical composition and oil characteristics of pumpkin (Curcubita maxima) seed kernels,
Res. Bult., Food Sci & Agric. Res. Center, 129, 5-18, (2004).
41. A. NAWIRSKA-OLSZAŃSKA, A. KITA, A. BIESIADA, A. SOKÓŁ-ŁĘTOWSKA, AZ. KUCHARSKA.
Characteristics of antioxidant activity and composition of pumpkin seed oils in 12 cultivars. Food Chemistry,
139 (1-4), 155–161, (2013).
42. M. SRBINOSKA, N. HRABOVSKI, V. RAFAJLOVSKA, S. SINADINOVIC-FISER. Caracterization of the
seed and seed extraction of the pumpkins Curcubita maxima D. and Curcubita pepo L. from Macedonia,
Macedonian Journal of Chemestry and Chemical engineering,31(1), 65-78, (2012).
43. E. RYAN, K. GALVIN, TP. O’CONNOR, AR. MAGUIRE, NM. O’BRIEN. Phytosterol, Squalene,
Tocopherol Content and Fatty Acid Profile of Selected Seeds, Grains, and Legumes. Plant Foods Hum Nutr.62,
85–91, (2007).
44. S. ZAVOI, F. FETEA, F. RANGA, R.M. POP, A. BACIU, C. SOCACIU. ComparativeFingerprint and
Extraction Yield of Medicinal Herb Phenolics with Hepatoprotective Potential, asDetermined by UV-Vis
and FT-MIR Spectroscopy. Not Bot Horti Agrobo.,39(2), 82-89, (2011).
45. S. GORINSTEIN, P. ARANCIBIA-AVILA, F. TOLEDO, J. NAMIESNIK, H. LEONTOWICZ, M.
LEONTOWICZ, KS. HAM, SG. KANG, K. VEARASILP, M. SUHAJ. Application of Analytical Methods for
the Determination of Bioactive Compounds in some Berries. Food Anal. Methods, 6, 432-444, (2013).
46. G. BRITTON, S. LIAAEN-JENSEN, H. PFANDER, eds. (1995). Carotenoids, vol. 1B: spectroscopy,
Birkhauser Verlag, 1995, pp. 50-151.
47. GB. BRINQUES, MAZ. AYUB. Effect of microencapsulation on survival of Lactobacillus plantarum in
simulatedgastrointestinal conditions, refrigeration, and yogurt.Journal of Food Engineering, 103, 123–128,
(2011).
48. M. SAYMANSKA-CHARGOT, A. ZDUNEK. Use of FT-IR Spectra and PCA to the Bulk Characterization of
Cell Wall Residues of Fruits and Vegetables Along a Fraction Process, Food Biophysics8, 29–42, (2013).
13224 Romanian Biotechnological Letters, Vol. 23, No. 1, 2018You can also read