Full Year 2020 Results Briefing - February 26, 2021 - Olam International

Page created by Joel Alvarado
 
CONTINUE READING
Full Year 2020 Results Briefing - February 26, 2021 - Olam International
Full Year 2020
Results Briefing
February 26, 2021
Full Year 2020 Results Briefing - February 26, 2021 - Olam International
Presenters

                   Sunny Verghese                                                               A. Shekhar          N. Muthukumar
            Co-Founder and Group CEO                                                           Executive Director     Group CFO
                                                                                                  CEO, OFI

Olam International Limited Results for Full Year ended December 31, 2020 | February 26, 2021                                        2
Full Year 2020 Results Briefing - February 26, 2021 - Olam International
Notice
This presentation should be read in conjunction with Olam International Limited’s Financial Statements and
Management Discussion and Analysis for the Full Year ended December 31, 2020 (“2020”) and its
announcement entitled “Re-organisation of Olam: Unlocking Long Term Value” lodged on SGXNET on
February 26, 2021.

Olam International Limited Results for Full Year ended December 31, 2020 | February 26, 2021                 3
Full Year 2020 Results Briefing - February 26, 2021 - Olam International
Cautionary note
on forward-looking statements
 • This presentation and announcement entitled “Re-organisation of Olam: Unlocking Long Term Value” may
   contain statements regarding the business of Olam International Limited and its subsidiaries (‘Group’) that
   are of a forward-looking nature and are therefore based on management’s assumptions about future
   developments.
 • Such forward looking statements are intended to be identified by words such as ‘believe’, ‘estimate’,
   ‘intend’, ‘may’, ‘will’, ‘expect’, and ‘project’, and similar expressions as they relate to the Group. Forward-
   looking statements involve certain risks and uncertainties because they relate to future events. Actual
   results may vary materially from those targeted, expected or projected due to several factors.
 • Potential risks and uncertainties includes such factors as general economic conditions, foreign exchange
   fluctuations, interest rate changes, commodity price fluctuations and regulatory developments. Such factors
   that may affect Olam’s future financial results are detailed in our listing prospectus, offering circulars,
   information memorandums, information listed in this presentation, or discussed in today’s news release and
   in the Management Discussion and Analysis section of the Company’s Full Year ended December 31, 2020
   results report and filings on SGXNET. The reader and/or listener is cautioned to not unduly rely on these
   forward-looking statements. We do not undertake any duty to publish any update or revision of any forward-
   looking statements.

Olam International Limited Results for Full Year ended December 31, 2020 | February 26, 2021                         4
Full Year 2020 Results Briefing - February 26, 2021 - Olam International
AGENDA
 2020 Group financial highlights

 Covid-19 response and outlook

  Segmental performance by operating groups

 Re-organisation Plan : Progress update

 Key takeaways
Full Year 2020 Results Briefing - February 26, 2021 - Olam International
2020 Group
financial highlights
Full Year 2020 Results Briefing - February 26, 2021 - Olam International
Group 2020 results
At a glance
VOLUME & REVENUE                                                                                 EBIT                                                     PATMI

44.4 M MT                               S$35.8 B                                               S$1,070 M                                                  S$246 M
+11.7% +8.6%                                                                                   +1.2%                                                    -22.3%

              Operational                                                                      Free Cash                                                 Gearing
                PATMI                                                                             Flow

                       S$678 M                                                                   FCFE                                                   from 1.50x to
                  +36.0%                                                                       -$592 M                                                    1.72x
Note: Comparison is made against 2019 financial results which have been restated due to change in accounting policy on account of changes in IFRS 16.

Olam International Limited Results for Full Year ended December 31, 2020 | February 26, 2021                                                                            7
Full Year 2020 Results Briefing - February 26, 2021 - Olam International
Group 2020 financial
                                                                                highlights

                Strong results amid                                                            Healthy balance sheet                     Final Dividend
                Covid-19 challenges                                                             amid rising prices

        36.0% growth in Operational PATMI                                               Strong cash position of S$3.1 billion as   Board of Directors recommends
        in 2020 to S$677.8 million                                                      at end-2020                                final dividend of 4.0 cents per
                                                                                                                                   share, taking total dividend to
        90.1% growth in Operational PATMI                                               Ample liquidity of S$17.3 billion as at    7.5 cents per share (2019: 8.0
        in H2 2020 to S$475.7 million                                                   end-Dec 2020                               cents)

        330 basis points improvement in                                                 Gearing at 1.72x below target of 2.0x;
        Operational ROE in 2020 to 11.2%                                                adjusted gearing net of RMI and
        (2019: 7.9%)                                                                    secured receivables at 0.63x

                                                                                        Continued to access diversified pools of
                                                                                        capital during the year

Olam International Limited Results for Full Year ended December 31, 2020 | February 26, 2021                                                                         8
Full Year 2020 Results Briefing - February 26, 2021 - Olam International
Good progress in implementing Strategic Plan
     •     Strategic investments in OFI to pivot to a more value-added ingredients and solutions business:
           Investments in Spices dehydrates (acquisition), green chile pepper (acquisition), Soluble Coffee
           (greenfield) and Dairy processing (greenfield)

     •     Good execution of OGA strategy to become a leading food, feed and fibre business focused on
           emerging markets with high returns: Acquisition of NSCT in Togo, strategic partnership with Jess
           Smith & Sons, and successful integration of DFM

     •     Successful divestments of our balance 50.0% stake in Indonesian sugar refinery Far East Agri and
           completed the sale of the Mungindi gin in Australia and sugar mill in India, with a net gain from these
           divestments; shut down Olam Tomato Processors in California and restructured NZFSU’s dairy farming
           operations in Uruguay

     •     Post 2020, we sold our entire stake in OCD and the Coffee plantations in Brazil

     •     Success in building new capabilities in sustainability, digitalisation, innovation, private label, food
           service and e-commerce, freight management, which are key building blocks for the key transformation
           of OFI, OGA and Engine 2 businesses
Olam International Limited Results for Full Year ended December 31, 2020 | February 26, 2021                         9
Full Year 2020 Results Briefing - February 26, 2021 - Olam International
Consolidated results by operating groups
2020 at a glance
               Volume ('000 MT)                                                                      Revenue (S$ m)
                                                 2.9%                     8.5%                                           4.9%
                                                                                                                            Volume     35.0%
                                                                                               OIL                         ('000 MT)           OIL
                                                        44,409.7                               OFI
                                                                                                                              35,820
                                                                                                                           20,058.4            OFI
                                                        +11.7%                                 OGA
                                                                                                                              +8.6%
                                                                                                                             +5.0%             OGA
                                88.6%                                                                            60.1%

               EBIT (S$ m)                                                                           IC (S$ m)
                                             (15.3%)
                                                                                                                   22.7%
                                                                                                                                       20.6%
                                                                                               OIL                                             OIL
                                                         1,069.5                               OFI
                                                                                                                           16,665.7            OFI
                                                         +1.2%                                 OGA
                                                                                                                            +5.6%              OGA
                                43.2%
                                                                              72.1%                                56.7%

Olam International Limited Results for Full Year ended December 31, 2020 | February 26, 2021                                                         10
Volume grew 11.7%
Led by OGA’s Food & Feed - Origination & Merchandising segment
           Volume by Operating Groups, '000 MT

                                                                                               +11.7%
                                                                                               4,988

                                                                                                               44,410
                                                                                                        -304
                               39,752

                                                                      -26

                         Restated 2019                                OFI                      OGA      OIL    2020

Olam International Limited Results for Full Year ended December 31, 2020 | February 26, 2021                            11
EBIT steady at S$1.1 billion
Robust growth at OGA; resilient OFI results despite Covid-19
           EBIT by operating groups, S$ million

                                                                                               +1.2%
                                                                                                133

                                                                                                             1,070
                                1,057                                                                  -98

                                                                      -22

                         Restated 2019                                OFI                      OGA     OIL   2020

Olam International Limited Results for Full Year ended December 31, 2020 | February 26, 2021                         12
Operational PATMI grew 36.0%
Reported PATMI declined 22.3% on net exceptional losses
           PATMI and Operational PATMI, S$ million

                                                                                                         -22.3%

                                                                                               124         15

                                                  316                     12

                                                                                                                                      29          246

                                                                                                                       -250

                                          Restated 2019                 EBIT^              Net Finance   Taxation   Exceptional Non-controlling   2020
                                                                                             Costs                    Items       Interests
               Operational
                                                  498                                                    +36.0%                                   678
               PATMI (S$ M)

^ Excludes exceptional items
Olam International Limited Results for Full Year ended December 31, 2020 | February 26, 2021                                                             13
5.6% increase in invested capital
17.1% increase in working capital on higher prices
        Working Capital            Fixed Capital                                                             Net gearing                 Adjusted net gearing
                                                                                                                                                  1.72
                                                                                   16,666                         1.50
                     15,832                                   15,789
                                          14,812

                                                               6,766                7,931
                      7,705                6,844

                                                                                                                                                  0.63
                      8,127                7,968               9,023                8,735
                                                                                                                  0.38

                     Dec-17               Dec-18             Restated             Dec-20
                                                              Dec-19
    EBIT/IC            5.8%                5.5%                 6.9%                6.6%             Restated 31-Dec-19                      31-Dec-20

•    Net Fixed Capital decreased by S$287.8 million as the impairment on OPG                   •   Net gearing increased with higher net debt; remains under 2.0x, with
     and divestitures offset increase from acquisition of NSCT and organic growth                  sufficient headroom for growth
•    Working capital grew by S$1.2 billion arising from acquisitions and organic
     volume growth, higher prices across multiple commodities, as well as impact
                                                                                               Invested Capital excludes:
     of Covid-19 on some commodities and regions, resulting in increased cycle
                                                                                               a) Gabon Fertiliser Project (31 Dec 2020: S$262.6 million; Restated 31 Dec 2019: S$240.7 million);
     time due to shipment delays and reduction in supplier credit.                             b) Long-term Investments (31 Dec 2020: S$24.3 million; Restated 31 Dec 2019: S$71.5 million)
Olam International Limited Results for Full Year ended December 31, 2020 | February 26, 2021                                                                                                 14
Free cash flow
Negative FCFE on increased investments in working capital resulting from higher volumes,
higher commodity prices and lower supplier credit
      Free Cash Flow to Equity, S$ million

                                                                                                         -727
                                                                      241

                                             135

                                                                                                                                     119
                                                                                                                       49                       -592
                                                                                               -1,065
                                                                                                          -71
                                    Restated 2019 Operating Cash Changes in                             Tax Paid     Capex /     Net Interest   2020
                                                   Flow (before Working Capital                                    Investments      Paid
                                                  Interest & Tax)
                 FCFF
                                            691                                                          -846                                   -155
                (S$ M)

Olam International Limited Results for Full Year ended December 31, 2020 | February 26, 2021                                                           15
Ample liquidity
      Total borrowings and available liquidity, S$ Million as at December 31, 2020

                 Short Term              Long Term                                                   7,186       17,291

                                                                                                                                         +3,132
                                                                                                                              14,159

                                                                                          1,139                               6,563
                                                           5,850

                            3,116                                                                                             7,596

                   Cash and Short-                          RMI*                      Secured      Unutilised   Available     Total
                 term Fixed Deposits                                                 Receivables   Bank Lines   Liquidity   Borrowings

      * RMI: Readily marketable inventories that are liquid, hedged and/or sold forward
Olam International Limited Results for Full Year ended December 31, 2020 | February 26, 2021                                                      16
Covid-19 response and
outlook
Covid-19 : Our response
                                                                                     5 PRIORITIES
                                                                                               Primary focus has been to ensure health and safety of our
                                                                                       1
                                                                                               employees and food safety of our customers

                                                                                               Business Continuity Plans continue to be activated in all key
                                                                                       2
                                                                                               countries and sites in Africa, Americas and Asia

                                                                                               To mitigate impact on demand, supply and financial markets, we
                                                                                       3       are already executing several “handbrake” levers across the
                                                                                               Company

                                                                                               A tiered mitigation plan in place to pull additional “handbrake”
                                                                                       4       levers in the event of a second wave, and “break glass” levers
                                                                                               should situation deteriorate
                                                                                               Enhancing stakeholder engagement: We are supporting our
                                                                                               stakeholders, particularly farmers and communities in
                                                                                       5       vulnerable countries, and preparing for evolving our business
                                                                                               model in a post Covid-19 world in consultation with supply chain
                                                                                               partners
Olam International Limited Results for Full Year ended December 31, 2020 | February 26, 2021                 Olam International Limited Results for Full Year ended December 31, 2020 | February 26, 2021   18
Covid-19 relief efforts
 US$7+ million in financial and in-kind donations, benefiting over 11.5 million
 employees, farmers and their families across 33 countries
       Public awareness & community support                                          Medical relief and healthcare
                                                                                     provision

                               Olam Coffee Appeal raised US$349,670 in customer donations to support relief efforts to farming communities in 8 origins during harvest

   •   Radio broadcasts across 30 local stations to 1 million cocoa •              US$600,000 worth of medical supplies to Ministry       •   Food packages donated to farmers and
       farmers across Central and West Africa, plus 1,970 posters                  of Health in Côte d’Ivoire, plus 20,000 testing kits       communities throughout sourcing origins incl. Olam
       and push notifications on WHO guidance                                      in partnership with Temasek Foundation.                    packaged food products to to state governments, local
                                                                                                                                              hospitals and the Nigeria Centre for Disease Control
   •   500+ pastors trained to deliver sensitisation to coffee farmers •           50 ventilators; 24 thermal cameras; 10,000                 (NCDC), freshly baked bread to frontline workers and
       in Papua New Guinea                                                         electronic thermometers; and PPE distributed to            patients in Ghana, 35+tonnes of rice to vulnerable
   •   ~1.4mn farmers reached with health advice via Olam Digital                  partner governments in Africa by ARISE.                    households and key workers in Burkino Faso, , India,
       Supplier Engagement apps in Côte d’Ivoire, Indonesia &                                                                                 Dubai, Myanmar & Vietnam
                                                                              •    US$495k committed by CIB to provide PPE, test
       India
                                                                                   kits and construct quarantine facilities               •   2 months’ supply of food materials (oil, rice, milk,
   •   Communication campaigns in rural communities to                                                                                        sugar, soft drinks, bread & flour) and cleaning materials
       disseminate health advice via calls, texts, recorded                   •    900 hazmat suits, 60,000 masks and 900 face
                                                                                                                                              to Orphanage and Children’s Hospital in Diamniadio,
       announcements and posters                                                   shields were provided for the RSUD Kota
                                                                                                                                              Senegal
                                                                                   Tangerang Hospital in Indonesia

                                                                              •    Swab collection kiosk sponsored for local hospital     •   300+ food hampers for vulnerable households in
                                                                                                                                              Durban, funded by employee and company matched
                                                                                   in India
                                                                                                                                              donations

Olam International Limited Results for Full Year ended December 31, 2020 | February 26, 2021                                                                                                              19
Covid-19 impact and outlook
   •   Despite challenging conditions for many key markets across the world, there has been a pick-up
       in volume and demand due to China’s rapid recovery and many Asian countries which have
       been easing lockdown measures. Substantive fiscal support from governments and monetary
       easing by central banks have contributed to the improving sentiment.

   •   The pandemic has driven higher demand for at-home food consumption globally and
       accelerated shifting consumer patterns such as placing greater emphasis on quality of food
       products that are both safe and healthy. Customers have had to adapt quickly to these rapidly
       changing trends, and are on the lookout to partner innovative, purpose-driven producers and
       suppliers who have the global resources and networks to help them navigate the immediate and
       longer-term challenges in the food and agri-supply chain.

   •   While the short term impact of Covid-19 will continue, the industry is poised for strong recovery
       in the year ahead. Barring unforeseen circumstances such as continued lockdowns across the
       world, the outlook remains positive, aided by growing demand and tight commodity supplies.

   •   With 80-85% of the Group’s revenues in the food category where demand is less sensitive to
       recession or economic downcycles, the Group believes that it will be able to better navigate the
       demand led uncertainties around Covid-19. The Group has been and will remain proactive in
       controlling costs and conserving cash to mitigate against potential adverse impact from the
       Covid-19 crisis. It continues to monitor and assess this impact on a dynamic basis and will
       provide updates as material developments and impacts arise.

   •   Market conditions and sentiments are beginning to improve as economies snap back
       from the worst impacts of Covid-19 in 2020 and we expect this favourable market
       environment to continue to improve in 2021.
                                         Olam International Limited Results for Full Year ended December 31, 2020 | February 26, 2021   20
Segmental performance
by operating groups
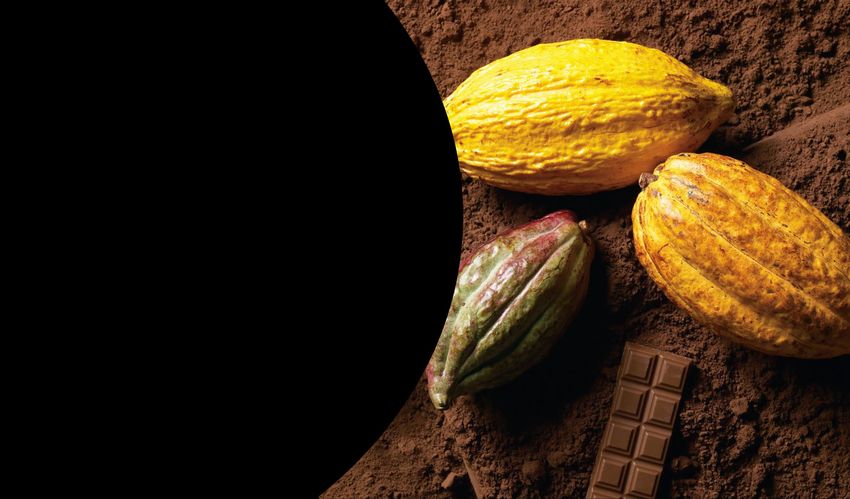
Olam Food Ingredients (OFI)
S$ Million                                                                                                           Ingredient Sourcing & Supply Chain
EBIT                                                                                     Invested Capital            Value-added Food Ingredients & Solutions

                                 +4.9%                                                                                      +2.1%
                                               -2.8%                                                                                      +6.1%

                                         794           771                                                                                     9,443
                                                                         +43.3%                           8,877       8,553       8,897
             668           678
                                         52%           50%                      508                                                               60%
             50%          41%                                                                              58%        60%           63%
                                                                   355
                                                                                57%
                                                                  55%
             50%          59%            48%           50%                                                 42%                                    40%
                                                                                43%                                   40%           37%
                                                                  45%

            2017          2018       Restated          2020     Restated     H2 2020                     Dec-17      Dec-18     Restated      Dec-20
  EBIT                                2019                      H2 2019                                                          Dec-19
  Margin     5.0%         5.6%        6.5%             6.1%       5.5%         8.0%         EBIT/IC       7.2%        7.8%        9.1%            8.4%

• OFI registered a strong EBIT growth of 43.3% in H2 2020 with both Ingredient
  Sourcing & Supply Chain and Value-added Food Ingredients & Solutions segments          • IC increased by S$546.4 million due to higher commodity price led
  achieving better earnings, leading to EBIT margin growing from 5.5% to 8.0% for the      working capital increases, particularly in H2 2020.
  period.
• Although EBIT for 2020 was lower YOY because of the Covid-19 impact in H1 2020 on
  Cocoa processing and the Australian Almond business, the results represent a strong,
  resilient performance considering 2019 was an exceptional year for Cocoa.
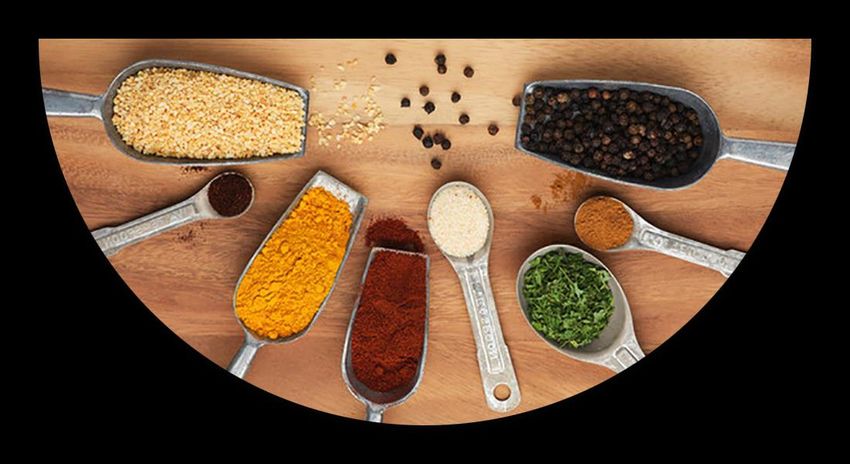
• All other businesses like Coffee, Dairy, Spices and other Nuts delivered better
  earnings than the prior year.
                                                                                                                                                                22
OFI: Ingredient Sourcing & Supply Chain
S$ Million
EBIT                                                                                Invested Capital
                                 +4.5%                                                   Working Capital                      +2.8%
                                            -6.4%                                        Fixed Capital                                        +0.6%
                                        410                      +48.2%                                                               5,601           5,637
                                                   384                                                   5,182        5,128
                  337
                             276                                         290
                                                                                                                                      3,392           3,446
                                                                                                         3,210        3,160
                                                              195

                                                                                                         1,972        1,968           2,209           2,191

                 2017       2018 Restated         2020 Restated H2 2020                                  Dec-17      Dec-18        Restated           Dec-20
  EBIT                            2019                 H2 2019                                                                      Dec-19
                 3.3%       3.0%  4.2%            3.8%  4.0%      6.1%                  EBIT/IC           6.4%        5.4%           7.6%              6.8%
  Margin

• Strong EBIT growth of 48.2% in H2 2020 with significant increase from Coffee      • Modest increase in IC of S$35.7 million mainly from the impact of SFRS
  supply chain, healthy growth from Nuts and expansion in Dairy farming after a
                                                                                      (I) 16 on the Almond business and expansion of Dairy farming in Russia.
  third dairy farm was commissioned in Russia.
• Overall EBIT decline in 2020 mainly caused by the impact on Almonds orchards      • Working capital marginally higher than 2019 as the impact from higher
  in Australia from weaker almond prices, demand contraction across China and         cocoa and coffee prices was offset by the reduction in coffee inventory.
  India on Covid-19 lockdowns and increased temporary water cost affecting
  2020 crop.
• Conversely, the Almond operations in the US did better for the full year as did
  the Coffee and Dairy supply chain and Dairy farming.                                                                                                           23
OFI: Value-added Food Ingredients & Solutions
S$ Million
EBIT                                                                                Invested Capital
                                                                                                                     +1.0%
                                                                                       Working Capital
                                 +5.4%                                                                                          +15.5%
                                               +1.0%                                   Fixed Capital

                           402           384           387                                             3,695                          3,806
                                                                   +37.3%                                       3,425     3,295
               331
                                                                                                       2,147                          1,943
                                                                           219                                  1,906     1,546
                                                               159

                                                                                                       1,548    1,519     1,749       1,863

              2017        2018      Restated       2020      Restated H2 2020                          Dec-17   Dec-18    Dec-19     Dec-20
  EBIT                               2019                    H2 2019
              6.9%        8.3%       7.9%          7.3%       6.0%     7.9%            EBIT/IC          8.2%     11.3%       11.4%    10.9%
  Margin

• Helped by a robust H2 2020 growth of 37.3%, EBIT performance remained strong in   • IC increased by S$510.7 million
  2020, reporting a growth even when compared against the prior year which had a
  strong performance, particularly in Cocoa processing.                             • Fixed capital grew with capacity expansion in ingredients co-
                                                                                      processing in Vietnam, Cocoa processing in Cote d’Ivoire and
• The Cocoa processing business, affected by the pandemic in 2020, experienced
  demand contraction, delayed pulls by customers, and higher costs on account of
                                                                                      Dairy processing in Malaysia
  slowdowns at some processing facilities.                                          • Working capital increased on higher cocoa ingredients prices
• There was improved EBIT from Almond processing due to HNI, Peanuts and Spices       and inventory levels
  processing in the US, as well as Dairy processing in Malaysia. The Hazelnuts
  business also recovered from its lows in 2019.                                                                                                      24
OFI: On track to deliver sustained growth
     •     Resilient all-round performance despite the pandemic with strong earnings growth in H2 2020

     •     Increased customer focus by working closely with them to manage supply chain challenges, co-create
           innovative and sustainable solutions, and growing our customer base with sales and channel expansion

     •     Continuing to invest behind our strategy in innovation and go-to-market capabilities to transform
           OFI from a niche food raw materials supplier and processor into a food ingredients and solutions
           business with total investment commitments of approx. US$400 million:

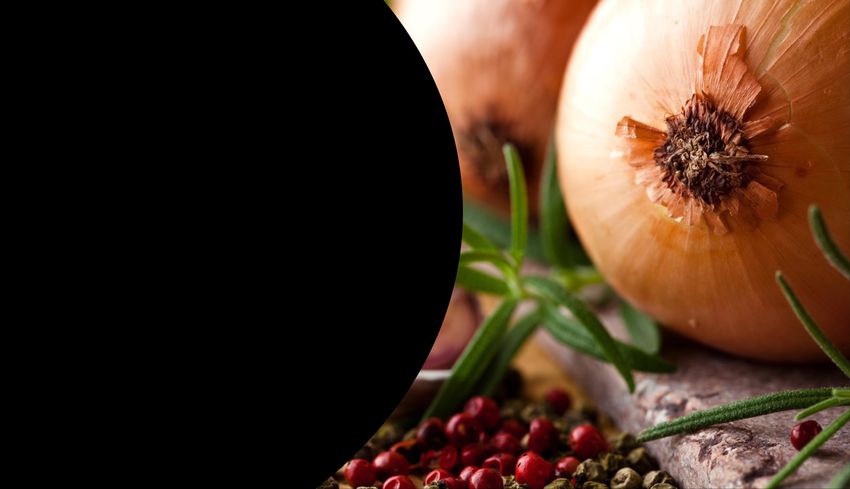
             •      Acquisition of US-based green chile pepper business

             •      Acquisition of US-based dehydrated onion ingredients business

             •      Greenfield investments in Soluble Coffee facility in Brazil and Dairy processing plant in New
                    Zealand, both to be completed by H2 2022

     •     Building on key enablers in Sustainability (eg Coffee LENS, Cocoa Compass), Digital and Innovation

     •     Operational Excellence, and Cost and Capital discipline

     •     New talent accretion – focus on on new capabilities and diversity to build bench strength

Olam International Limited Results for Full Year ended December 31, 2020 | February 26, 2021                        25
Olam Global Agri (OGA)
S$ Million                                  Food & Feed - Origination & Merchandising   Food & Feed - Processing & Value-added      Fibre & Ag Services

EBIT                                                                          Invested Capital

                                 +14.0%
                                                +40.3%                                                             +8.0%
                                                         462                                                                     +27.2%
                                                                                                                                       3,780
              312                         330            44%                                  2,998                        2,972          25%
              16%                                                                                                          13%
                           225            45%                                                 32%          2,122
                           30%                                                                             26%                            42%
              53%                                                                                                          59%
                                                         47%                                  34%
                           38%            36%                                                               46%
              31%                                                                             34%                          28%            33%
                           32%            19%            9%                                                 28%
             2017         2018       Restated            2020                                Dec-17       Dec-18       Restated       Dec-20
  EBIT/MT                             2019                                                                              Dec-19
               19           8          10                12                       EBIT/IC     10.2%        8.8%          12.9%            13.7%
  (S$)

• EBIT grew by a robust 40.3% with higher contribution from the Food          • IC increased by S$808.1 million due to volume growth
  & Feed segments, both from the Origination & Merchandising and                and higher commodity prices in the Food & Feed –
  Processing & Value-added segments, particularly from Grains,                  Origination & Merchandising segment, as well as longer
  Animal Feed and Rice.
                                                                                cycle times in the Cotton business due to Covid-19 and
• Improved performance from CFS also contributed to the overall                 its new investments.
  OGA EBIT.                                                                                                                                               26
OGA: Food & Feed - Origination & Merchandising
S$ Million
EBIT                                                                                 Invested Capital
                                                                                                                          -1.5%
                                                                                           Working Capital
                                         +59.1%                                                                                     +143.0%
                                                        +35.8%                             Fixed Capital

                                                                 203                                       979                               936

                                                  150                                                      428
                                                                                                                    547
                                                                                                                                             745
                                    66                                                                                            385
                     50                                                                                             402           185
                                                                                                           551
                                                                                                                    145           200        191
                    2017          2018         Restated        2020                                   Dec-17      Dec-18      Restated     Dec-20
  EBIT/MT                                       2019                                                                           Dec-19
  (S$)                4             3             5              6                      EBIT/IC
                                                                                                           5.2%    8.7%        32.1%        30.7%
• Healthy EBIT growth of 35.8%: Strong volumes in soybean, wheat and corn
  between Brazil, Black Sea and Asia, particularly China, combined with              • IC increased by S$550.8 million in 2020: Fixed capital was down
  disciplined risk management, good freight management resulted in significant         slightly while working capital rose substantially on higher volumes.
  growth in both top line and EBIT
• We were also favourably positioned for the surge in rice exports from India;
  Rice farming and milling in Nigeria also did well.
• Edible Oils trading declined due to the sharp fall in out-of-home consumption in
  Asia due to Covid-19, Indian ban on refined palm olein imports; some of this
  impact was offset by an improvement in domestic trading within China and
  South Africa.                                                                                                                                               27
OGA: Food & Feed - Processing & Value-added
S$ Million
EBIT                                                                               Invested Capital

                                         +9.7%                                           Working Capital
                                                       +86.2%                            Fixed Capital
                                                                                                                      +15.9%
                                                                                                                                     -9.7%
                                                                218
                                                                                                                            1,742
                     166                                                                                                                     1,573
                                                                                                                               442
                                                                                                                                             387
                                                 117                                                 1,010      982
                                    86                                                                   333    284
                                                                                                                            1,300            1,186
                                                                                                         677    698

                    2017          2018        Restated         2020                                 Dec-17     Dec-18     Restated       Dec-20
  EBIT/MT                                      2019                                                                        Dec-19
                     66             33          38              54                    EBIT/IC       16.2%      8.6%        8.6%              13.2%
  (S$)

• EBIT nearly doubled on stronger than expected growth in Grains milling post      • IC decreased by S$168.8 million in 2020 as working capital
  the acquisition of DFM, as well as in Cameroon, Senegal and Ghana; Animal          declined with tighter inventory and receivable days.
  Feed & Protein’s sales and margins also improved from prior year.
• Rice distribution business had a stellar, all-round performance across markets
  in Africa, backed by our sourcing capabilities and strong demand as well as
  the rationalisation/consolidation in the number of market participants during
  the year.                                                                                                                                          28
OGA: Fibre & Ag Services
S$ Million
EBIT                                                                                   Invested Capital
                                                                                            Working Capital
                                                                                            Fixed Capital
                                           -24.9%
                                                                                                                            +8.0%
                      96                                                                                                                  +50.5%
                                                          -34.7%
                                     73                                                                                                        1,270
                                                     63                                                 1,009
                                                                                                                                    844
                                                                    41                                                                             911
                                                                                                                     593
                                                                                                            836                     591
                                                                                                                     425
                                                                                                                                    253            359
                                                                                                            173      168
                    2017            2018         Restated          2020                                Dec-17      Dec-18       Restated       Dec-20
  EBIT/MT                                         2019                                                                           Dec-19
                      70             46            40               26                    EBIT/IC           9.0%     9.1%         8.7%         3.9%
  (S$)
• 34.7% reduction in EBIT as a result of significant contraction/downturn in textile
                                                                                       • IC increased by S$426.1 million in 2020 mainly due to working
  mills capacity utilisation due to Covid-19 and resultant lockdown measures in
  the major textile producing centres, leading to delays in shipments and                capital rising on higher Cotton stock levels due to Covid-19 and
  therefore longer inventory carrying periods across most of our Cotton origins.         expansion of integrated ginning in Cotontchad.
• Australia experienced drought conditions which affected its cotton production        • Fixed capital also increased following our new acquisitions for
  and in turn impacted our ginning income                                                Cotton in Togo and the US.
• Improved contribution from CFS as it implemented new asset management
  strategies to navigate through market volatilities in H2 2020                                                                                             29
OGA: Continue to progress on strategic growth
     •     Continues to benefit from key secular trends: Growing food security agenda, rising protein
           consumption, emerging markets growth, rising tech adoption and sustainability focus
     •     Diversify our business in emerging markets by enhancing presence in Asia
     •     Invest in priority assets and businesses with high returns:
             •      Expand into higher value B2C downstream products distribution (eg pasta, semolina,
                    branded fortified Rice, etc)
             •      Focus on businesses where we have proven track record in greenfield and brownfield
                    projects execution and bringing them into scale with high operating efficiencies
             •      Expand Integrated Ginning operations in Africa
     •     Deepen our strengths and capabilities in Origination & Merchandising, Processing,
           Freight and Risk Management
     •     Develop asset management capabilities in Commodity Financial Services

Olam International Limited Results for Full Year ended December 31, 2020 | February 26, 2021             30
Olam International (OIL)
S$ Million                             De-prioritised/Exiting Assets          Gestating Businesses    Incubating Businesses (including corp adjustments)
EBIT                                                                                  Invested Capital

                                                   -149.2%                                                                            -12.2%
                            57
              34                              19                                                     3,958       4,138        3,921
        0                    0                                                                                                                 3,443
                                             -40               -36
            -67                                                                                                  1,965        1,674
                                                                                                     2,138                                     1,360
                           -117              -45               -69
            -33
                                             -66
                                                                                                     1,820       2,173        2,247            2,083
                            -60                                -59

                                                              -164                                   Dec-17     Dec-18      Restated       Dec-20
         2017              2018       Restated 2019           2020                                                           Dec-19
                                                                                         EBIT/IC     -0.8%       -1.5%       -1.6%             -4.5%

• EBIT losses in OIL of S$164.0 million were a result of divestments and              • IC came down by S$478.1 million mainly on the OPG impairment,
  closures as well as the lower performance of the three Gestating Businesses,          as well as other divestments and closures.
  all of which were impacted by Covid-19.
• De-prioritised/Exiting Assets: Fully divested sugar refinery in Indonesia, shut
  down OTP, restructured NZFSU, sold Mungindi gin in Australia and sugar mill
  in India
• Incubating Businesses: Making good progress in the six Engine 2 growth
  initiatives.
                                                                                                                                                           31
OIL: Incubate platforms for future growth
 Criteria for selecting Engine 2 ventures
  •1     Disruptive idea
  •2     Aligned to our purpose: ‘Re-imagining Global Agriculture & Food Systems’
  •3     Leveraging Olam’s core strengths & unique assets
  •4     Material & Scalable opportunity – large enough opportunities that can become new engines of growth for Olam in 6
         years (two 3-year planning cycles).
  •5     Enhances Olam’s core business – higher margin, higher returns & lower volatility/cyclicality
  •6     Smart investing (digital & sustainability) rather than asset-heavy capital led models
  •7     Strategic & Financial value to Olam

 Six Engine 2 initiatives being studied/explored

                                                Environmental                                    Carbon Trading &
    Farmer Services                         footprinting & solutions                                                 Purpose Brands        Digitial
       Platform                                                                                    Sustainable           (B2C)
    1                                        2    (B2C ‘Adva’;                                  4 Landscapes          5               6 sustainability
        (‘Jiva’)                                                                                                          (‘Re’)          platform
                                             3
                                               B2B ‘Green Pass’)                               Investment Platform

Olam International Limited Results for Full Year ended December 31, 2020 | February 26, 2021                                                             32
Re-organisation Plan :
Progress update
Re-organisation update

                                                                                                                                             STEP 4
                                                                                                                                             OFI IPO &
                                                                                                                                             Concurrent De-
                                                                                                                                             merger, OGA
                                                                                                         STEP 3                              Strategic Options
                                                                                                         Carve-out and                       Subject to shareholder and regulatory
                                                                                                                                             approvals:
                                                                    STEP 2                               Separation                          • Target OFI listing by H1 2022
       STEP 1                                                       Re-organisation                      • Dedicated implementation
                                                                                                                                             • OFI will be demerged from the Olam
                                                                    • Developed Targeted                   teams for Separation, IPO and
       Re-segmentation                                                Operating Model (TOM) for the        De-merger set up.
                                                                                                                                               Group by way of a distribution in
                                                                                                                                               specie of shares in OFI to Olam
        • Re-segmented the current                                    new operating groups,                                                    shareholders at the point of demerger
          business into two new operating                             including embedded business,       • Programme Office,
                                                                                                                                               in conjunction with the IPO
          groups (OFI & OGA) under Olam                               country/regional structures          independent financial advisors,
          International (OIL).                                        and central functions                legal and tax advisers, PR and    • In parallel, explore similar strategic
                                                                                                           IR advisers appointed               options for maximising the value of
        • Developed new reporting                                   • Dedicated leadership &                                                   OGA
          segments, key financial metrics for                         management teams for each
          each operating group                                                                           • Carve-out and Separation to       Shareholders should note that there is no
                                                                      of the operating groups in
                                                                                                           be completed for OFI and          certainty or assurance that such listing,
        • Reported H1 2020 and 2020                                   place
                                                                                                           OGA by end-2021                   scheme and/or de-merger will finally
          results on basis on new operating                         • Hiring of new talent for the key                                       occur as planned above
          groups and segments with                                    capabilities required to pivot           Underway
          historical comparative financials                           both the OFI and OGA
                                                                                                           Target completion                        Underway
                                                                      businesses underway
          Completed                                                                                            end-2021                        Target completion H1
                                                                      Completed                                                                        2022
Olam International Limited Results for Full Year ended December 31, 2020 | February 26, 2021                                                                                            34
Key takeaways
                                   Resilient results despite Covid-19 challenges:

                    01             •     Strong 36.0% growth in Operational PATMI in 2020 to S$678 million with
                                         Operational ROE at 11.2%
                                   •     Strong operating performance by OFI in H2 2020 and OGA in 2020

                       Significant progress on Re-organisation Plan
                  • Re-segmentation and re-organisation with Targeted Operating Model (TOM) and
                    dedicated leadership & management teams for each of the new operating groups in place
                  • Carve-out and separation underway for OFI and OGA, targeted for completion by end-
                    2021
                  • OFI IPO by H1 2022; OFI will be demerged from Olam Group by way of a distribution in            02
                    specie of shares in OFI to Olam shareholders at the point of demerger in conjunction with
                    the IPO
                  • In parallel exploring similar strategic options for OGA

                     03
                                        Market conditions and sentiments are beginning to improve as economies snap
                                        back from the worst impacts of Covid-19 in 2020 and we expect this favourable
                                        market environment to continue to improve in 2021.

Olam International Limited Results for Full Year ended December 31, 2020 | February 26, 2021                             35
Appendix
P&L statement

 S$ million                                                                                    2020            Restated 2019     % Change

  Volume ('000 MT)                                                                               44,409.7             39,751.8              11.7

  Revenue                                                                                        35,820.0             32,992.7               8.6

  Net (loss)/gain in fair value of biological assets^                                                 (60.3)              19.0          n.m.

  Depreciation & Amortisation^                                                                    (561.3)              (495.8)          13.2

  EBIT^                                                                                           1,069.5              1,057.3               1.2

  Net Finance costs^                                                                              (415.7)              (539.6)         (23.0)

  Taxation^                                                                                           (43.5)            (58.5)         (25.6)

  Exceptional items                                                                               (432.1)              (182.1)          n.m.

  PAT                                                                                                 178.2              277.1         (35.7)

  PATMI                                                                                               245.7              316.1         (22.3)

  Operational PATMI^                                                                                  677.8              498.2          36.0
^ Excluding exceptional items
Olam International Limited Results for Full Year ended December 31, 2020 | February 26, 2021                                                       37
P&L statement
   S$ million                                                                                  H2 2020        Restated H2 2019    % Change

  Volume ('000 MT)                                                                                 24,351.3           20,651.6           17.9

  Revenue                                                                                          18,739.5           17,048.8               9.9

  Net (loss)/gain in fair value of biological assets^                                                (64.1)               23.0           n.m.

  Depreciation & Amortisation^                                                                      (288.7)             (246.3)          17.2

  EBIT^                                                                                              645.8               535.3           20.6

  Net Finance costs^                                                                                (185.5)             (274.7)         (32.5)

  Taxation^                                                                                          (14.8)              (26.8)         (44.8)

  Exceptional items                                                                                 (562.7)             (164.4)          n.m.

  PAT                                                                                               (117.2)               69.4           n.m.

  PATMI                                                                                              (87.0)               85.8           n.m.

  Operational PATMI^                                                                                 475.7               250.2           90.1
^ Excluding exceptional items

Olam International Limited Results for Full Year ended December 31, 2020 | February 26, 2021                                                       38
Exceptional items
                                                                                                                                             Restated
   S$ million                                                                                  2020           Restated 2019    H2 2020
                                                                                                                                              H2 2019
   Profit on sale of partial stake in ARISE
                                                                                                  121.0               40.4          (2.0)          40.4
   associates
   Profit on sale of Far East Agri (PT DUS)                                                           49.1                 -        (0.7)               -

   Profit on sale of Sugar plant in India                                                              1.5                 -          1.5               -

   Exit/Closure costs                                                                            (119.0)            (315.8)        (77.6)       (298.6)

   OPG Impairment                                                                                (483.9)                   -      (483.9)               -

   Sale of permanent water rights, Australia                                                              -           69.3               -         69.3
   Sale and tiered revenue sharing arrangements,
                                                                                                          -           16.6               -         16.6
   US
   Negative goodwill arising on acquisition                                                               -             7.9              -          7.9

   Profit on sale of subsidiary (Alimentos)                                                               -             0.6              -              -

   Loss on sale of stake in Mungindi gin, Australia                                                   (0.8)                -             -              -

   Loss on sale of Collymongle gin, Australia                                                             -           (1.1)              -              -
^ Excluding exceptional items

   Exceptional Items                                                                              (432.1)            (182.1)       (562.7)       (164.4)
Olam International Limited Results for Full Year ended December 31, 2020 | February 26, 2021                                                                39
Balance sheet
                                      S$ million                                               2020          Restated 2019    % Change
                                      Fixed Capital                                              8,309.9            8,616.0       (306.1)

                                      Right-of-use assets                                         712.2              719.3          (7.1)

                Uses of               Working Capital                                            7,455.7            6,627.8        827.9
                Capital               Cash                                                       3,115.9            3,179.6        (63.7)

                                      Others                                                      601.7              229.8         371.9

                                      Total                                                     20,195.4           19,372.5        822.9

                                      Equity & Reserves                                          6,425.4            6,589.3       (163.9)

                                      Non-controlling interests                                       73.5           108.1         (34.6)

                                      Short term debt                                            6,466.5            6,675.5       (209.0)

             Sources of               Long term debt                                             6,780.9            5,403.4       1,377.5
              Capital                 Short term lease liabilities                                    96.5           118.5         (22.0)

                                      Long term lease liabilities                                 815.5              881.8         (66.3)

                                      Fair value reserve                                         (462.9)            (404.1)        (58.8)

                                      Total                                                     20,195.4           19,372.5        822.9

Olam International Limited Results for Full Year ended December 31, 2020 | February 26, 2021                                                40
Cash flow statement

   S$ million                                                                                  2020             Restated 2019      YoY Change

  Operating Cash flow (before Interest & Tax)                                                     1,697.3               1,455.8            241.5

  Changes in Working Capital                                                                     (1,160.9)                (95.6)        (1,065.3)

  Net Operating Cash Flow                                                                             536.4             1,360.2           (823.8)

  Net interest paid                                                                               (437.0)               (555.8)            118.8

  Tax paid                                                                                        (177.8)               (106.8)            (71.0)

  Cash from divestments                                                                               239.7               502.9           (263.2)

  Free cash flow before Capex/investments                                                             161.3             1,200.5         (1,039.2)

  Capex/Investments                                                                               (753.5)              (1,065.6)           312.1

  Free cash flow to equity (FCFE)                                                                     (592.2)              134.9          (727.1)

Olam International Limited Results for Full Year ended December 31, 2020 | February 26, 2021                                                        41
2020 Results Briefing
olamgroup.com/investors.html
ir@olamnet.com
You can also read