Just Eat Takeaway.com | LSE: JET - Online Food Delivery Research Overview September 2020 - Squarespace
←
→
Page content transcription
If your browser does not render page correctly, please read the page content below

Just Eat Takeaway.com | LSE: JET
Online Food Delivery Research Overview

            September 2020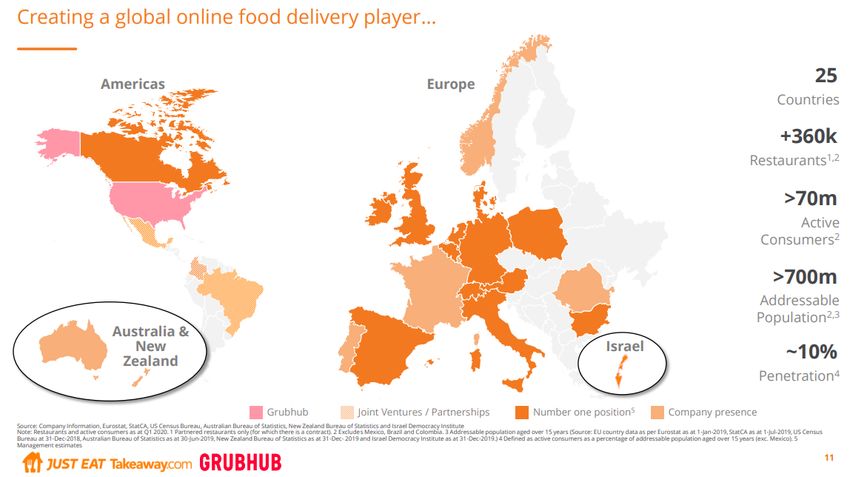
Disclaimer
The author of this deck, Cat Rock Capital Management LP (“Cat Rock Capital”), is a private fund manager. This deck, and its content, distribution and use, is subject to the terms specified at
www.JustEatDoesDeliver.com.
At the time of publication this deck, funds and accounts managed by Cat Rock Capital are is long 6.8 million shares of Just Eat Takeaway.com N.V. (LSE: JET) (AMS: TKWY) (the
“Company”). It is possible that there will be developments in the future that cause Cat Rock Capital to modify this economic interest at any time or from time to time. This may include a
decision to sell all or a portion of its holdings of such securities in open market transactions or otherwise (including via short sales), purchase additional such securities (in open market or
privately negotiated transactions or otherwise) or trade in options, puts, calls or other derivative instruments relating to such securities. Cat Rock Capital also reserves the right to take any
actions with respect to its investment in the Company as it may deem appropriate, including, but not limited to, communication with the board of directors, management and other investors.
Cat Rock Capital is publishing this deck solely for the information of other shareholders in the Company. This deck is not intended to be and does not constitute or contain any investment
recommendation as defined by Regulation (EU) No 596/2014. No information in this deck should be construed as recommending or suggesting an investment strategy. Nothing in this deck
or in any related materials is a statement of or indicates or implies any specific or probable value outcome in any particular circumstance. This deck is provided merely for general
informational purposes and is not intended to be, nor should it be construed as (1) investment, financial, tax or legal advice, or (2) a recommendation to buy, sell or hold any security or other
investment, or to pursue any investment style or strategy. Neither the information nor any opinion contained in this deck constitutes an inducement or offer to purchase or sell or a
solicitation of an offer to purchase or sell any securities or other investments in the Company, Takeaway or any other company by Cat Rock Capital or any fund or other entity managed
directly or indirectly by Cat Rock Capital in any jurisdiction. This deck does not consider the investment objective, financial situation, suitability or the particular need or circumstances of any
specific individual person who may access or review this deck and may not be taken as advice on the merits of any investment decision. Any person who is in any doubt about the matters to
which this deck relates should consult an authorised financial adviser or other person authorised under the UK Financial Services and Markets Act 2000. To the best of Cat Rock Capital’s
ability and belief, all information contained herein is accurate and reliable, and has been obtained from public sources that Cat Rock Capital believes to be accurate and reliable. However,
such information is presented “as is”, without warranty of any kind, whether express or implied. All expressions of opinion are subject to change without notice, and Cat Rock Capital does
not undertake to update or supplement any of the information, analysis and opinion contained herein.
This deck contains certain forward-looking statements and information that are based on Cat Rock Capital’s beliefs as well as assumptions made by, and information currently available to,
Cat Rock Capital. These statements include, but are not limited to, statements about strategies, plans, objectives, expectations, intentions, expenditures and assumptions and other
statements that are not historical facts. When used herein, words such as “anticipate,” “believe,” “estimate,” “expect,” “intend,” “plan” and “project” and similar expressions are intended to
identify forward-looking statements. These statements reflect our current views with respect to future events, are not guarantees of future performance and involve risks and uncertainties
that are difficult to predict. Further, certain forward-looking statements are based upon assumptions as to future events that may not prove to be accurate. Actual results, performance or
achievements may vary materially and adversely from those described herein. There is no assurance or guarantee with respect to the prices at which any securities of the Company,
Takeaway or any other company will trade, and such securities may not trade at prices that may be implied herein. Any estimates, projections or potential impact of the opportunities
identified by Cat Rock Capital herein are based on assumptions that Cat Rock Capital believes to be reasonable as of the date hereof, but there can be no assurance or guarantee that
actual results or performance will not differ, and such differences may be material and adverse. No representation or warranty, express or implied, is given by Cat Rock Capital or any of its
officers, employees or agents as to the achievement or reasonableness of, and no reliance should be placed on, any projections, estimates, forecasts, targets, prospects or returns
contained herein. Any historic financial information, projections, estimates, forecasts, targets, prospects or returns contained herein are not necessarily a reliable indicator of future
performance. Nothing in these materials should be relied upon as a promise or representation as to the future.
In relation to the United Kingdom, this deck is directed only at, (i) investment professionals specified in Article 19(5) of the Financial Services and Markets Act 2000 (Financial Promotion)
Order 2005 as amended (the “Order”), (ii) high net worth entities, and other persons to whom it may lawfully be communicated, falling within Article 49(2)(a) to (d) of the Order or (iii) persons
to whom an invitation or inducement to engage in investment activity (within the meaning of section 21 of the Financial Services and Markets Act 2000) in connection with the issue or sale of
any securities of the Company or any member of its group may otherwise lawfully be communicated or caused to be communicated (all such persons together being referred to as
“Permitted Recipients”). Persons who are not Permitted Recipients must not act or rely on the information contained in this deck. This deck does not address the merits of the transaction
from the point of view of stockholders of Grubhub Inc..
The distribution of this deck in certain countries may be restricted by law and persons who access it are required to inform themselves and to comply with any such restrictions. Cat Rock
Capital disclaims all responsibility where persons access this deck in breach of any law or regulation in the country of which that person is a citizen or in which that person is residing or is
domiciled. Cat Rock Capital is subject to supervision by, and registered with, the U.S. Securities and Exchange Commission.

                                                                                                                                                                                                   2
Table of Contents

I.    Online Food Delivery Industry Overview                    4

II. Just Eat Takeaway.com (‘JET’) Investment Case               14

III. Grubhub (‘GRUB’) Acquisition Case                          28

Appendices
     A.   TEV / GMV or TEV / Gross Profit?                      39
     B.   Why is the hybrid model superior to logistics-only?   49
     C.   How strong is JET’s position in the UK?               73
     D.   What is necessary to improve GRUB’s position?         76
     E.   What are the best data sources?                       91

                                                                     3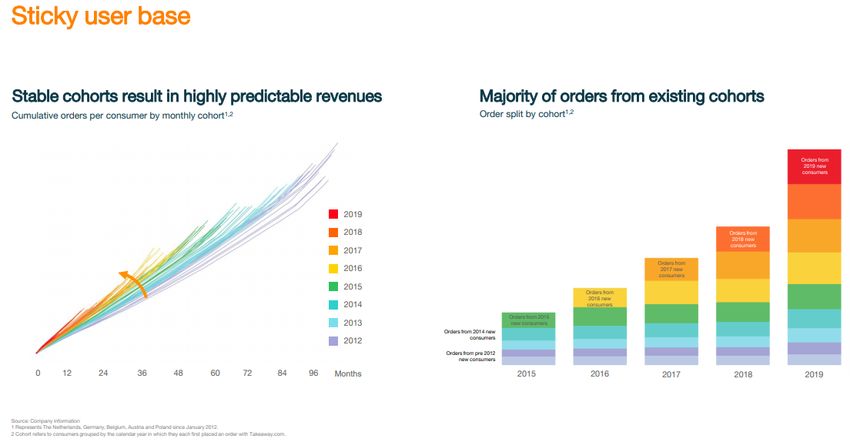
I. Online Food Delivery
   Industry Overview

                          4
Online Food Delivery Started 20 Years Ago With the Marketplace Model

                      Online Food Delivery Pioneers

        Netherlands            United Kingdom       United States
         Est. 2000                Est. 2001          Est. 2004

                           Marketplace Model

                                                                       5
Network Effects Are Strong

                               More
                             Consumers

                 More                       More
              Investment                 Restaurants

               More                        More
             Consumers                   Consumers

                               More
                             Marketing

                                                       6
Strong Network Effects Drove Attractive Economics

           Historical Online Food Delivery Margins(1)

          63%

                                                                    51%

                                                                                                29%

         TKWY                                                   JE                             GRUB
       Netherlands                                        United Kingdom                    United States

              Note(s): (1) According to company filings, based on FY16 EBITDA and revenue
                                                                                                            7
Strong Network Effects Supported Strong Competitive Positions

                                 Historical Relative Size(1)
9x
      Takeaway.com

8x
                                                                                                           Grubhub
7x
                                                           Just Eat
6x

5x

4x

3x

2x
                  Just Eat                                              hungryhouse                                  Eat24
1x

 -
           Netherlands                                       United Kingdom                                  United States

              Note(s): (1) According to Google Trends, based on LTM search frequency as of December 2015
                                                                                                                             8
Logistics-Based Competitors Entered Between 2011 and 2015

                     Logistics-Based Competitors

         Est. 2011                Est. 2012               Est. 2013

                      Est. 2013               Est. 2015

                                                                      9
Logistics-Based Competitors Grew Rapidly by Subsidizing Consumers
and Introducing New Selection
                           Subsidies

                         New Selection
       QSRs                  High-End              Suburbs

                                                                    10
Incumbents Chose Different Strategies
Grubhub Just Eat Takeaway.com
Modest investment in Late to introduce logistics, Built in-house delivery
nationwide delivery followed by outsourced capability across all
capability and scattered approach countries
Continued focus on Continued focus on Focused on areas with
growing EBITDA per growing short-term greatest competitive risk
order EBITDA and selection
improvement
Offered delivery with no
fee to create best
consumer proposition
Focus on Focus on
Short-Term Market
Profits Leadership
11Marketplace Incumbents Have Significant Structural Advantages Over
Logistics-Only Competitors
Large existing user base to drive utilization of
1 couriers
2 Better selection from marketplace
3 Lower delivery fees from marketplace
4 Network effects from established scale business
See Appendix – p. 49
12Track Record of JET Mgmt. Shows Effectiveness of Hybrid Strategy
Google Trends(1)
Netherlands Germany Poland
Sep-15
Sep-16
Sep-17
Sep-18
Mar-19
Sep-19
Sep-15
Sep-16
Sep-17
Sep-18
Sep-19
Mar-20
Sep-15
Sep-16
Sep-17
Sep-18
Sep-19
Mar-16
Mar-17
Mar-18
Mar-20
Mar-16
Mar-17
Mar-18
Mar-19
Mar-16
Mar-17
Mar-18
Mar-19
Mar-20
Thuisbezorgd Deliveroo Lieferando Deliveroo Pyszne PizzaPortal
Uber Eats Uber Eats Glovo
JET Grew Profits While Aggressively
Defending Market Leadership
Note(s): (1) According to Google Trends as of 9/21/2020
13II. JET Investment Case
14JET Leveraging Hybrid Structural Advantages to Drive Market
Leadership in Europe and North America
Note(s): According to company filings
15JET Is the Clear Market Leader Across 90%+ of Its GMV
% of Market
JET Segment GMV(1) Position(2)
United Kingdom 33% #1
Germany 19% #1
Canada 11% #1
The Netherlands 9% #1
Other 28% 90%+ of GMV
Italy 4% #1 from
Spain 4% #1 #1 Positions
France 4% #3
Australia/New Zealand 4% #2
Israel 3% #1
Belgium 2% #1
Poland 2% #1
Austria 2% #1
Other 4% #1
Note(s): (1) According to company filings and CRC estimates, based on FY19 GMV; (2) According to CRC estimates
16JET Hybrid Model Allows It to Generate Growth with Profitability
JET Revenue and Profit(1)
€1.9B
€1.6B
€1.1B
€0.8B
€0.6B
€0.4B
€0.3B
€0.2B €0.2B
€0.2B €0.2B
€0.1B €0.1B
€0.0B €0.1B
€0.0B
FY13 FY14 FY15 FY16 FY17 FY18 FY19 LTM 1H20
Revenue EBITDA
Note(s): (1) According to company filings, shown on a pro forma basis for JE / TKWY merger
17JET Has Huge Growth Potential
JET Growth Opportunity
Pop. Penetration(1) Order Frequency(2) TAM(4)
90.0
$592B
70-80% Long-Term Target
~7x
33%
30.0
25%
~2%
15% Penetration
11% 9% ---Benchmarks(3)---
0.7 2.0 2.0 2.0 3.0 $10B
JET GMV Restaurant
Sales(5)
Note(s): (1) According to company filings, calculated as Active Consumers divided by 15+ population (sourced from Eurostat, StatCA, US Census Bureau, Australian Bureau of Statistics,
New Zealand Bureau of Statistics and Israel Democracy Institute); (2) According to company filings, represents monthly order frequency, based on orders divided by Active Consumers
divided by 12; UK = United Kingdom, CN = China, NL = Netherlands, SK = South Korea, NYC = New York City, ME = Middle East; (3) According to CRC estimates; (4) Pro forma FY19
GMV according to company filings; (5) According to Euromonitor International, based on restaurant sales in JET markets, excludes restaurant sales in Latam markets 18Simple Math on Growth
15+ Pop x % of Pop x Freq x AOV x Take = Revenue
JET FY19(1) 450M 11% 0.7 per month €20.69 18% €1.6B
JET Potential (2) 450M 35% 2.5 per month €20.69 20% €19.6B
% Increase 0% 218% 249% 0% 10% 1,156%
Benchmarks(2)
UK ~25% SK ~2
CN ~30% CN ~2
NL ~33% NYC ~2
ME ~3
Path to 10x Increase in Sales
Note(s): (1) According to company filings and CRC estimates; (2) According to CRC estimates; UK = United Kingdom, CN = China, NL =
Netherlands, SK = South Korea, NYC = New York City, ME = Middle East 19JET Can Invest for Growth and Generate Strong Long-Term Profits
Online Food Delivery Margins(1)
50%+ 50%+ 50%+ 50%+
48%
44% 45%
(2) (2) (3) (3) (3) (3) (4)
JET UK JET NL JET DK DHER FI DHER SE DHER TU GRUB NYC
Note(s): (1) Based on EBITDA margins; (2) According to company filings, based on 1H20 results; (3) According to historical company
commentary; (4) Based on CRC estimates 20JET Normalized Margins Likely Over 40%
% of 1H20 Potential
(1) (2) (3)
JET Segment Revenue(1) Margin(2) Margin(3) Rationale
See NL margin - UK margin should be
United Kingdom 32% 44% 50% higher LT due to greater scale
23% achieved in 2Q20 despite significant
Canada 21% 19% 25% S&M spend for ~100% 2Q20 order growth
See NL margin - DE margin should be
Germany 15% 36% 50% higher LT due to greater scale
48% achieved in 1H20 despite significant S&M
The Netherlands 8% 48% 50% spend + upfront investments in logistics
Other 25% 7% 40%
Italy 4% n/a 45%
Spain 4% n/a 45%
France 4% n/a 30%
Australia/New Zealand 4% n/a 30% Margins forecast based on mix of
Belgium 2% n/a 45% logistics and size of market
Poland 1% n/a 45%
Israel 1% n/a 45%
Austria 1% n/a 45%
Other 3% n/a 45%
Total JET 100% 21% 42%
Note(s): (1) According to company filings and CRC estimates for individual Other markets; (2) According to company filings, adjustments
made for restaurant support initiatives implemented by JE prior to TKWY having control of the business; (3) CRC estimates 21JET Has Fantastic Founder-Led Management
The Team Track Record(1)
Owns 10% (€1.4B), Cumulative Total Shareholder Return
>95% of net worth
450
Cumulative Total Shareholder Return Since IPO (Indexed to 100)
400
350
300
250
Notable Achievements 200
1 20-year track record in industry 150
(2)
2 Most profitable marketplace globally (NL) 100
(2) 50
3 #3 to #1 in DE, besting DHER
-
4 Successful rollout of owned-delivery
(2)
5 Acquired largest global marketplace business (JE) JET MSCI World
Note(s): (1) According to S&P Capital IQ as of 9/24/2020; (2) According to CRC estimates
22JET Could Generate ~10x Return Over 10 Years
Current (1) Future(2) Assumption
35% Pop. Penetration
GMV €13.1B €97.8B (3)
2.5 Orders per Month
Revenue €2.5B €19.6B 20% Take Rate
Normalized EBIT €0.9B €6.8B 35% Margin
Normalized FCF €0.7B €5.3B 22% ETR
x P / FCF 19.1x 25.0x(4)
Equity Value excl. iFood €13.1B €133.4B
(+) Value of iFood Stake €1.0B €1.0B
Equity Value €14.1B €134.4B
Equity Value / Share €94.88 €904.00
MOIC 9.5x
10-Year IRR 25%
Note(s): (1) According to S&P Capital IQ as of 9/24/2020, based on CRC NTM estimates; (2) According to CRC estimates; (3) Assumes
15+ population of 450M and AOV of €20.69; (4) CRC assumption 23JET Stock Has Dramatically Underperformed Other COVID Beneficiaries
YTD Share Price Performance vs. 2Q20 Revenue Growth
160% 140%
150%
140%
140% 131% 120%
YTD Share Price Performance
120%
100%
2Q20 Revenue Growth
100%
80%
80%
62% 60%
60%
45%
40%
40%
20% 15% 20%
- -
(3)
Shopify Teladoc HelloFresh Amazon Netflix JET
YTD Share Price Performance (1) 2Q20 Revenue Growth (2)
Note(s): (1) According to S&P Capital IQ as of 9/24/2020, dividend-adjusted; (2) According to company filings; (3) Based on company
filings and CRC estimates 24JET Stock Is Cheap Relative to Other Fast Growers
TEV / CY20e Gross Profit vs. 2Q20 Revenue Growth
90x 120%
80x 76x 100%
TEV / CY20e Gross Profit
70x 80%
2Q20 Revenue Growth
60x 60%
50x 40%
41x 38x
40x 20%
30x 24x -
23x 21x
20x 15x (20%)
13x
10x 9x 9x
10x (40%)
- (3) (3)(4) (3)(4)(5)
(60%)
(1) (2)
TEV / CY20e Gross Profit 2Q20 Revenue Growth
Note(s): (1) Based on S&P Capital IQ (for capitalizations) and Visible Alpha (for estimates) as of 9/24/2020; (2) According to company filings; (3) Gross profit
based on CRC estimates; (4) Adjusted for ownership stake in iFood (valued at €1bn); (5) GRUB gross profit adjusted to align with JET reporting
25JET Has Never Been Cheaper Despite COVID Tailwind
TEV / NTM Revenue(1)
12x
10x
~5x
Rev
8x
6x
4x
2x
-
11/11/16 5/11/17 11/11/17 5/11/18 11/11/18 5/11/19 11/11/19 5/11/20
Note(s): (1) According to Bloomberg as of 9/24/2020, based on historical TKWY TEV / revenue multiple prior to 1/31/20, data from 1/31/20
to 3/27/20 unavailable due to JE / TKWY merger, not adjusted for ownership stake in iFood (valued at €1bn) 26Conclusions
JET has massive growth potential – revenue could
1
increase 10x if penetration hits 35% and frequency
hits 2.5x per month
JET has proven profitability and is cheap on
2
normalized FCF ➔ ~19x NTM Normalized FCF
JET equity could deliver ~10x return over time given
3
growth and profitability potential
27III. GRUB Investment Case
28GRUB Deal Has Strong Rationale
Growth: Double TAM and significantly extend growth
1 runway
2 Profits: Acquire additional profits at attractive terms
Strategy: Significantly increases competition in
3 core market of major global competitor
29GRUB Deal Doubles TAM at an Attractive Price
JET / JET + GRUB Valuation(1) vs. TAM(2)
$1.2T
2x Increase
in TAM
$0.6T
$22.6B
$15.3B
JET JET+ GRUB
Valuation TAM
Note(s): (1) TEV according to S&P Capital IQ as of 9/24/2020, adjusted for JET’s ownership stake in iFood (valued at €1bn); (2) According to Euromonitor
International, includes all markets outside of Latam, based on restaurant spend, which includes sales of food and drinks including VAT, but excluding sales tax
30GRUB Deal Grows Business at Good Value
GRUB Deal Valuation
Purchase Price(1) $7.3 billion
Est. NTM Revenue(2) $1.9 billion
TEV / Revenue 3.8x
P / Normalized FCF
@ $1.50 per Order (2) 24.8x
@ 6% GMV Margin(2) 17.2x
@ 25% Revenue Margin(2) 19.1x
~20x Normalized FCF
Organic Revenue Growth for 30%+ Rev Growth
Prior 3 Year Average 32%
2Q20 41%
2Q20 excl. Commission Caps(3) ~60%
Note(s): (1) Based on TEV at the time of the merger announcement; (2) Based on CRC estimates, assumes 21% effective tax rate; (3)
Assumes 60% of $100mm of COVID-19-related support spend was accounted for as a reduction to revenue 31GRUB Deal Further Impairs Outlook for Loss-Making Competitors
Uber Eats Financials(1)
$1,383M
$759M
$363M
JET US Entry Only
($355M) Adds to Pressure
($601M)
($1,372M)
FY17 FY18 FY19
Adjusted Net Revenue
Segment Adjusted EBITDA
Note(s): (1) According to company filings, excludes Corporate G&A and Platform R&D costs, as well as, other items
32GRUB Core Markets Look Like Europe
1 High population density, urban
2 Significant base of marketplace restaurants
3 Established marketplace incumbent
33GRUB Stepped Up Investments in 2H19
GRUB EBITDA per Order(1)
Investment in
Inventory and
Loyalty Begins
$1.75
$1.63
$1.57
$1.28
$1.23
$1.09
$0.98
$0.58
$0.45
$0.23
1Q18 2Q18 3Q18 4Q18 1Q19 2Q19 3Q19 4Q19 1Q20 2Q20
Note(s): (1) According to company filings
34Investments Are Working
Restaurant Inventory(1) Share of New Diner Adds (1)(2)
450,000 30%
400,000 Investment Begins 29% Investment Begins
350,000 28%
27%
300,000
26%
250,000
25%
200,000
24%
150,000
23%
100,000 22%
50,000 21%
- 20%
Note(s): (1) According to YipitData; (2) Includes Tier 1-3 markets only
35Pro Forma JET + GRUB Could Double in a Year
JET + GRUB Near-Term Potential Upside
One Year
Current (1) Forward(2) % Change
Capitalization
Share Price €94.88 €187.22 97%
Market Cap €20.3B €40.1B 97%
TEV (3) €19.4B €39.1B 102%
Financials
NTM Revenue €4.2B €5.2B 25%
(4)
NTM Normalized FCF €1.1B €1.4B 25%
Margin 35% 35%
Multiples
TEV / NTM Revenue 4.6x 7.5x 62%
TEV / NTM Normalized FCF 17.0x 27.5x 62%
Organic Revenue Growth
Prior 3 Year Average 33%
2019 28%
2Q20 53%
Note(s): (1) According to S&P Capital IQ as of 9/24/20, based on CRC estimates; (2) According to CRC estimates and assumptions; (3)
Adjusted for JET’s ownership stake in iFood (valued at €1bn); (4) Assumes effective tax rate of 23% 36JET Can Be Meituan of Western World with US Success
Long-Term Upside Potential
$45T
$575B
$14T
$173B
$23B
Meituan(1)(2) JET + GRUB(1)(2)(3)
Valuation GDP
Note(s): (1) TEV according to S&P Capital IQ as of 9/24/2020; (2) GDP according to The World Bank; (3) Represents combined GDP of
countries in which JET + GRUB operates, including Brazil and Mexico 37Conclusion – GRUB Deal Is a Masterstroke
Growth: Doubles JET addressable market and
1
extends growth runway
Profit: Adds to JET revenue, gross profit, and
2
normalized cash flow at attractive price
Strategy: Hampers global ambitions and viability of
3
loss-making competitors
38Appendix A:
TEV / GMV or TEV / Gross Profit?
39TEV / GMV Is Not the Right Valuation Framework
Promotional Activity Varies Chain Order Mix Varies
TKWY vs. DHER – Example(1) JE UK vs. UK Comp – Example(2)
Vouchers as % of GMV Chain Orders as % of Total Orders
Vouchers as % of Revenue
76%
15%
3% 15%
3%
0%
TKWY DHER JE UK UK Competitor 1
Note(s): (1) According to company filings, based on FY19 results; (2) According to YipitData, based on February 2020 orders
40“Free Food” GMV May Have Negative Economic Value (1)
1 Companies can boost GMV by paying customers to use their
service via vouchers
Former Industry Executive
“I jokingly call promotional spend crack. It’s a great way to rent growth. If I put out
strong promo on Friday, I know it will help numbers, but the minute I can’t fund that
anymore, the business goes away.”
JET Company Commentary
“Regarding vouchering, vouchering is what we see all our competitors do. The cohorts
on vouchers are 1 order. It's a waste of money, and it will just increase the revenue,
and you will all applaud it because the revenue will go up. But it doesn't make any
sense…You’re essentially [giving] people free food.”
41“Free Food” GMV May Have Negative Economic Value (2)
2 Companies agree to deliver food on uneconomic terms –
offering extremely low commissions to chain restaurants
Chain Orders as % of Total(1)
48%
Former Industry Executive
41%
“Chain orders from
the larger chains
have negative unit
17%
economics.”
GRUB Competitor 1 Competitor 2
Note(s): According to YipitData, based on LTM orders as May 2020
42Businesses That Sell a $1 for 85¢ Tend to Fail
Gross Profit Separates the Wheat from the Chaff
– not eyeballs or other volume-based metrics
43TEV / Gross Profit Measures Real Economic Value
Differentiates between food giveaways and real
1
orders
Normalizes for differences in revenue for
2 marketplace and logistics orders
Consistent with valuation methodology for most
3 other growth assets
Gross Profits Are Necessary for Long-Term Profits!
44Uber Eats Has Been Deeply Unprofitable as It Has Grown
Uber Eats Segment Financials(1)
$1,383M
+82%
$759M
+109%
$363M
($355M)
($601M)
($1,372M)
FY17 FY18 FY19
Adjusted Net Revenue Segment Adjusted EBITDA
Note(s): (1) According to company filings
45Uber Eats Is Far Less Efficient Than Online Food Delivery Peers
Uber Eats(1) Just Eat Takeaway.com(1)(2)
$1,383M +82% €1,584M +28%
Growth Growth
$759M €1,227M
$363M
€917M
($355M)
($601M)
€159M €188M €217M 14%
(99%) Margin
($1,372M)
Margin
FY17 FY18 FY19 FY17 FY18 FY19
Adj. Net Revenue Segment Adj. EBITDA Revenue Adjusted EBITDA
Delivery Hero(1) Grubhub(1)
+90%
1,400 €1,230M $1,312M +30%
Growth Growth
900 $1,007M
€646M
€391M $683M
400
(100) $234M 14%
(€83M) $184M $186M
(€100M) Margin
(35%)
(600) (€431M)
FY17 FY18 FY19 Margin FY17 FY18 FY19
Revenue Segment Adj. EBITDA Revenue Adj. EBITDA
Note(s): (1) According to company filings; (2) Pro forma for 10bis, DHER Germany, and Just Eat transactions
46Gross Margin Accounting Needs to Be Normalized
Uber Eats’ Gross Profit Build(1)
Gross Bookings
(-) Sales Taxes
(-) Restaurant Earnings
(-) Driver Earnings
(-) Driver Incentives
(-) Market-Wide Promotions
Revenue Uber’s segment-level
(-) Excess Driver Incentives (‘EDI’) disclosures stop at
(-) Driver Referrals
Adjusted Net Revenue
Adjusted Net Revenue, so
(-) Cost of Sales (excl. EDI) investors mistakenly
Credit Card Fees equate Adjusted Net
Chargebacks
Hosting Revenue with Gross Profit
Insurance
(-) End-User Discounts, Promos, Refunds, Loyalty
Included in S&M
(-) Operations and Support Costs
Customer Support
Restaurant Support
Driver Support / Logistics Operations
Gross Profit
Note(s): According to company filings and CRC estimates
47Uber Financials Highlight Questionable Economics of Uber Eats
FY19 Consol. Uber Gross Profit(1) FY19 Segment-Level Profitability(1)
$12,897M ($6,060M) Rides Eats
$10,622M
$262M $7,099M ($2,500M) Eats gross margin likely
21.4% much lower than
Margin consolidated gross margin
($1,834M)
$2,071M
$2,765M $1,383M
($1,372M)
ANR CoR Other Reported Promos O&S True
GP & Refunds GP Adjusted Net Revenue Segment Adjusted EBITDA
Uber Eats Could Have Zero or Negative Gross Profit
Note(s): (1) According to company filings and CRC’s definition of gross profit, ANR represents Adjusted Net Revenue, CoR represents
Cost of Revenue (excl. Excess Driver Incentives), O&S represents Operations and Support Costs 48Appendix B:
Why is the hybrid model superior
to logistics-only?
49Online Food Delivery Framework
Best Consumer Proposition Wins
50Online Food Delivery Consumer Proposition
Selection
Fees
User Experience
51Survey Data Supports This Conclusion
Most Important Features of Takeaway Apps(1)
Most important features in deciding Most important features that would
which takeaway app to use… encourage consumers to order more…
% of Respondents % of Respondents
40%
30%
32%
22%
21%
12%
9% 12%
7%
8%
7%
Restaurant Ease of use Low fees Short Accurate Order Lower fees Better Shorter delivery Higher quality More accurate
selection delivery delivery tracking restaurant time of service delivery time
times times selection
Note(s): (1) According to RBC consumer survey (May 2018), based on responses from consumers in the UK, results summarized by CRC
52Hybrid Model Dominates Logistics-Only on Customer Proposition
Hybrid Logistics-Only
Selection
Fees
UX
53Especially in Markets With Lots of Marketplace Restaurants
Marketplace Restaurants as % of Total(1)(2)
More Marketplace Restaurants More Logistics Restaurants
70%
64%
DE statistics
60% depressed due to 56%
low penetration of
53%
50% leading marketplace
platform
40% 37% 36% 36% 35%
30%
30%
24%
20% 18%
13% 12%
10%
10% 7% 7% 6%
-
DE NL UK NYC AU FR US CA
% of Limited Service Restaurants* % of Total Restaurants
_____________
*Limited Service Restaurants include restaurants with historically higher delivery demand
Note(s): (1) Marketplace restaurants based on marketplace restaurant count of leading marketplace platform according YipitData and CRC estimates; (2)
Limited-Service restaurants and Total Restaurants according to Euromonitor International, Total Restaurants equivalent to sum of Limited-Service Restaurants
and Full-Service Restaurants 54No Coincidence That Incumbent Marketplaces Clearly Lead in
Geographies With Lots of Marketplace Restaurants
LTM Google Search Frequency Share(1)
More Marketplace Restaurants More Logistics Restaurants
100%
90%
80%
70%
60%
50%
40%
30%
20%
10%
-
DE NL UK NYC AU FR US CAD
CA
Leading Marketplace Platform Logistics Platform #1 #2 #3
Note(s): (1) According to Google Trends as of 9/21/2020
55Restaurants Choose Marketplace for Several Reasons
1 Need to service direct orders with no commission
2 Pay lower commissions through marketplace
Labor is fungible (and often cheaper!) – utilize waiters, cooks,
3 and family members for delivery, often paying them “under the
table”, potentially below minimum wage
4 Control customer experience and interaction
High population density makes delivery economic for
5 restaurants
56Marketplace Selection Continues to Increase
Number of Marketplace Restaurants(1)(2)
United Kingdom Netherlands NYC Metro
Based on JE marketplace restaurants Based on TKWY marketplace restaurants Based on GRUB marketplace restaurants
40k 9k 14k
35k 8k
12k
7k
30k
10k
6k
25k
5k 8k
20k
4k 6k
15k
3k
4k
10k
2k
5k 2k
1k
- - -
Note(s): (1) According to YipitData as of July 2020; (2) JE and TKWY marketplace restaurant counts based on YipiData and CRC
estimates 57Logistics-Only Competitors Acknowledge Superiority of Hybrid
Deliveroo, June 2018
Uber Eats, February 2019
58But Hybrid Initiatives Have Failed to Gain Traction
United Kingdom
Competitor 1 Executive, May 2020
“[Competitor 1] launched Marketplace+ in the UK in mid-2018, but over 2 years, marketplace orders
have reached just ~10% of [Competitor 1]’s orders.”
Former Competitor 2 Executive, March 2020
“BYOC represents a relatively small number of restaurants in the UK, and I’d guess a low-single-
digit percentage of orders.” [Note: [Competitor 2] BYOC orders actually include orders delivered by
[Competitor 2]]
Netherlands
Former Competitor 1 Executive, September 2020
“[Competitor 1] launched BYOC in the Netherlands in early 2019, but it hasn’t gone anywhere.”
United States / New York
Former Competitor 1 Executive, June 2020
“[Competitor 1] hasn’t really made any progress in developing a marketplace offering.”
59Data Shows Incumbents Have Dramatically Better Hybrid Proposition
Number of Marketplace Restaurants(1)(2)
United Kingdom Netherlands NYC Metro
40k 9k 14k
35k 8k
12k
30k 7k
10k
6k
25k
5k 8k
20k
4k 6k
15k
3k
4k
10k 2k
5k 1k 2k
- - -
Jan-19
Jan-18
Jan-19
Jan-20
Jan-18
Jan-20
May-18
Sep-18
May-19
Sep-19
May-20
May-18
Sep-18
May-19
Sep-19
May-20
Jan-18
Jan-19
Jan-20
May-18
Sep-18
May-19
Sep-19
May-20
JE Competitor 1 TKWY Competitor 1 GRUB Comp 1
Comp 2
Note(s): (1) According to YipitData as of July 2020; (2) JE and TKWY marketplace restaurant counts based on YipiData figures and CRC
estimates 60Why New Entrants Fail to Build Marketplace
1 Restaurants have limited driver and cook capacity
2 Deep dependence on relationship with #1 player
Focus on driving direct orders vs. additional
3 aggregator orders
Operational complexity of operating multiple
4 platforms
61Competitors Acknowledge Difficulty of Competing
UK Competitor 1 Executive, May 2020
“There’s a real challenge in scaling up the marketplace
business because of Just Eat’s position, and the challenge is
more on the consumer side than on the restaurant side.
The challenge we have at [UK Competitor 1] is that Just Eat
owns the towns and cities where marketplace restaurants
are more prevalent. The only way to expand in these areas is to
do it in a really aggressive, unsustainable way – use heavy
promotions, spend a ton on marketing, etc.
A consumer has been ordering from the same restaurant on Just
Eat for the past 10 years, they’re likely to go back to Just Eat
after using a voucher from [UK Competitor 1].”
62Network Effects Create Sustainably Strong Business
More
Consumers
More More
Investment Restaurants
More More
Consumers Consumers
More
Marketing
But only when you offer the best selection…
1 JE didn’t offer the best selection in Australia / New Zealand, France, and Central London
2 GRUB (and Uber Eats) didn’t offer the best selection outside of core Tier 1 markets in the US
63Mature Markets Are Harder to Disrupt
Online Food Delivery Math
Mature Market (e.g. UK) Immature Market (e.g. US)
Example with 20% Initial Market Growth(1) Example with 50% Initial Market Growth(1)
(w/ Equal Split of Net Adds) (w/ 40/60 Split of Net Adds in Favor of Challenger)
350 New 700 New
Customers Customers
300 600
Number of Customers
Number of Customers
250 500
125
180 325
200 400
450
New
150 Customers 300
New
100 20 35 200 Customers
25 175
50 55 275
50 85 100 25
75
75 95
- -
t t+1 t + 10 t t+1 t + 10
Leader Challenger Leader Challenger
Leader Remains Much Larger Challenger Overtakes Leader
After 10 Years After 10 Years
Note(s): (1) According to CRC estimates
64Online Food Delivery Math Is Supported by High Customer Retention
Customer Stickiness Means Competition is Focused on New Users,
Which Are Harder to Find in Mature Markets
Note(s): According to TKWY February 2020 investor presentation
65Hungryhouse Case Study
Former Just Eat Executive, January 2019
“Hungryhouse couldn’t compete because we had far more
restaurants and better brand awareness. Even though they spent
a lot of money on vouchering and free commissions, they still
weren’t able to combat the network effects we had.
People maybe placed one order with them because of a voucher,
but then they went back to Just Eat because the selection was
better.
It’s hard to get the flywheel going, particularly on the demand
side. A £5 voucher doesn’t work. Eventually the restaurants
you’ve signed wonder why they should bother with another
platform because they’re not getting many orders.”
66Dozens of Examples of Failed Attempts to Disrupt Strong Incumbents
Company Countries Date of Exit
Dine In UK Nov-15
Valk Fleet UK Apr-16
Delivery Cube UK Apr-16
Take Eat Easy BE, FR, UK Jul-16
Just Eat BE, LU, NL Aug-16
Takeaway.com UK Aug-16
Pronto UK Sep-16
Jinn UK Oct-17
Takeaway.com FR Feb-18
Hungryhouse UK Feb-18
foodora AU, FR, IT, NL Aug-18
Delivery Hero BR Sep-18
Amazon Restaurants UK Nov-18
Uber Eats AT Feb-19
foodora AT Feb-19
Amazon Restaurants US Jun-19
Deliveroo DE Aug-19
Glovo EG, PR, TU, UY Jan-20
foodora CA Apr-20
Uber Eats CZ, EG, HN, RO, SB, UA, UY May-20
67Logistics Grew Faster In the Past Five Years by Expanding the Market
Emergence of
Logistics
Marketplace Only
68Logistics Opened Untapped Demand
Marketplace Takeaway / self-delivery restaurants
vs.
Logistics Chains/QSRs & high-end restaurants
69Incumbents Chose Different Strategies
Grubhub Just Eat Takeaway.com
Modest investment in Late to introduce logistics, Built in-house delivery
nationwide delivery followed by outsourced capability across all
capability and scattered approach countries
Continued focus on Continued focus on Focused on areas with
growing EBITDA per growing short-term greatest competitive risk
order EBITDA and selection
improvement
Offered delivery with no
fee to create best
consumer proposition
Focus on Focus on
Short-Term Market
Profits Leadership
70Takeaway.com Now Applying Its Strategy to Just Eat
1 Offer the best consumer proposition
2 Focus on market leadership ➔ LT profit will come
Run the business like an owner – focus on details of
3 execution
Same Formula Planned for Grubhub
71Conclusions
1 Best consumer proposition wins
2 Hybrid model offers best consumer proposition
JET has proven strategy for winning with hybrid
3 model
72Appendix C:
How strong is JET’s position in the UK?
73Just Eat Starting From Very Strong Position in the UK
UK Order Market Share(1)
Google Trends Share(1) Email Receipt Share(1)(2)
66% 66%
64%
57%
25%
21%
17% 18% 19% 18%
15% 13%
Overall Ex-London Overall Ex-London
Just Eat Deliveroo Uber Eats Just Eat Deliveroo Uber Eats
Note(s): (1) According to Google Trends, based on LTM search frequency as of 9/21/20; (2) According to YipitData, based on LTM orders
through July 2020 74Clear Path to Even Stronger Market Position in the UK
Competitor Major Exposure Solution
Aggressively expand
London selection
London(1) Reduce fees
Increase marketing
Rollout MCD across UK
Aggressively expand
London(1) London selection
+ McDonald’s(2) Reduce fees
Increase marketing
Dim Future Prospects for Deliveroo and Uber Eats in the UK
Note(s): (1) According to CRC discussions with former executives; (2) According to YipitData
75Appendix D:
What is necessary to improve GRUB’s
position in the US?
76Negative Initial Market Reaction to GRUB Deal
JET Share Price(1)
€105
Before deal
announcement
100
95
-18%
1-Week
Return
90
85
80
75
Note(s): (1) According to S&P Capital IQ
77JET Valuation Now Seems to Embed Negative Value for GRUB
JET Value Loss
Historical Current
TEV / TEV / Value
Revenue Revenue Lost
NTM Revenue(1) €4.2B €4.2B €4.2B
x TEV / Revenue (2) 8.0x 4.6x (3.4x)
TEV €33.4B €19.4B (€14.0)B
(-) Net Debt and Other (3) 1.0 1.0 -
Market Cap(4) €34.3B €20.3B (€14.0)B
Note(s): (1) According to CRC estimates, revenue for JET + GRUB; (2) According to Bloomberg, unadjusted for ownership stake in iFood;
(3) Includes value associated with ownership stake in iFood (valued at €1bn); (4) According to S&P Capital IQ as of 9/24/2020 78GRUB Has a Long History of Profitable Growth
GRUB Summary Financials(1)
$1,312M
$1,007M
$683M
$493M
$362M
$254M $234M
$170M $184M $186M
$119M $144M
$79M $104M
$10M $40M
FY12PF (2) FY13PF (2) FY14 FY15 FY16 FY17 FY18 FY19
Revenue Adjusted EBITDA
Note(s): (1) According to company filings; (2) Pro forma for Grubhub / Seamless merger
79GRUB Seems to Be Loathed by Investors Nevertheless
Persistently High Short Interest Depressed Valuation vs. Peers
GRUB Share Price and Short Interest Ratio(1) TEV / CY20e GP(1)(2) vs. 1H20 Org Rev Growth(3)
160 35% 35x 120%
32x
30x 100%
140
30% 30x
80%
120
1H20 Organic Revenue Growth
25% 25x
Share Price ($ per share)
TEV / CY20e Gross Profit
60%
21x
Short Interest Ratio
100
20% 20x 19x 19x
40%
80
16x
15% 15x 20%
14x
60
-
10% 10x 9x
40 8x
(20%)
5% 5x
20
(40%)
- - - (60%)
(4)(5) (4)(5)(6)
Short Interest Ratio Share Price
Note(s): (1) Share price and capitalizations according to S&P Capital IQ as of 9/4/2020, (2) Estimates according to Visible Alpha as of 9/4/2020; (3) According
to company filings; (4) TEV adjusted for ownership stake in iFood (valued at €1bn); (5) Gross profit based on CRC estimates, (6) Gross profit adjusted to align
with JET reporting 80The Reason Is Clear – Historical Share Loss
Note(s): According to Second Measure
81GRUB Has Lost Share for Three Key Reasons
GRUB grew profits while competitors maximized
1 investments
GRUB failed to invest in expanding selection (e.g. late
2 to add chains, late to add non-partnered restaurants)
GRUB failed to invest in expanding coverage (e.g. late
3
to expand to greenfield suburban areas)
82GRUB Had A Selection Disadvantage Until Recently
Number of Restaurants(1)
450,000
400,000
350,000
300,000
250,000
200,000
150,000
100,000
50,000
-
GRUB Competitor 1 Competitor 2 Competitor 3
Note(s): (1) According to YipitData
83GRUB Has Been Far Less Promotional Historically
Promotional Activity(1)
Free Delivery Promos Food Discount Promos
Free Delivery Orders as % of Total Discounted Orders as % of Total
90% 35%
80%
30%
70%
25%
60%
50% 20%
40% 15%
30%
10%
20%
5%
10%
- -
GRUB - MD Only Competitor 1 Competitor 2 GRUB - MD Only Competitor 1 Competitor 2
Note(s): (1) According to YipitData, ‘GRUB - MD Only’ only includes GRUB’s owned-delivery orders
84None of These Drivers of Share Loss Are Permanent
Problem Solution
Profit Invest Aggressively
Add Chains
Selection Add Non-Partnered Restaurants
Attack Suburbs
Coverage Especially Around Core Markets
85GRUB Actually Has Structural Competitive Advantages in Core Markets
Hybrid
Marketplace + Logistics
Logistics
Logistics
86Hybrid Model Offers Better Selection, Pricing, and Profit
Marketplace offers restaurants with proven
Selection consumer demand
Marketplace delivery fees are lower
Pricing
Marketplace orders have established profitability
Profit
87GRUB Has Two Distinct Segments of Its Business
Core Leading Markets Other Markets
New York Los Angeles
Chicago Dallas-Forth Worth
Philadelphia Houston
Boston Miami
High Margin Lower Margin
#1 Position #2/3 Position
~2/3 of Orders ~1/3 of Orders
Note(s): According to CRC estimates
88Food Delivery Is Local, GRUB Has Strong Positions in Its Core
Geographies
LTM Google Trends Share in Key Cities
53%
40%
38% 38%
29% 30%
28%
24% 24%
22%
20%
17%
10% 10% 10%
7%
New York Chicago Philadelphia Boston
Grubhub DoorDash Uber Eats Postmates
Note(s): Based on Google Trends city-level data over the past 12 months (6/10/20)
89GRUB Has the Best Consumer Proposition In Its Core Markets
Average Delivery Fee(1) Marketplace Restaurants(1)
NY Metro – Example NY Metro – Example
$6.82
11,449
$4.82
$4.53
N/A
$1.63
1,976
86 - -
GRUB Competitor Competitor Competitor Competitor GRUB Competitor Competitor Competitor Competitor
1 2 3 4 1 2 3 4
Note(s): (1) According to YipitData as of February 2020
90Appendix E:
What are the best data sources?
91Many Data Sources for Tracking Online Food Delivery
92Results Often Conflict
Google Trends Share(1) App DAU Share(2)
#1 Position
53%
51%
#2 Position
33%
29%
18%
16%
SkipTheDishes Uber Eats DoorDash SkipTheDishes Uber Eats DoorDash
Note(s): (1) According to Google Trends as of 9/21/2020, based on YTD 2020 search frequency; (2) According to app data vendor as of
9/21/2020, based on YTD 2020 daily active users 93Common Data Reliability Issues
1 App vs. desktop measurement
2 Small or unrepresentative sample
3 Ride-sharing or grocery vs. restaurant delivery
Limited history or unproven correlation to business
4 metrics
94We Have Found Google Trends to Be One of the Most Reliable Sources
1 Proven utility across all markets
2 Massive, ubiquitous sample
3 Robust historical data
4 Consistent measurement across geographies
5 Natural correlation to brand strength and gross adds
95Disclaimer
The author of this deck, Cat Rock Capital Management LP (“Cat Rock Capital”), is a private fund manager. This deck, and its content, distribution and use, is subject to the terms specified at
www.JustEatDoesDeliver.com.
At the time of publication this deck, funds and accounts managed by Cat Rock Capital are is long 6.8 million shares of Just Eat Takeaway.com N.V. (LSE: JET) (AMS: TKWY) (the
“Company”). It is possible that there will be developments in the future that cause Cat Rock Capital to modify this economic interest at any time or from time to time. This may include a
decision to sell all or a portion of its holdings of such securities in open market transactions or otherwise (including via short sales), purchase additional such securities (in open market or
privately negotiated transactions or otherwise) or trade in options, puts, calls or other derivative instruments relating to such securities. Cat Rock Capital also reserves the right to take any
actions with respect to its investment in the Company as it may deem appropriate, including, but not limited to, communication with the board of directors, management and other investors.
Cat Rock Capital is publishing this deck solely for the information of other shareholders in the Company. This deck is not intended to be and does not constitute or contain any investment
recommendation as defined by Regulation (EU) No 596/2014. No information in this deck should be construed as recommending or suggesting an investment strategy. Nothing in this deck
or in any related materials is a statement of or indicates or implies any specific or probable value outcome in any particular circumstance. This deck is provided merely for general
informational purposes and is not intended to be, nor should it be construed as (1) investment, financial, tax or legal advice, or (2) a recommendation to buy, sell or hold any security or other
investment, or to pursue any investment style or strategy. Neither the information nor any opinion contained in this deck constitutes an inducement or offer to purchase or sell or a
solicitation of an offer to purchase or sell any securities or other investments in the Company, Takeaway or any other company by Cat Rock Capital or any fund or other entity managed
directly or indirectly by Cat Rock Capital in any jurisdiction. This deck does not consider the investment objective, financial situation, suitability or the particular need or circumstances of any
specific individual person who may access or review this deck and may not be taken as advice on the merits of any investment decision. Any person who is in any doubt about the matters to
which this deck relates should consult an authorised financial adviser or other person authorised under the UK Financial Services and Markets Act 2000. To the best of Cat Rock Capital’s
ability and belief, all information contained herein is accurate and reliable, and has been obtained from public sources that Cat Rock Capital believes to be accurate and reliable. However,
such information is presented “as is”, without warranty of any kind, whether express or implied. All expressions of opinion are subject to change without notice, and Cat Rock Capital does
not undertake to update or supplement any of the information, analysis and opinion contained herein.
This deck contains certain forward-looking statements and information that are based on Cat Rock Capital’s beliefs as well as assumptions made by, and information currently available to,
Cat Rock Capital. These statements include, but are not limited to, statements about strategies, plans, objectives, expectations, intentions, expenditures and assumptions and other
statements that are not historical facts. When used herein, words such as “anticipate,” “believe,” “estimate,” “expect,” “intend,” “plan” and “project” and similar expressions are intended to
identify forward-looking statements. These statements reflect our current views with respect to future events, are not guarantees of future performance and involve risks and uncertainties
that are difficult to predict. Further, certain forward-looking statements are based upon assumptions as to future events that may not prove to be accurate. Actual results, performance or
achievements may vary materially and adversely from those described herein. There is no assurance or guarantee with respect to the prices at which any securities of the Company,
Takeaway or any other company will trade, and such securities may not trade at prices that may be implied herein. Any estimates, projections or potential impact of the opportunities
identified by Cat Rock Capital herein are based on assumptions that Cat Rock Capital believes to be reasonable as of the date hereof, but there can be no assurance or guarantee that
actual results or performance will not differ, and such differences may be material and adverse. No representation or warranty, express or implied, is given by Cat Rock Capital or any of its
officers, employees or agents as to the achievement or reasonableness of, and no reliance should be placed on, any projections, estimates, forecasts, targets, prospects or returns
contained herein. Any historic financial information, projections, estimates, forecasts, targets, prospects or returns contained herein are not necessarily a reliable indicator of future
performance. Nothing in these materials should be relied upon as a promise or representation as to the future.
In relation to the United Kingdom, this deck is directed only at, (i) investment professionals specified in Article 19(5) of the Financial Services and Markets Act 2000 (Financial Promotion)
Order 2005 as amended (the “Order”), (ii) high net worth entities, and other persons to whom it may lawfully be communicated, falling within Article 49(2)(a) to (d) of the Order or (iii) persons
to whom an invitation or inducement to engage in investment activity (within the meaning of section 21 of the Financial Services and Markets Act 2000) in connection with the issue or sale of
any securities of the Company or any member of its group may otherwise lawfully be communicated or caused to be communicated (all such persons together being referred to as
“Permitted Recipients”). Persons who are not Permitted Recipients must not act or rely on the information contained in this deck. This deck does not address the merits of the transaction
from the point of view of stockholders of Grubhub Inc..
The distribution of this deck in certain countries may be restricted by law and persons who access it are required to inform themselves and to comply with any such restrictions. Cat Rock
Capital disclaims all responsibility where persons access this deck in breach of any law or regulation in the country of which that person is a citizen or in which that person is residing or is
domiciled. Cat Rock Capital is subject to supervision by, and registered with, the U.S. Securities and Exchange Commission.
96You can also read