Investor Presentation - Perry Sook, Chairman, President & CEO Tom Carter, EVP & CFO September 2016
←
→
Page content transcription
If your browser does not render page correctly, please read the page content below
Investor Presentation
                   Perry Sook, Chairman, President & CEO
Keeping it Local   Tom Carter, EVP & CFO
 NXST: NASDAQ
                   September 2016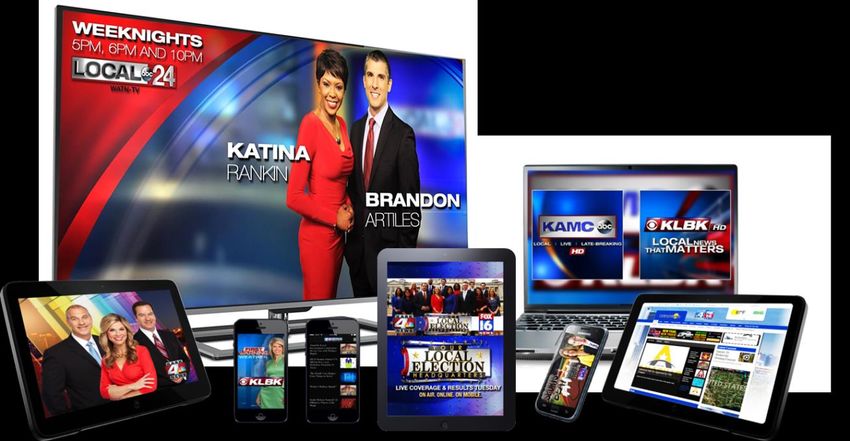
Safe Harbor
Forward-Looking Statements
This communication includes forward-looking statements. We have based these forward-looking statements on our
current expectations and projections about future events. Forward-looking statements include information preceded by,
followed by, or that includes the words "guidance," "believes," "expects," "anticipates," "could," or similar expressions.
For these statements, Nexstar and Media General claim the protection of the safe harbor for forward-looking
statements contained in the Private Securities Litigation Reform Act of 1995. The forward-looking statements contained
in this communication, concerning, among other things, the ultimate outcome and benefits of a transaction between
Nexstar and Media General and timing thereof, and future financial performance, including changes in net revenue,
cash flow and operating expenses, involve risks and uncertainties, and are subject to change based on various important
factors, including the timing to consummate the proposed transaction; the risk that a condition to closing of the
proposed transaction may not be satisfied and the transaction may not close; the risk that a regulatory approval that
may be required for the proposed transaction is delayed, is not obtained or is obtained subject to conditions that are
not anticipated, the impact of changes in national and regional economies, the ability to service and refinance our
outstanding debt, successful integration of Media General (including achievement of synergies and cost reductions),
pricing fluctuations in local and national advertising, future regulatory actions and conditions in the television stations'
operating areas, competition from others in the broadcast television markets, volatility in programming costs, the
effects of governmental regulation of broadcasting, industry consolidation, technological developments and major
world news events. Nexstar and Media General undertake no obligation to update or revise any forward-looking
statements, whether as a result of new information, future events or otherwise. In light of these risks, uncertainties and
assumptions, the forward-looking events discussed in this communication might not occur. You should not place undue
reliance on these forward-looking statements, which speak only as of the date of this release. For more details on
factors that could affect these expectations, please see the definitive joint proxy statement/prospectus of Nexstar and
Media General and Media General’s and Nexstar’s other filings with the SEC.

                                                                                                                          2
Keeping it Local/Driving Diversification
Local Diversified Media Company with Leading Broadcast Television and Digital Media Properties
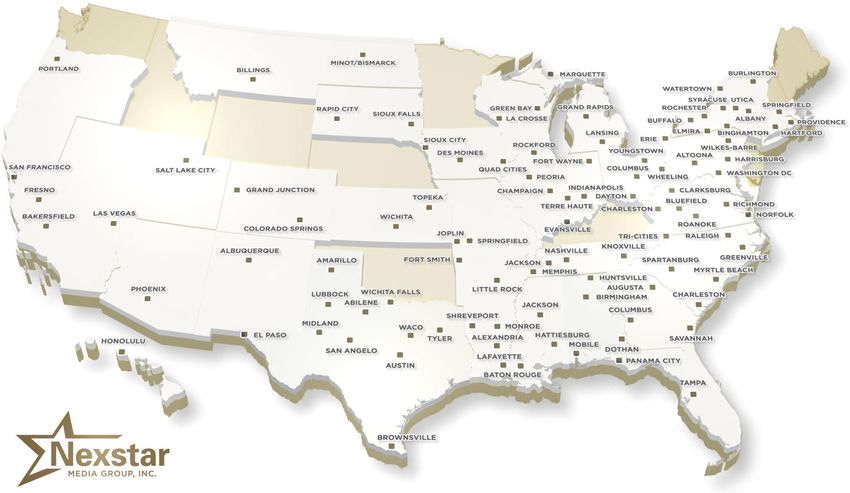
104 Full Power 37 Duopoly +1,640 Weekly 60+ Community
TV Stations Markets Local News Hours Web Portals
62 Markets ~18.1% U.S. ~80% “Big 4” Profitable Digital
25 States TV HHs Network Affiliates Media Businesses
Nexstar has the #1 or #2 Revenue Share Ranking in 70% of its Markets
~67% of Pro-forma Broadcast Cash Flow (BCF) is from Top 100 DMAs
Stable Core Advertising Revenue and Growing Political Advertising Revenue
Growing High Margin Non-Traditional Revenue Streams
– Retransmission Agreements
– Digital Media (Community Portal, Mobile, Other Digital Platforms)
• FY15 digital media and retransmission fee revenue of $387.9 mm increased 92.4% over prior year
level and accounted for 43.3% of net revenue
3
Recent Key Operating Events
Record Financial Results
3M Ended June 30 6M Ended June 30
(in millions) (in millions) 3M Change (%) 6M Change (%)
2016 2015 2014 2016 2015 2014 ‘16 vs. ‘15 ‘16 vs. ‘14 ‘16 vs. ‘15 ‘16 vs. ‘14 Last
Even-Year
Net Revenue $262.0 $219.3 $146.9 $517.7 $421.1 $280.8 +19.5% +78.4% +22.9% +84.4% Political
Broadcast Cash Flow $201.3 $161.1 $109.3 +20.8% +75.8% +25.0% +84.2% Cycle
$103.2 $85.4 $58.7
Adjusted EBITDA $90.2 $74.9 $49.6 $172.5 $138.9 $91.7 +20.4% +81.9% +24.2% +88.1%
Free Cash Flow (FCF) $48.7 $50.1 $30.4 $100.8 $93.0 $55.6 (2.8%) +60.2% +8.4% +81.3%
Entered into definitive agreement to acquire Media General (NYSE: MEG) for $4.6bn in accretive cash and stock
transaction on Jan. 27, 2016
– Compelling combination delivering immediate and long-term value to shareholders of both companies
Seventeen accretive strategic transactions 2011-2016 YTD (excluding pending Media General acquisition)
– Transactions increase scale, present significant synergies and expand FCF
– Acquired stations diversify/complement station portfolio in terms of geography and market size
Ongoing reduction in cost of capital and deleveraging
– Weighted average cost of debt ~5.0% at June 30, 2016
– Reduced net leverage covenant ratio to 3.99x at June 31, 2016 from 4.32x at Dec. 31, 2015
2016 cash dividend increase of 26.3% to $0.96 annually, marking third annual consecutive rise of cash dividend
– 100% compound annual growth in payout level since initiation of cash dividend in 2013
– Represents a modest payout ratio relative to FCF generation
– Returned over $2.34 per share to shareholders in 2015 through cash dividend and share repurchases
4
Strong Industry Fundamentals
BIA Kelsey: Local Video Ad Revenue Projected Local Broadcast TV Large-Scale Reach, Greatest Share of
Projected Distribution Across Media (%) Core Ad Revenue (Ex-Political, $ billions) Viewership and Superior Engagement
Mobile Video 2%
SNL Kagan BIA Kelsey
Online Video 3% 85%
OOH* Video 5% 25.0 25.4 TV’s U.S. household reach; more
24.0 23.3 people than any other medium
2016 Local Cable 23% 23.3 22.3 22.6 23.1
21.7 21.8
Local TV 68%
35%
U.S. household viewing generated
Mobile Video 4% by broadcast stations / groups
Online Video 5%
OOH* Video 5%
93
2020 Local Cable 21% Of the Top 100 rated programs
are broadcast programs (P18-49)
Local TV 66%
2016 2017 2018 2019 2020 Note: Based on 2014-2015 season NTI Live+ Same Day estimates. Ranked by average
audience % (ratings); in the event of a tie, impressions (000’s) are used as a tiebreaker.
Source: BIA Kelsey (May 2016) *OOH = Out of home Source: SNL Kagan (May 2015), BIA Kelsey (May 2016) Source: TVB, The Nielsen Company, 9/22/14-5/20/15, Ranked by A18-49
Traditional TV remains the dominant reach medium and most influential of all media among American consumers, despite
the proliferation of video content available across other platforms
In Q1 2016, TV dominated video viewing with a 94% share, as compared with watching video on the internet (5%) and
watching video on a Smartphone (1%)
Local TV captures the largest share of local video ad revenue; projected stable core revenue trends (ex-pol.) through 2020
Local media companies continue to leveraging digital / mobile technology to monetize the full value of their content
Source: Nielsen Total Audience Report 1Q 2016, BIA Kelsey (May 2016), SNL Kagan (May 2015)
5
Facts: OTT/Streaming Data Caps and Millennial Video Viewership
According to the WSJ, some consumers are canceling Nielsen Research confirms that millennial’s total TV
their streaming services to avoid significant overage viewing changes through life stages
fees associated with exceeding data caps
Streaming on a Home Network Can Quickly Incur Overage Costs Facts about Millennial Life Stages / Video Viewership
1hr of Netflix on Roku ~1,020MB Dependent Adults
STAGE 1: Living in someone else’s home
1hr of YouTube on Laptop ~792MB Daily Time Spent (H:MM)
Live TV 2:32
TV Connected Device 1:11
Streaming Netflix on iPad ~838MB Total TV 3:44
Streaming Spotify on Phone ~45MB On Their Own
STAGE 2: Living in their own home without kids
Daily Time Spent (H:MM)
Source: The Wall Street Journal Test via PeakHour App. Live TV 2:06
TV Connected Device 1:32
Select U.S. Broadband Caps / Overage Fees By Provider Total TV 3:38
Starting a Family
ISP CAP OVERAGE COSTS STAGE 3: Living in their own home with kids
AT&T 150GB or 250GB $10.00 fee for 50GB more Daily Time Spent (H:MM)
Live TV 3:16
Cable One 300GB - 500GB None. Encouraged to move to higher tier
TV Connected Device 1:23
CenturyLink 150GB - 250GB None. Encouraged to move to higher tier Total TV 4:40
Charter 100GB - 500GB None. You are cut off The average person 18-34 spent two hours and 45 minutes watching live
Comcast 300GB Testing fee of $10.00 for 50GB more TV, and one hour and 23 minutes using TV-connected devices for total
viewing of four hours and eight minutes
Cox 50GB - 400GB None. Encouraged to move to higher tier
Young families have the greatest MVPD penetration, share of TV
MediaCom 250GB - 999GB $10.00 fee for 50GB more
viewership and spend the most time at home among the three groups
Suddenlink 150GB - 350GB $10.00 fee for 50GB more after 3rd time
Source: Gryta, Thomas and Ramachandran, Shalini . “Broadband Data Caps Pressure Chord Cutters” The Wall Street Journal 21, Source: Nielsen Total Audience Report 4Q 2015
April, 2016.
6
Near term Drivers: Political and Retransmission Consent Fees
Local Broadcast TV Political Ad Revenue Growth SNL Kagan: Projected Broadcast Retrans Growth
($ billions) ($ billions)
$11.2
Presidential Election Gross Retransmission Revenue $10.6
$3.3-3.6 $10.1
Mid-Term Election $9.4
$8.6
$2.9 $7.7
$6.4
$2.1 $2.0
$4.9
$1.5
$3.6
$2.4
2008 2010 2012 2014 2016 PJ 2012 2013 2014 2015 2016 2017 2018 2019 2020 2021
Source: CMAG / PJ=Industry Sources / Cook Report Source: SNL Kagan, S&P Global Market Intelligence June 2016
Record political spending is projected to 2016 Despite the rise in retransmission consent revenue, a
Between 75% and 85% of political advertising dollars significant value gap remains between audience viewership
allocated to TV are spent on local broadcast stations and distribution fee share
Presidential spending on local TV stations grew ~60% in Broadcast stations generate ~35% of household viewing,
2012 (from the conventions to Election Day), compared yet in aggregate received on average ~12% of the total
with 2008 levels distribution revenue
PACs / Super PACs are contributing to growing political ad Expect strong growth in retrans to continue for next 6-9
spend years
7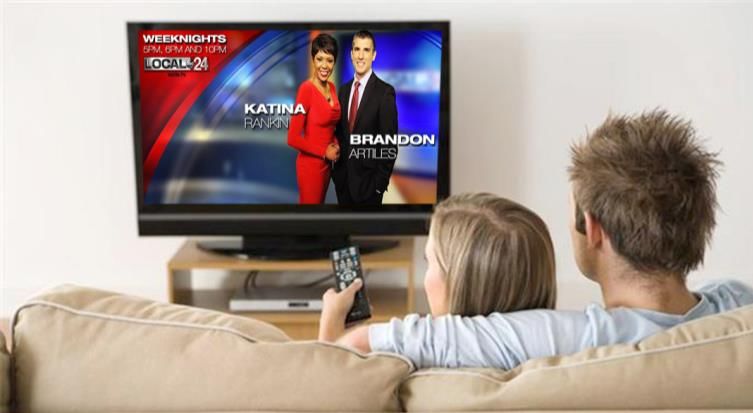
Growth in NXST Political and Issue Advertising
NXST Political Ad Revenue Growth NXST 2016 Political
($ millions) Key Senate and Gubernatorial Elections
Even Year Odd Year 2016 Senate Races 2016 Gubernatorial Races
CAGR: 25% 2008-2014 CAGR: 29% 2009-2015 Nexstar Market Incumbent Party Nexstar Market Incumbent Party
Alabama Ricahrd Shelby R Indiana Mike Pence R
$64.3 $12.7
Arizona John McCain R Missouri Jay Nixon D
Arkansas John Boozeman R Montana Steve Bullock D
$46.3
California Barbara Boxer D Utah Gary Herbert R
$39.3
$32.9 Colorado Michael Bennet D Vermont Peter Shumlin D
$5.9 $6.3
$5.2 Florida Marco Rubio R
Illinois Mark Kirk R
Indiana Dan Coats R
Iowa Chuck Grassley R
Louisiana David Vitter R
2008A 2010A 2012A 2014A 2009A 2011A 2013A 2015A
Maryland Barbara Mikulski D
With rampant political partisanship and a 2016 presidential Missouri Roy Blunt R
election without an incumbent, NXST saw initial primary Nevada Harry Reid D
New York Chuck Schumer D
dollars late in 2015 given its presence in key political
Pennsylvania Pat Toomey R
markets
Utah Mike Lee R
Nexstar expects to generate ~$100 mm of political Vermont Patrick Leahy D
revenues in FY 2016 Wisconsin Ron Johnson R
Long-term political spending expected to continue to grow 1 Barbara Boxer is retiring in 2016.
due to significant spending increases by non-candidate Source: U.S. Senate Periodical Press Gallery
entities
8
Growth in NXST Retransmission and Digital Media Revenue
Retransmission and Digital Media revenue is materially diversifying NXST’s total net revenue
NXST Retransmission & Digital Media Revenue NXST Retransmission Revenue ($ millions) $298.0
(% of Total Net Revenue)
Retransmission Revenue as a % of Total Net Revenue $155.0
10.0%
$101.1
Digital Media Revenue as a % of Total Net Revenue $60.9
$24.3 $30.0 $37.4
$11.8 $14.4
7.4%
2007 2008 2009 2010 2011 2012 2013 2014 2015
6.1%
4.9% NXST Digital Media Revenue ($ millions) $89.9
5.3%
4.6% 4.4%
3.6% $46.7
1.9% $30.8
$11.7 $13.8 $16.2 $18.4
$5.1 $10.2
4.4% 5.1% 9.6% 9.6% 12.2% 16.1% 20.1% 24.5% 33.2%
2007 2008 2009 2010 2011 2012 2013 2014 2015 2007 2008 2009 2010 2011 2012 2013 2014 2015
NXST led industry in securing retransmission consideration beginning in 2005
Acceleration in retransmission revenue post-contract renewal cycle highlights ability to negotiate favorable rates which also leads to
competitive advantages in deriving value from station acquisitions
– Retransmission revenues: FY15 $298.0 mm (+92.3% Y/Y); CAGR of 49.7% (2007-2015)
– ~45% of sub base repriced in 2015, ~40% of sub base to be repriced in 2016
Digital media revenue growth was driven by organic growth and contributions from LAKANA, our recently formed digital media services
company, and the mid-year accretive acquisition of Yashi, a leading online programmatic video platform
– Digital revenues: FY15 $89.9 mm (+92.5% Y/Y); CAGR of 43.1% (2007-2015)
9
Consolidation Is Reshaping the Industry Landscape
Sorted by percent of US TV households reached

2011 – 33 Major Affiliate Groups                                                                                                                                                                                                    26%

                                                                                                                                                                                                                            20%
                                                                                                                                                                                                              18% 18%
                                                                                                                                                                                                13% 14%
                                                                    9% 10% 10% 10% 10%
                                            6% 6% 6% 6% 6% 7% 7% 8%
                             4% 4% 4% 4% 5%
  2% 2% 3% 3% 3% 3% 3% 3% 3%

2016 (Pro-Forma) for all announced transactions – 15 Major Affiliate Groups                                                                                                                                                  44%
                                                                                                                                                                                              38%             39%

                                                                                                                                                                               30%

                                                                                                                                                18%            18%
                                                                                                                                13%
                                                                                                 11%             11%
                                                                                   9%
                                                                   6%
      3%             3%              3%               4%

Note: Pro forma for all announced transactions             (1)   Gannett completed spinoff of publishing business from broadcast/digital business on June 29, 2015, the broadcast/digital entity was renamed TENGA
Source: BIA, Company filings                               (2)   E.W. Scripps Company completed the merger of its broadcast assets with those of Journal Communications and the spinoff of their respective newspapers on April 1, 2015
Excludes: O & O groups, Hispanic, Religious and ION

                                                                                                                                                                                                                                          10
NXST M&A Snapshot 2011-2016
60 TV stations, six low power signals and four digital businesses acquired1 in accretive transactions (Ex-MEG)
2011 2012-2014 2015-2016
Liberty Media Corporation Newport Television CCA
2 Stations / 2 Markets Newport #1 13 Stations / 9 Markets*
Green Bay, WI / Marquette, MI 12 Stations / 8 Markets / Digital *Net of divestiture of 1 Station / 1 Market to Bayou
City Broadcasting
Newport #2 / Smith
Gilmore Broadcasting 6 Stations / 3 Markets Meredith Corporation
1 Station / 1 Market 1 Station / 1 Market
Evansville, IN Citadel Communications Phoenix, AZ
3 Stations / 3 Markets
Des Moines + Sioux City, IA / Rock Island, IL Yashi, Inc.
Local digital video advertising and
Internet Broadcasting Systems programmatic technology company
Digital publishing platform and digital
Average Buyer Multiple of agency services Landmark Media Ent.
Less Than 6.0x 1 Station / 1 Market
2 Hoak Media / Parker Broadcasting Las Vegas, NV
Drives Free Cash Flow 5 Stations / 2 Markets
Accretion Grand Junction-Montrose-Glenwood Springs,
Reiten Television, Inc.
4 Stations / 1 Market
CO and Panama City, FL Minot-Bismarck-Dickinson-Williston, ND
4 closed / 1 pending approval. Pending acquisition of KFQX (by
Mission Broadcasting) already operating under pre-existing JSA.
Pappas Telecasting of Iowa
1 Station / 1 Market
Transactions Pending Approval Enterprise Technology Group
Des Moines, IA
Cloud-based CMS platform solutions
provider
1Including closed transactions and announced but pending West Virginia Media Holdings (WVMH)
acquisitions
2Liberty Media & Gilmore multiples based on 2010/2011 Grant Company 4 Stations / 4 Markets
Broadcast Cash Flow (BCF), Newport 2011/2012 BCF, Citadel 7 Stations / 4 Markets Expected to close in Late 2016
2014 BCF, Hoak/Parker and Grant 2013/2014 BCF, CCA 202/2013 NXST has entered into a Time Brokerage Agreement (“TBA”) with
BCF, Internet Broadcasting Systems (“IB”), Enterprise Technology Roanoke, VA / Huntsville, AL / Quad Cities, IA WVMH, whereby it will receive the stations’ BCF and pay an annual
fee to WVMH. The TBA will extend until the broadcast assets and
Group (“ETG”), and Yashi Inc. are excluded for the calculation. / LaCrosse, WI FCC licenses are transferred
11NXST/MEG: A Complementary Combination
Pure-Play Broadcasting and Digital Media Leader Positioned for Long-term Success
Creates leading pure-play broadcast operator
– Top 2 television broadcaster maximizes benefits of increased scale - $2.3 bn of annual revenue
– Strong and complementary nationwide coverage reaching ~39% of U.S. TV households
– Increased geographic diversity in mid-sized and top 50 designated market areas (DMAs)
Increased scale and reach of combined digital operations
– Extensive digital media assets, complementary technologies
– Segments of each company’s digital media business have already partnered in a number of areas
– Nexstar management record of running profitable digital media properties
Financially compelling combination for shareholders of both companies
– Immediate and substantial premium for MEG shareholders
– $76 mm in readily achievable synergies in year one
– Share in upside of combined company
• $500 mm of average annual free cash flow
– Nexstar pro forma average 2016/2017 free cash flow per share, per year increases ~37% to > $11.15
Nexstar has proven track record of delivering shareholder value
– Experienced, industry-leading management team
– History of operational excellence
– Proven acquisition integration and synergy realization capabilities
12Leading Pure-Play Broadcast Operator
U.S. TV Households Reached
Highlights
Tribune 44%
Media General transaction increases
Nextar’s broadcast portfolio by NXST/MEG 39%
approximately two-thirds
Sinclair 38%
More than doubles Nexstar’s current
audience reach
TEGNA 31%
Provides entrée to 15 new top-50
DMAs
MEG 23%
Offers synergies related to the
increased scale of the combined
Hearst 19%
digital media operations
Scripps 18%
Nexstar has successfully growin its
portfolio of digital assets, allowing it to
NXST 17%
drive increased value through scale
Meredith 11%
Pro forma for the transaction, Nexstar will be the second largest broadcasting group in the nation with 38.9% US television household reach, the national
regulatory ownership cap
____________________
Source: Company filings.
13Leading Pure-Play Broadcast Operator
Pro forma: 171 Television Stations in 100 markets reaching ~38.9% of all U.S. TV HH
Transaction provides entry into 15 top 50 DMAs
____________________
Source: Company filings. Pro Forma Nexstar Media Group Markets
14Transaction Update
February 2016
– Financing commitment for bank syndication closed, consisting of ten lenders
March 2016
– Preliminary Form S-4 filed with SEC1
May / June 2016
– Form S-4 declared effective
– Shareholders of NXST and MEG voted to approve merger and acquisition of MEG by NXST
– NXST announces the execution of agreements providing for the divestiture of 13 stations for total consideration of
$548 million2, representing a seller’s multiple of approximately 11.1x average 2014/2015 broadcast cash flow
– The Company believes these asset sales bring the Nexstar/Media General transaction into compliance with
Federal Communication Commission and Department of Justice requirements for approval
– Cash proceeds from all sales will be used to pay down debt
July 2016
– NXST completes offering of $900 million of new 5.625% senior notes which fully addresses the portion of the
planned financing for the transaction that the Company expects to do outside of the secured loan market
The $548 million divestiture proceeds and the cost of capital of the $900 million senior notes were
key assumptions in Nexstar’s 2016/2017 free cash flow guidance for the combined entity and
both were more favorable than the assumptions in the Company’s guidance
1) Notice of Effectiveness was filed by the SEC on May 6, 2016, and is available at www.sec.gov
2) For more information on announced station divestitures, see Forms 8-K filed by Nexstar Broadcasting Group Inc. on June 6, 2016 and June 14, 2016 available at www.sec.gov
3) For more information on announced senior notes offering, see Forms 8-K filed by Nexstar Broadcasting Group Inc. on July 13, 2016; July 15, 2016 and July 29, 2016 available at www.sec.gov
15Expanding and Diversifying Revenue Mix
Monetizing the local opportunity through five-tiered high NXST Revenue Mix (% of Total Gross Revenue)
margin revenue stream business model
Non-TV Spot revenue (ex-Political) comprised
– Television (on-air) 25% of 2011 gross revenue of $338.1 mm
– Digital/Mobile (on-line) Political 1.9%
– Distribution (retransmission fees) Other 2.8%
Digital 4.8%
– Station management services T&B 6.3%
– Emerging digital opportunities (spectrum) Retrans 11.1% 2011
National 19.4%
Focus on creating highly recognizable local brands to cultivate
Local 53.7%
viewership / online and mobile usage / purchase decisions
Original local content, news and entertainment programming Non-TV Spot revenue (ex-Political) comprised
on-air, online and via mobile devices 45% of 2015 gross revenue of $976 mm
Other 0.6%
Political 1.3%
Effective marketing solutions for local and national advertisers
T&B 4.8%
Digital 9.2%
High quality local sales teams capitalize on local programming
investments and e-Media platform National 15.7% 2015
Retrans 30.5%
~45% of FY 2015 EBITDA generated by revenue sources other Local 37.8%
than broadcast advertising
16Local News/Programming
NXST’s local news rank among top 2 in approximately two-thirds of markets
– Strong community presence, extensive local sports coverage, active sponsorship of community events
Garnered nearly 500 broadcasting and journalism awards since 2009 for outstanding local news programming and local
community service
The expansion of local news leadership and the in-house production of over 1,640 hours of local content per week;
85,000+ hours of local news, weather and sports, local lifestyle / community programming annually
Over the last six years NXST has invested over $100 mm to expand local news programming and make technology and
infrastructure enhancements
– These investments follow approximately $85 mm of investments in broadcasting technology by NXST, which
concluded in 2009, for digital conversions of its television broadcasting platform
17Network Affiliation Agreements
Long-term record of negotiating mutually beneficial Network Affiliation agreements
Long-term Affiliation Agreements
100% of all “Big Four” markets are renewed through YE2016
Creating the first NBC affiliate in Lafayette, LA and the MyNetworkTV affiliate in Waco, TX (both effective 7/1/15)
through efficient re-allocation of Nexstar’s existing spectrum assets
Affiliations Affiliations Affiliations Affiliations renewed
renewed renewed renewed through 12/18
through 12/16 through 12/17 through 12/19 and 6/20
Note: Affiliation expiration based on Nexstar and Mission owned stations as of 12/31/14
18Digital Media Marketing Solutions and Services
LAKANA: Enterprise-class Technology Solutions for Media Publishers
• LAKANA delivers SaaS-ready content management platforms, which seamlessly integrate with a comprehensive suite
of products and services that together enable media publishers to increase their digital monetization
• Agency and SaaS platform clients includes nearly 300 television stations, newspapers, magazines and brands reaching
nearly 176 million unique users, who consume close to 1.2 billion monthly page views
Kixer: Machine Learning and Mobile Monetization Advertising Technology Platform
• Acquired by LAKANA in Oct. 2015, Kixer is a leading ad technology platform that leverages its proprietary machine
learning technology to optimize and drive new mobile revenue streams for content publishers
• Kixer specializes in the growing mobile app acquisition marketplace, a multibillion-dollar ad category
Yashi: Leading Online Programmatic Video Platform with Location-focused Technology
• A pioneer in the online video advertising industry, Yashi is an ad technology company focused on the programmatic
delivery of location focused, targeted video campaigns, its platform lets advertisers and agencies plan, buy, measure,
and optimize their ad campaigns in real time
• Emphasis on transparency and programmatic hyperlocality offers clients the ability to customize ad campaigns, while
also providing national / local sales teams new powerful digital marketing tools
19Spectrum Auction/Timeline
The Incentive Auction: How it Works
Broadcaster offers to relinquish spectrum usage rights
Broadcasters Mobile Broadband
Reverse Providers
Auction
Mobile Broadband offers for spectrum licenses Forward
Auction
Auction Timeline
March 29 April/May Early/Mid May August Aug/Sept
Participating FCC sets initial Clock rounds in Forward Auction
stations clearing target reverse auction auction begins concludes*
commit to a and conducts begins
bidding option mock auction(s)
*This date is based on the FCC closing the auction at its initial clearing target. If it fails to do so, the auction may close closer to the end of 2016
Source: NAB, FCC
20Financial Overview
21Growing Two-Year Free Cash Flow Cycle (FY)
Significant FCF Growth Since IPO
NXST FCF based on two year cycles
$368.0
($ in millions)
$165.4
$94.3
$45.4 $55.5 $46.2
2004/2005 2006/2007 2008/2009 2010/2011 2012/2013 2014/2015
Organic growth, fueled by political, digital and retransmission revenues, and contributions from recently completed
and pending transactions will drive pro-forma FCF to ~$500 mm during the 24 month period 2016/2017
~30.5 mm outstanding shares (reflecting repurchases of approximately 1 mm shares in Q3’15)
Accretive M&A and debt retirement/leverage reduction priorities
22Historical Financial Summary (in millions)
FY Net Revenue FY Core Revenues
$896.4 $522.9
$631.3 $389.1
$348.8
$502.3
$249.8 $237.7 $266.3
$378.6 $235.9 $247.3
$212.5
$313.4 $306.5
$266.8 $284.9 $252.0
$175.5 $171.6 $157.4 $173.9 $181.6 $190.2 $265.4 $279.2 $369.3
$74.3 $66.1 $55.1 $62.0 $65.7 $76.1 $113.4 $109.9 $153.6
2007A 2008A 2009A 2010A 2011A 2012A 2013A 2014A 2015A 2007A 2008A 2009A 2010A 2011A 2012A 2013A 2014A 2015A
FY Adjusted EBITDA(1) FY Free Cash Flow(2)
$305.1 $208.2
$234.7 $159.7
$166.7
$146.3
$112.3 $80.5 $84.9
$85.1 $96.2 $96.1 $60.1
$63.2 $34.2
$28.0 $26.3 $19.9
32% 34% 25% 36% 31% 39% 33% 37% 34%
2007A 2008A 2009A 2010A 2011A 2012A 2013A 2014A 2015A 2007A 2008A 2009A 2010A 2011A 2012A 2013A 2014A 2015A
1) Adjusted EBITDA is calculated as BCF less corporate expenses
2) Free cash flow is EBITDA less cash interest expense, capital expenditures and net cash income taxes
Definitions and disclosures regarding non-GAAP financial information can be located in the Company’s Fourth Quarter 2015 Financial Results press release dated February 25, 2016
232Q / Six Months 2016 Financial Summary
1) Definitions and disclosures regarding non-GAAP financial information can be located in the Company’s Second Quarter 2016 Financial Results press release dated August 9, 2016
2) Broadcast cash flow margin is broadcast cash flow as a percentage of net revenue. Adjusted EBITDA margin is Adjusted EBITDA as a percentage of net revenue
24Debt/Leverage Analysis
TTM ENDED 3M ENDED
(in millions) 12/31/2011 12/31/2012 12/31/2013 12/31/2014 12/31/2015 06/30/16
Revolver $ 24.3 $ - $ - $ 5.5 $ 2.0 $ 22.0
TLB 148.1 288.3 545.4 705.1 682.2 673.2
8.875% Sr Sec 2nd Lien Notes 318.4 319.4 - - - -
6.875% Sr Sub Notes - 250.0 525.7 525.6 519.8 520.2
6.125% Sr Sub Notes - - - - 272.2 272.4
7% Sr Sub Notes 149.6 - - - - -
11.375% Senior discount notes - - - - - -
Total Debt $ 640.4 $ 857.8 $ 1,071.1 $ 1,241.6 $ 1,476.2 $ 1,487.8
Cash on Hand $ 7.5 $ 69.0 $ 40.0 $ 131.9 $ 43.4 $ 27.2
Reported EBITDA $ 96.2 $ 146.3 $ 166.7 $ 234.7 $ 305.1 $ 90.2
Compliance EBITDA $ 103.3 $ 189.5 $ 176.7 $ 211.2 $ 322.9 $ 338.7
Compliance Leverage: 6.20x 4.16x 5.84x 4.40x 4.32x 3.99x
FCF $ 34.2 $ 80.5 $ 84.9 $ 159.7 $ 208.2 $ 48.7
25Transformational Acquisitions and Operating
Strategies Driving Record FCF
Continued double-digit growth of non-core revenue channels
– Political: Even-year CAGR of 25% (2008-2014), odd-year CAGR of 29% (2009-2015)
• NXST Political revenue expected to reach ~$100 mm in 2016
– Retransmission: Contract renewals for >200 agreements in last two years
• Agreements with 3 of the top 5 distribution partners
• ~45% of sub base repriced in 2015, ~40% of sub base to be repriced in 2016
– Digital Media platform rapidly expanding
• New revenue applications and monetization of mobile leading to growth organically and through accretive M&A
Strong operating fundamentals, accretive M&A, share repurchases and strengthened balance sheet driving record FCF
– Legacy NXST expected to generate pro forma FCF of $250 mm per year during 2016/2017, or average FCF of ~$8.15 per
share per year
Closed and successfully integrated highly accretive acquisitions (excluding pending MEG transaction)
Agreement to acquire MEG represents transformative and strategically / financially compelling growth opportunity
– Creates second-largest broadcast television group with leading digital media platform
– Pro forma operating base of 171 full power TV stations in 100 markets reaching 39% of U.S. TV HHs
– Expected to generate annual revenue in excess of $2.3 bn and $76 mm of readily achievable year one synergies
– Expected to generate average pro forma FCF of approximately $11.15 per share per year during the 2016/2017 cycle
– Economically compelling for both companies’ shareholders
Broadcast spectrum monetization opportunity
Financial capacity / flexibility to reduce leverage while returning capital to shareholders
26Investor Presentation
Perry Sook, Chairman, President & CEO
Keeping it Local Tom Carter, EVP & CFO
NXST: NASDAQ
September 2016You can also read