TELEVISION & OVER-THE-TOP (OTT) - PJ SOLOMON Media and Tech Services Market Update
←
→
Page content transcription
If your browser does not render page correctly, please read the page content below

AN AFFILIATE OF
                                           Private and Confidential

TELEVISION & OVER-THE-TOP (OTT)
PJ SOLOMON Media and Tech Services Market Update

August 2020

                                                                                        1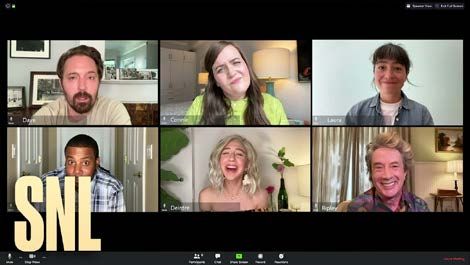
TABLE OF CONTENTS

Section

I         PJ SOLOMON Update           3

II        Media Channel Trends        8

III       Television Update           11

IV        Over-The-Top (OTT) Update   17

                                           2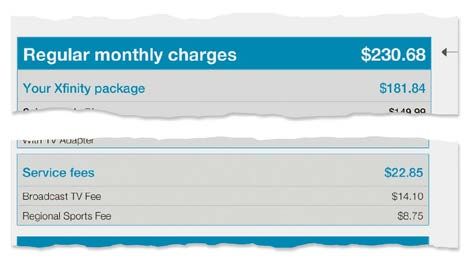
PJ SOLOMON Update

                    Private and
                    Confidential   3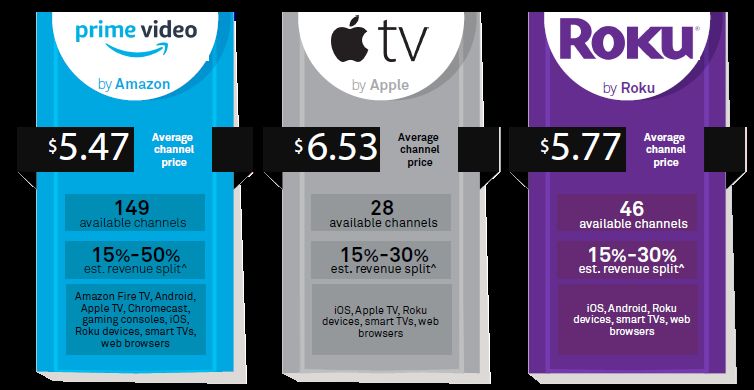
PJ SOLOMON UPDATE

  •      Founded in 1989, PJ SOLOMON is
         a leading financial advisory firm                       Our principal shareholder, Natixis, is part of Groupe BPCE, a
                                                                         top four European and a top 20 global bank
         with a legacy as one of the first
         independent investment banks
  •      We offer unmatched industry
         knowledge in the sectors we cover,
                                                                                  4 core businesses to support clients and the
         providing comprehensive strategic                                                  Groupe BPCE networks
         solutions tailored to generate long-
                                                                Corporate &                                                                     Specialized
         term shareholder value                                 Investment
                                                                                         Asset & Wealth
                                                                                                                    Insurance                    Financial
                                                                                          Management
                                                                  Banking                                                                        Services
  •      We offer the “best of both worlds”:
         the experience of a boutique, as
         well as global reach and
         capabilities
                                                              €9.6B+                  €1.7B+                   €500B+                           240+
                                                             Net Revenues   (a)        Net Profit   (a)        Total Assets   (a)                 M&A
                                                                                                                                             Professionals (a)

            135+                         100+                                             A+                        A2                             A
             Employees                       Investment
                                               Bankers           38+                     S&P                   Moody’s                          Fitch
                                                               Countries                                  Long Term Ratings    (All Stable)

                                                                                        51% Owned by           49% Owned by
            24                      8               7                                      Natixis                Partners

         Managing                  Senior        Verticals
         Directors                Advisors

                                                                                                                              Private and
a) LTM as of November 30, 2019.                                                                                               Confidential                       4
PJ SOLOMON MEDIA AND TECH SERVICES TEAM
Senior bankers with judgement and experience
Mark A. Boidman Ben Zinder Christian Bermel
Managing Director Director Associate
Head of Media & Tech Services
W 212.508.1661 W 212.508.1621 W 646.708.8478
M 917.526.1092 M 646.522.8353 M 860.371.5882
mboidman@pjsolomon.com bzinder@pjsolomon.com cbermel@pjsolomon.com
• 20+ years of M&A experience Recent Media & Tech Services Transactions Recent Media & Tech Services Transactions
• Executed $40+ billion in completed transactions in US, • Ongoing sellside of out of home media company • Ongoing sellside of out of home media company
Europe and Asia • Restructuring of Mood Media • Restructuring of Mood Media
• Frequent speaker and panelist at industry events • Ares preferred equity investment in Outfront • Ares preferred equity investment in Outfront
• Former Head of Barclays / Lehman Brothers Out of • Sale of Total Outdoor assets to each of American
• Sale of Exterion Media (f.k.a. CBS Outdoor International)
Home, TV Broadcasting and Radio coverage Tower, New Tradition and Pacific Outdoor
to Global
• Former M&A Attorney, Paul, Weiss • Sale of Exterion Media (f.k.a. CBS Outdoor
• Netflix’s acquisition of select Regency Outdoor assets
International) to Global
• Former Director, Digital Signage Federation, trade • Sale of Cieslok Media to Bell Media
association supporting the interactive technologies, • Netflix’s acquisition of select Regency Outdoor
assets Other Transactions
digital signage and digital out of home network
• Raise of capital for PatientPoint by Searchlight • Sale of Modcloth to Walmart
industries
Capital and Silver Point Partners Education
Other
• Joint venture between Gas Station TV and Verifone • B.S., magna cum laude, phi beta kappa, Brown University
• Author of Times Square Everywhere, an analysis of how • Sale of Vector Media to Spire Capital
digital and mobile media are changing the media
• Sale of Cieslok Media to Bell Media
industry Ethan Volk
Other Transactions
• 2016 and 2015 Investment Banking MD of the Year by Analyst
Corporate Vision Executive Awards • Sale of De Novo Legal to Epiq Systems
• Sale of Thomas Nelson to HarperCollins
• 2015 Deal Maker of the Year in Media and
Communications by Business Worldwide • Sale of Soulcycle founders’ minority interest stake to
Equinox Holdings W 646.708.8473
• “40 Under Forty” by NACVA and CTI
Other M 516.732.9302
• Digital Signage Expo, Faculty Member
• Emerging Leaders Dealmaker by M&A Advisor evolk@pjsolomon.com
• Member, New York and Massachusetts State Bars
Education
Education • B.B.A., high distinction, Ross School of Business at Recent Media & Tech Services Transactions
• L.L.B, B.C.L., McGill University, Faculty of Law the University of Michigan • Ongoing capital raise for digital out of home media
• J.W. Scholarship, McGill University, Faculty of company
Management
Education
• B.S., cum laude, The Wharton School at the University of
Pennsylvania
Private and
Confidential 5PJ SOLOMON MEDIA & TECH SERVICES
Overview and areas of focus
We advise clients in the following areas
Advertising / Global Retail Tech / Professional Audiovisual
Marketing Services On-Premise Media / Event Tech
• Ad Tech • Background Music • AV Integration
• Classic Out of Home • Audio / Audio Equipment
• Connected Media
(OOH) Media and Solutions • Content Distribution and
Advertising Media
• Digital OOH • Digital Signage and
Interactive Displays • Conferencing /
• Marketing Collaboration
Technology • E-Commerce Tech • Digital Signage
• Point of Care Media • In-Venue Media and Tech • Event Production
• Smart Cities / Urban • Meeting Rooms
Infrastructure • Kiosk Solutions
• Learning
• Sports / Stadium • Payments • Security / Surveillance
Marketing
• Retail Analytics • Simulation and Visualization
• Transit Media
Private and
Confidential 6EXPERIENCED ADVISOR IN TELEVISION AND OTT /
STREAMING TRANSACTIONS
PJ SOLOMON has relevant industry and transaction-specific expertise
• PJ SOLOMON Bankers have advised on a number of television and OTT
transactions over the course of their careers
— Advised Banijay on its acquisition of Endemol Shine Group
— Advised Netflix on its acquisition of assets of Regency
— Advised Special Committee of Mediacom on $3.9Bn go-private by
founder and control shareholder
— Advised Committee of the Cablevision Board regarding spin-off of MSG
— Advised Scripps / Cox on strategic joint venture in the Travel Channel
— Advised Independent Committee of Charter Communications on capital
structure and potential sale transaction
— Advised Special Committee of Cablevision on $22Bn buyout offer by
Dolan Family (terminated)
— Advised Viacom on $40Bn merger with CBS Corporation
— Advised Buyer on potential acquisition of Crackle
— Advised Newsy on its sale to Scripps
Private and
Confidential 7Media Channel Trends
Private and
Confidential 8EXECUTIVE SUMMARY
As COVID accelerates the trend of audiences shifting from linear TV to streaming, advertising
dollars are beginning to follow
TV • Cord cutting continues to hit record highs as over 1.8 million pay-TV subscribers left cable
• TV ratings are down significantly (10–12%) overall as limited live events and new content available
• Ad revenues are expected to decrease 24% in Q2 and 12–16% overall in 2020
— Belief that TV ad spend will not recover to pre-COVID-19 levels until well into 2021
— Brand advertisers are spending more money on streaming inventory in order to reach the audiences that are
leaving traditional, linear TV
OTT • Streaming hours are surging as the re-platforming of TV to streaming has accelerated
• Marketers are re-allocating spend and following consumers in the shift to streaming
— Streaming will account for a larger slice of the ad dollars committed in this year’s annual upfront negotiations
compared to previous years
Estimated that 25% to 30% of dollars committed in the upfront market will go to streaming, compared to
10% to 20% in prior years
• Streaming and OTT providers have been able to increase advertising spend through:
— Offering incremental reach guarantees and cordoning off most prized inventory
— TV networks have enhanced streaming pitches by acquiring ad-supported streaming services like Hulu, Pluto
TV and Tubi
— Guaranteeing that upfront advertisers will only pay for ads shown to viewers that are additional to linear TV
— Building DSPs and creating partnerships with third-party physical vendors to “close the loop”
— Flexibility on content / advertising to be shown and ability to cancel commitments in shorter time frames than
for traditional TV
Private and
Confidential 9HOW CONSUMERS SPEND THEIR TIME
Digital Media TV Radio Print
9
8
7.6 hrs
7
6
Number of Hours
5
4.2 hrs
4
3.4 hrs
3 2.6 hrs
2
1.7 hrs 1.6 hrs
1 1.1 hrs
0.3 hrs
0
2008 2012 2016 2020 2022
Digital Media Print Radio TV
Source: eMarketer. 10U.S. Television Update
Private and
Confidential 11BROADCAST AND CABLE TV OUTLOOK
The interruption of live and linear / traditional TV programming has contributed to a cut in TV ad
spending
• Linear television ad revenues are projected to shrink by 12% in 2020
Post-COVID
— Q2 U.S. TV advertising spend is expected to decline 24%
Outlook
— Ad revenues are expected to decrease due to a combination of factors, including weak demand, the
cancellation of many TV campaigns and the postponement of major sporting events
• Excluding the impact of linear political ad revenues, the decline of linear ad sales are expected to be closer to
Commentary 17% for 2020
• Cord-cutting hit a record high (1.8 million U.S. pay-TV subscribers) during the early months of 2020 as COVID
shut down sports, bars and hotels
• AT&T lost more than one million pay-TV subscribers in the first quarter while Dish lost nearly half-a-million
Broadcast and Cable Advertising Revenue Forecasts
2020 2021
12%
6% 5%
(8%)
(12%) (12%)
(13%)
(16%)
Broadcast Networks Broadcast Stations Cable Networks (National) Cable Networks (Local)
Broadcast and Cable TV advertising revenues are expected to shrink in 2020;
Including a projected rebound in 2021, revenues remain well below 2019 levels
Source: Wall Street Research, MAGNA and the Wall Street Journal. 12THE NEW NORM
The broadcast television ecosystem has had to adapt to its new COVID reality
Unbundling and Unsubscribing Shift in Ad Buying Survive and Advance
• With little to no live sports for the first few • Historically, about one-third of the • Trying to re-engage with their viewers,
months of the COVID pandemic, many roughly $65 billion in annual TV ad broadcast TV networks have found new
consumers cut the cord and moved spending occurs during the upfront in ways to continue live and scripted
exclusively to streaming advance of the traditional September-to- television
May television season — Live shows including Saturday Night
— Some consumers only subscribe to
cable for access to national and — This year, without live sports or Live, The View and Tonight Show all
regional sports networks that are production of new series, the TV ad turned to Zoom or other video
bundled as part of a cable package environment is dealing with platforms to continue producing
uncertainty content
• Faced with the prospect of a subscriber
• In response, The Association of National — Scripted television programs such as
exodus, companies like Verizon have
Advertisers called on the TV industry to NBC’s The Blacklist, which features in-
started to review their contractual
permanently delay upfront ad buying person acting, animated parts of its
relationships with networks and leagues
and suggested a shift to calendar-year season finale that weren’t able to be
in an attempt to reduce subscriber costs
deals filmed
Illustrative Cable Bill
“While there are benefits to the upfront, it
remains an antiquated business system that
needs reform.”
- Marc Pritchard, Chief Brand Officer
Procter & Gamble
Source: Wall Street Journal, Time Magazine, New York Times and Deadline. 13MAJOR TV EVENT AUDIENCES ARE STAGNATING OR FALLING…
(Amounts in Millions of TV Viewers) 2020 Total: 142 million
2010 Total: 174 million
120
10%
100
32 Million Viewers Lost in Media
80
Fragmentation and Changing
Tastes for Content 28%
60
28%
40
20
0
2010 2011 2012 2013 2014 2015 2016 2017 2018 2019 2020
Super Bowl Oscars Grammys
COVID will Exacerbate These Trends
Source: Publicly available information. 14…WITH CPMS FOR MAJOR TV EVENTS RISING
(Amounts in Dollars per Thousand Viewers)
$100
$83.90
80
$66.84
60
$56.06
$33.57
40
$27.93
20
$16.55
0
2010 2011 2012 2013 2014 2015 2016 2017 2018 2019 2020
Super Bowl Oscars Grammys
Source: Publicly available information. 15PAY TV HOUSEHOLDS ARE DISINTEGRATING
(Amounts in Millions)
~11 million households are
expected to cut the cord in 2020
on a net basis
100 97.7
95.3
93.1
91.2
90
80.5
80 76.8
Pay TV Households in the United States
73.2
69.6
70 66.1
60
50
40
30
20
10
--
2016A 2017A 2018E 2019E 2020E 2021E 2022E 2023E 2024E
Source: eMarketer. 16Over-The-Top (OTT) Update
17OTT MARKET LANDSCAPE
PLATFORMS & SVOD AVOD TVOD LIVE STREAMING
DEVICES
18OTT INDUSTRY TRANSACTIONS
Recently, leading mass media companies have acquired niche AVOD platforms to expand their
OTT capabilities
$970 million $340 million ND ND
Aug. 2017(a) Mar. 2019(b) Mar. 2020 Apr. 2020(d)
Aug. 2014 Jan. 2019 Feb. 2020 Mar. 2020(c)
$1.6 billion ND $440 million ND
a) The Walt Disney Company acquired an additional 42% stake for $1.6 billion to retain a majority ownership (previously owned 33%).
b) CSS Entertainment acquired a majority ownership position in Crackle from Sony Pictures Television to launch Crackle Plus.
c) fuboTV became a wholly-owned subsidiary of FaceBank following the merger.
d) Fandango, a division of Comcast’s NBCUniversal, acquired Vudu from Walmart. 19KEY OTT OWNERSHIP
20OVER-THE-TOP (OTT) OUTLOOK
OTT platforms have performed well during the pandemic
• Despite initial shocks to ad spend in March at the outset of COVID, OTT ad spend has bounced back over
COVID 40% during the period from April to May
Commentary — Hulu and Sling TV, the two biggest Roku store apps by programmatic ad spend, saw significant gains
(+44% and +30%, respectively)
• Consumers have increased their reliance on OTT programming to satisfy media and entertainment desires
while key live programming is on hold
OTT Comparative Advantages
Strong Non-Skippable Data-Driven Key Flexible
Growth Ad Options Targeting Demographics Budgeting
OTT platforms can Unlike traditional Advertisers can leverage OTT is more focused Unlike traditional
generate audiences broadcast TV, ads on user data collected by on millennials because television or print media,
comparable to those of AVOD platforms can’t be platforms related to millennials are willing to digital media allows
some of the largest skipped using a DVR and content tastes and pay for what they want advertisers to make
broadcast TV events generate more preferences to create regardless of how tweaks based on what the
impressions bespoke, curated much it costs data is showing
messaging
Source: Wall Street Research, MarTech Series, Media Shark. 21OTT TRENDS
COVID has accelerated cord cutting and consumer shift to OTT
% of Consumers with a Connected TV
• Vizio reported a 40% increase in viewership across its connected 69%
TV platforms for both ad-supported and ad-free apps in late 61%
52% 55%
March / early April 44% 48%
Continued Cord 38%
• Since 2015, consumers have more than doubled the amount of
Cutting
time spent on Roku from 2.1 to 4.6 hours
— Roku (~43 million active accounts, up 42% in Q2 YoY) and 2014 2015 2016 2017 2018 2019 2020
other connected TV platforms have taken a large share as total
viewership hours have largely held steady
• With disruptions in traditional cable programming, including OTT Subscriptions by Platform (mm)
scripted TV, sports and other live entertainment, subscription- 398
365
based OTT platforms have filled the void
AVOD/SVOD as
334
296
— In the outset of the COVID-19 pandemic, shows like Tiger King
254
a Commodity 207
and Love is Blind drew 64 million and 30 million subscriber 127
158
views as consumer turned to OTT
— YouTube TV subscribers grew 15% in Q1’20 to 2.3 million 2017 2018 2019 2020E 2021E 2022E 2023E 2024E
• By the end of 2020, U.S. consumers are expected to hold over Netflix Prime Video Hulu Disney+/ESPN+ Other
250 million streaming subscriptions, up nearly 20% from 2019
• In the absence of live sports and entertainment, engagement % Growth (March to April)
with live streaming services like Amazon’s Twitch has surged 72%
The New • In Q1’20, Twitch users collectively watched over 3 billion hours of 50%
Appointment content, a 12% increase year-over-year
Television — Additionally, Twitch users created over 121 million hours of 15% 14%
content during the same period
• Live and recorded user generated content on platforms, Facebook Twitch Mixer YouTube
including Twitch, Facebook and YouTube garner millions of Gaming Gaming
Source: Wall Street Research. views and creates a robust audience for advertisers
Note: Other includes Apple TV+ and Peacock. 22GAINING STREAM
Interest in and engagement with streaming services has surged in the first half of 2020
Live Streaming Replaces Live Television(a) Subscriptions Have Become a “Must Have”(b)
YouTube Usage During Quarantine Consumers with One or More Paid Video Subscriptions
Pre-COVID Post-COVID
1% 1% 12%
90%94%
Significantly More 85%88% 84%88%
80%
Slightly More 73% 69%
39%
Stay the Same 54%
23%
Slightly Less 44%41%
Significantly Less
Don't Use
24%
Total Gen Z Millennials Gen X Baby Matures
LTM Netflix Paid Membership Growth Boomers
(Amounts in Millions)
11.0 193.0
15.8
2.7 6.7 8.8
148.9
~26 million paid memberships added in H1’20 (vs.
28 million in FY2019)
Total Paid Members Net Adds Net Adds Net Adds Net Adds Net Adds Total Paid Members
(Q2'19A) (Q2'19A) (Q3'19A) (Q4'19A) (Q1'20A) (Q2'20A) (Q2'20A)
Source: Netflix, Deloitte, Statista and other publicly available information.
a) Represents responses to the question “How much will your time spent with YouTube change if confined at home during quarantine?”
b) Represents percentage of U.S. consumers with at least one paid streaming video subscription. Matures represents consumers born pre-1946. Pre-COVID as
of December 2019. Post-COVID as of May 2020. 23OTT CHANNEL SUBSCRIPTION MODEL THRIVES IN THE U.S.
• The OTT Channel Subscription model offers a quick path to market for video services providers and alleviates
some technology, billing and customer service headaches that often plagues pay-TV
• Unlike AVOD platforms such as Pluto TV and Xumo, consumers pay a periodic subscription fee to gain access to
multiple channels without the hassle of advertisements
• Platforms may take a significant chunk of monthly subscriber revenue for carriage — typically ranging from 15% to
50% — but the increased distribution and visibility could lead to 50% or more of subscribers coming from Amazon
Prime Video Channels and similar offerings for some services
Selected US OTT Channel Subscription Platforms
OTT Channel Providers Progression
• Amazon was the first to roll out a
subscription channels offering in late 2015
• Roku debuted premium subscriptions at
The Roku Channel in January 2019
• Apple TV channels began operations in
May 2019
Source: S&P Global Market Intelligence. 24SHIFT IN AD SPEND
As consumers continue to transition from linear television to streaming, ad dollars are expected
to follow
Viewership is • The combination of COVID-19 and the increase in streaming platforms has led to step-function
Increasing growth in the OTT industry
— With this shift in viewership, OTT platforms are expected to continue to gain share in the TV
advertising market
— Even in the COVID-19 environment with consumers largely relegated to their homes, linear
TV ratings are down 10% to 12%
• Networks have historically charged a premium for ads on streaming platforms relative to linear
TV to encourage advertisers to funnel ad dollars to linear TV
— Last year, networks lowered the price of their streaming inventory to be more in line with
linear rates
Easier to • TV network groups – including Disney, NBCUniversal and ViacomCBS – have connected ad
Advertise to inventory across their connected TV and digital formats in order for advertisers to manage how
Reach often a viewer is exposed to a specific campaign
Audience • AVOD providers have also made it easier to advertise on their platforms in an effort to facilitate
the shift to digital advertising
— Roku allows advertisers to cancel 100% of their commitments with 14 days notice, a much
more flexible option compared to booking months in advance with linear TV networks
“A 15-30 second spot can influence how a consumer thinks about a brand. OTT advertising gives us the
opportunity to blend brand impact together with data, targeting and measurement.”
- Scott Rosenberg, SVP & GM of Platform Business, Roku
Source: Digiday, Roku. 25GROWTH IN ADVERTISING-VIDEO-ON-DEMAND (AVOD)
Consumers and media companies have shown a willingness to support ad-supported streaming
services
• While SVOD platforms including Netflix, Disney+ and Amazon Prime Video have dominated the streaming
landscape, consumers have started to include AVOD platforms to their streaming portfolio in an effort to cut down
on monthly subscription costs
— 47% of U.S. consumers currently use at least one free ad-supported streaming service while 35% of consumers
don’t want ads and will pay to avoid them
• In March 2020, ViacomCBS’ Pluto TV reported a 55% increase in its monthly active users, bringing its total user
count to 2.4 million
• NBCUniversal’s launched its new streaming platform, Peacock, in July, offering a free premium-ad supported
streaming service with over 7,500 of live and on-demand content
• Tubi, which was acquired by Fox in March, recently surpassed 200 million hours streamed per month, up 100%
year-over-year
Consumer Preference When Subscribing to a New Streaming Video Service
(a) (b) (c)
Ad-Only No Ads Some Ads
43%
40% 38%
35%
22% 22%
Pre-COVID Post-COVID
Source: Deloitte and other publicly available information.
Note: Pre-COVID is as of December 2019. Post-COVID is as of May 2020.
a) No monthly subscription fee, 12 minutes of ads per hour.
b) $12 per month subscription fee, no ads.
c) $6 per month subscription fee, 6 minutes of ads per hour. 26DISCLAIMER
This document is a marketing presentation. It has been prepared by personnel of PJ SOLOMON or its affiliates and not by Natixis’ research department. It is not
investment research or a research recommendation and is not intended to constitute a sufficient basis upon which to make an investment decision. This material is
provided for information purposes, is intended for your use only and does not constitute an invitation or offer to subscribe for or purchase any of the products or
services mentioned. Any pricing information provided is indicative only and does not represent a level at which an actual trade could be executed. Natixis may trade as
principal or have proprietary positions in securities or other financial instruments that are the subject of this material. It is intended only to provide observations and
views of the said personnel, which may be different from, or inconsistent with, the observations and views of Natixis analysts or other Natixis sales and/or trading
personnel, or the proprietary positions of Natixis. Observations and views of the writer may change at any time without notice.
This presentation may contain forward-looking statements and comments relating to the objectives and strategy of PJ SOLOMON. Any such projections inherently
depend on assumptions, project considerations, objectives and expectations linked to future events, transactions, products and services as well as on suppositions
regarding future performance and synergies.
Certain information in this presentation relating to parties other than PJ SOLOMON or taken from external sources has not been subject to independent verification,
and PJ SOLOMON makes no warranty as to the accuracy, fairness or completeness of the information or opinions in this presentation. Neither PJ SOLOMON nor its
representatives shall be liable for any errors or omissions or for any harm resulting from the use of this presentation, the content of this presentation, or any document
or information referred to in this presentation.
Nothing in this presentation constitutes investment, legal, accounting or tax advice, or a representation that any investment or strategy is suitable or appropriate to your
individual circumstances. Each individual or entity who receives this document or participates in any future transaction shall be responsible for obtaining all such
advice as it thinks appropriate on such matters and shall be responsible for making its own independent investigation and appraisal of the risks, benefits and suitability
of the transactions as to itself. Any discussions of past performance should not be taken as an indication of future results, and no representation, expressed or implied,
is made regarding future results. No person shall have any liability whatsoever (in negligence or otherwise) for any loss arising from any use of this document or its
contents or otherwise arising in connection with this document or any other written or oral communications transmitted to the recipient in relation hereto.
PJ SOLOMON and/or its affiliates, officers, directors and employees, including persons involved in the preparation or issuance of this material, may, from time to time,
have long or short positions in, and buy or sell, the securities or derivatives mentioned in this material.
The information contained herein may be based in part on hypothetical assumptions and for certain models, past performance. These assumptions have certain
inherent limitations, and will be affected by any changes in the structure or assets for this transaction. This material is confidential and any redistribution is prohibited.
PJ SOLOMON is not responsible for any unauthorized redistribution.
27You can also read