INVESTOR PRESENTATION - Optical Fiber Conference March 2019 IIVI - II-VI Incorporated

Page created by Marvin Mitchell
 
CONTINUE READING
INVESTOR PRESENTATION - Optical Fiber Conference March 2019 IIVI - II-VI Incorporated
INVESTOR PRESENTATION
 Optical Fiber Conference
       March 2019

          IIVI
INVESTOR PRESENTATION - Optical Fiber Conference March 2019 IIVI - II-VI Incorporated
Safe Harbor Statement

   This communication contains “forward-looking statements” within the meaning of the federal securities laws, including Section 27A of
   the Securities Act of 1933 and Section 21E of the Securities Exchange Act of 1934. Forward-looking statements often address expected
   future business and financial performance and financial condition, and often contain words such as “expect,” “anticipate,” “intend,”
   “plan,” “believe,” “seek,” “see,” “will,” “would,” “target,” similar expressions, and variations or negatives of these words. Forward-
   looking statements are not guarantees of future results and are subject to risks, uncertainties and assumptions that could cause actual
   results to differ materially from those expressed in any forward-looking statements. Important factors that may cause such a difference
   include: (i) the ability of II-VI Incorporated (“II-VI”) and Finisar Corporation (“Finisar”) to complete the proposed transaction on the
   anticipated terms and timing or at all, (ii) potential litigation relating to the proposed transaction, (iii) inherent risks and costs associated
   with the integration of the businesses and achievement of the anticipated synergies, (iv) potential disruptions from the proposed
   transaction that may harm the parties’ respective businesses, (v) the ability of the parties to retain and hire key personnel, (vi) adverse
   legal and regulatory developments or determinations that could delay or prevent completion of the proposed transaction, and (vii) the
   ability of II-VI to consummate financing related to the transaction. Additional risks are described under the heading “Risk Factors” in II-
   VI’s Annual Report on Form 10-K for the year ended June 30, 2018, filed with the U.S. Securities and Exchange Commission (the “SEC”)
   on August 28, 2018, and in Finisar’s Annual Report on Form 10-K for the year ended April 29, 2018, filed with the SEC on June 15, 2018.
   These risks, as well as other risks associated with the proposed transaction, will be more fully discussed in a joint proxy
   statement/prospectus that will be included in a registration statement on Form S-4 to be filed by II-VI with the SEC in connection with
   the proposed transaction. Neither II-VI nor Finisar assumes any obligation to publicly provide revisions or updates to any forward looking
   statements, whether as a result of new information, future developments or otherwise, should circumstances change, except as
   otherwise required by securities and other applicable laws.

                                                                                                                                                       Page 2
INVESTOR PRESENTATION - Optical Fiber Conference March 2019 IIVI - II-VI Incorporated
II-VI At a Glance
INVESTOR PRESENTATION - Optical Fiber Conference March 2019 IIVI - II-VI Incorporated
II-VI Overview

        “TWO SIX”                 Refers to groups II and VI of
                                  the Periodic Table of Elements

          20%
                                                               31%                    25%
                Regions                    46%    Segments                                  Markets      46%
                            40%
                Q2 FY2019                          Q2 FY2019                                 Q2 FY2019
        22%      Revenue                            Revenue                                   Revenue

              8% 10%
                                                       23%                                     11%

        Core Competency                  11,500+                                        14                342.9M
                                                                       52
       ENGINEERED MATERIALS           Worldwide employees       Worldwide Locations   Countries            Q2 FY2019
                                                                                                            Revenue

                                                                                                                       Page 4
INVESTOR PRESENTATION - Optical Fiber Conference March 2019 IIVI - II-VI Incorporated
Our Core & Growth Markets

   Core Markets                 New Growth Markets
   •   Optical Communications   •   EUV Lithography
   •   Industrial Lasers        •   SiC for Wireless
   •   Military                 •   SiC for EV
                                •   3D Sensing

                                                       Page 5
INVESTOR PRESENTATION - Optical Fiber Conference March 2019 IIVI - II-VI Incorporated
20+ Years of Tremendous Value Creation by Integration of Acquisitions
                                                                                                                                                                                                                       $1,159
                                                                                                                                                                                                              $972

                                                                                                                                                                                                 $827
                                                                                                                                                                                      $742
                                                                                                                                                                            $683
                                                                                                                                                              $551
                                                                                                                                       $487 $516

                                                                                                               $316 $292 $333
                                                                                           $224 $225
                                                                                $187
                                         $123 $114 $128 $143
                               $74
           $28 $38 $53 $61 $62
                                                                                                                                                                                                                                   NASDAQ
                                                                                                                                                                                                                                   S&P 500

IPO 1987   1995 1996 1997 1998 1999 2000 2001 2002 2003 2004 2005 2006 2007 2008 2009 2010 2011 2012 2013 2014 2015 2016 2017 2018

                                         ZnSe                                                                                                             Optical                                                  Compound Semi.
           Micro-optics                                                UV Filters                     Selenium                Micro-optics                                    Optical Amplifiers
                                         Growth                                                                               Photop Technologies
                                                                                                                                                          Channel             Oclaro Optical Amplifier             Wafer Fab
           VIrgo Optics
                                         Laser Power Corp
                                                                       Laser Power Corp               Refinery                                            Monitors                                                 Kaiam Laser Limited(U.K.
                                                                                                      Pacific Rare Metals                                 Aegis Lightwave                                          Fab)
                      Micro-
                                                    Silicon Carbide               Thermo-electric Coolers                                                      Metal Matrix                        Epiwafer
                      optics
                      Lighting Optical
                                                    Litton SIC Group              Marlow Industries                                                            Components                          Foundry
                                                                                                                                                               M Cubed Technologies                Epiworks

                                                                                                               Laser Processing      Conformal Patterning                Semiconductor Lasers                    Faraday Rotator
 Acquisition History                                                                                           Heads
                                                                                                               Highyag
                                                                                                                                     Max Levy Autograph                  Oclaro Semiconductor Laser              Integrated Photonics

                                                                                                                                                               Military & Aerospace                           Direct Diode Lasers
                                                                                                                                                               Optical Systems                                Direct Diode
                                                                                                                                                               LightWorks Optics

                  IIVI                                                                                                                                         Advanced Coatings                    GaAs & GaN-SiC Devices
                                                                                                                                                               Oclaro Optical Coatings              Anadigics

                                                                                                                                                                                                                         Page 6
INVESTOR PRESENTATION - Optical Fiber Conference March 2019 IIVI - II-VI Incorporated
Proven Integration Playbook Focused on Operational Improvements and
Investing for Growth
Oclaro Semiconductor Laser Business Case Study

Transaction Overview                                                  II-VI Laser Enterprise Revenue and Operating Margin

                                       Target had a high unit                Then (@ Acquisition)              Now
                                        cost structure
                                                                                                                    42%
                               1
                                       With vertical integration
                                        and wide applicability in
                                        optical and industrial
                                        markets, II-VI drove                        (45%)
     Semiconductor                      margin expansion over
     Laser business                     subsequent years                             FY14                           FY18
                                                                                             Revenue   Op. Margin
1.    Oclaro’s semiconductor laser business was acquired in FY2014.

                                                                                                                           Page 7
INVESTOR PRESENTATION - Optical Fiber Conference March 2019 IIVI - II-VI Incorporated
Acquisition of Finisar
INVESTOR PRESENTATION - Optical Fiber Conference March 2019 IIVI - II-VI Incorporated
A Transformative Combination

     $2.5B
     Pro Forma Revenue1                                                                                                                                                 7 Target End Markets

     $570M                                                                                                                                                                                         $22B
     Pro Forma EBITDA1                                                                                                                                          Addressable Market Size2

     70                                                                                                                                                                                            24K+
     Locations Worldwide                                                                                                                                   Total Employees Worldwide
     Diversified Global Footprint

 Note: Pro forma Revenue and EBITDA represents LTM 09/30/2018 for II-VI and LTM 07/29/2018 for Finisar.
 1.    Represents LTM 09/30/2018 for II-VI plus LTM 07/29/2018 for Finisar and includes $150mm run-rate synergies for EBITDA. EBITDA excludes amortization of intangibles, the impact of SFAS 123(R) stock-based compensation
       expense and one-time charges.
 2.    2022 estimated market size. Includes 3D Sensing, Power Devices for Automotive and Wireless RF size from Yole, Optical Communications from Lightcounting and Ovum, Industrial Processing, Military, Life Sciences from
       Strategies Unlimited.

                                                                                                                                                                                                                     Page 9
INVESTOR PRESENTATION - Optical Fiber Conference March 2019 IIVI - II-VI Incorporated
Strategic Window of Opportunity Now

                                                                                                              Combined broad base of talent,
Right Technology + Right Team + Right Time
                                                                                                         technology and manufacturing enhances
                                                                                                          our ability to hit market windows today

Disruptive Megatrends                                                              TAM ($B)
                                                                                                                Inflection Point
                                                                                     $20                                                      CAGR 20%

                                                                                     $15            CAGR 16%
                                     Electric &                 Proliferation of
     3D Sensing                 Autonomous Vehicles             Cloud Services       $10
                                                                                                                    Window of
                                                                                      $5                           Opportunity1

             Increased Data and                 Accelerated deployments in           $-
             Video Consumption                  Mobile & 5G Communications                      2018             2019           2020             2021              2022
                                                                                           Datacom TRx   Telecom TRx    ROADM   3DS & LiDAR   RF Electronics   Power Electronics
Note: Market size forecast from Lightcounting, Ovum and Yole.

                                                                                                                                                                     Page 10
Irreversible Megatrends I Addressing Multiple Strong and Growing Markets
                        3D Sensing                                       Optical                                            RF Electronics in           Power Electronics
                         & LiDAR                                      Communications                                            Wireless                For Green Energy

                        GaAs | InP                                GaAs | InP | Si Photonics                           GaAs | GaN/SiC | Diamond                    SiC

                               For 3D sensing in                              For terrestrial,                          For 4G remote radio       For electric vehicles
                            consumer electronics                           submarine & wireless                           heads, 5G beam          (EV/HEV), smart grid
                            & LiDAR in automotive                          optical infrastructure                       forming antennas &       power switching, solar
                                                                             and datacenters                               RF electronics           and wind energy
  2022 Market                             $2.9B                                       $12.1B                                        $1.1B                $1.2B
2018-22 CAGR                               60%                                           13%                                         26%                  27%
Source: 3D Sensing & LiDAR, Wireless RF and Power Electronics for Green Energy from Yole, Optical Communications from Lightcounting and Ovum.

                                                                                                                                                                            Page 11
Finisar Brings Significant Next-Generation Technologies For
 Communications, 3D Sensing, and LiDAR Enabling New Market Growth
                                                                                                                                         InP

       Datacom Transceiver Technology                       Telecom Transceiver Technology                                 ROADMs
                                                                                                                                          WSS
GaAs
                                                                                                                                          Optics
        High-Speed GaAs VCSEL    High-Speed InP DML                  I-Temp Tunable                Tunable Laser
                                                                                                                           LCoS
                                                                     DBR Laser + MZ Mod            + InP Modulator

        3D Sensing

                                                                 Coherent                          Coherent Tx+Rx          Diffraction
          2D VCSEL Array                                         Tunable Laser                     Assemblies              Gratings

              Laser Driver      Transimpedance
                                Amplifier
                                                      Clock & Data
                                                      Recovery
                                                                               Silicon Photonics
                                                                               PIC + EIC                             Integrated Circuits
                                                                                                                                         Page 12
Most Compelling Platform for 3D Sensing & LiDAR
   II-VI’s GaAs Platform + Finisar’s InP Platform
       = Enhanced competency in 3D Sensing and LiDAR
   Optimization of R&D, Capital and Asset Utilization
       = Faster Time to Market
   Vertically integrated 6 inch GaAs compound
    semiconductor platform, one of the largest in the world
       = RF Devices and advanced optoelectronic device integration
The iPhone Is Just The Tip of the Iceberg For Potential Applications

                Auto         Security /
                                             VR / AR      eCommerce   Video Game
Tablets        LIDARs        Biometrics
                                                                       Consoles

VCSEL Arrays For 3D Sensing & LiDAR CAGR (’18-22): +60%
Source: Yole

                                                                                   Page 13
Growth Opportunities in 5G Mobile Infrastructure
                                                                                                              5G OPTICAL ACCESS                                        5G RF
                                Backbone Network                                                    Front- & Backhaul Network                           Base Stations             Handsets

                                      Coherent TRx                     HPC WSS                   LPC WSS          25G FH TRx       Bidi DWDM TRx

            Line Cards                   Amplifiers                   OCM/OTDR                 DWDM Filters       Subsystems         100G BH TRx        GaN/SiC RF                 GaAs RF

        2022 TAM:                              $2.4B             Source: LightCounting
                                                                 Note: TAM is all inclusive
                                                                                                                    $1.4B      Sources: LightCounting
                                                                                                                               & II-VI Estimates
                                                                                                                                                                     $1.1B      Sources: Yole, JP Morgan & II-VI
                                                                                                                                                                                Estimates
     2018-22 CAGR:                             13%               (not exclusively 5G driven)                        124%                                              63%       (GaN/SiC RF includes 4G & 5G)

      Global backbone buildouts in                                           II-VI signs agreement with SEDI to         5G mmWave standard to drive           II-VI to complete qualification & to
      anticipation of 5G traffic                                             develop GaN/SiC on 150 mm                  GaN/SiC RF demand                     begin production of GaN/SiC

           2017                                                                2018                                       2019                                 2020
WSS: Wavelength Selective Switch; HPC/LPC: High/Low Port Count;
OCM: Optical Channel Monitor                                               5G optical access deployments begin          5G Smartphones & IoT to drive         5G service to become broadly
OTDR: Optical Time Domain Reflectometer                                    in Asia to support 5G New Radio              5G GaAs RF demand, 5G Optical         available
TRx: Transceiver; FH: Front-haul; BH: Backhaul; RF: Radio Frequency
BiDi: Bidirectional; DWDM: Dense Wavelength Division Multiplexing                                                       Access deployments continue
                                                                                                                                                                                                     Page 14
RF Electronics for Wireless Infrastructure
     II-VI’s GaAs & SiC on 6” platform + Finisar’s microelectronics design expertise
            = Access to larger & growing markets
     Collaboration with SEDI for GaN/SiC RF electronics
     For wireless: efficient, high power RF amplification with GaN/SiC HEMT
     Thin-film diamond on silicon for next generation high speed wireless electronics
        SiC Substrates           GaAs Epiwafers              GaAs pHEMT

                                                                                        5G
                                                                                        WIRELESS

                                                                                   Beam-forming Antenna

                                                                                        4G
     For 4G & 5G             For RF Devices in Wireless   For RF Applications in
   Wireless Antennas                 Handsets                   Wireless
                                                                                        WIRELESS
A world leading supplier of SiC substrates

GaN/SiC for RF Electronics
Market CAGR (‘18-’22): 26%                                                          Remote Radio Head
Source: Yole

                                                                                                          Page 15
Power Electronics for Green Energy
   II-VI’s SiC on 6” platform + Finisar’s microelectronics design expertise
          = Access to larger & growing markets
   High efficiency voltage and power conversion
         = SiC MOSFETs for Green Energy
  Applications
   Electric cars (EV/HEV)
   Solar & Wind Energy
   Smart Grid Power Switching

A world leading supplier of SiC substrates

SiC for High Power Electronics                                                                           HV Battery
Market CAGR (’18-’22): 27%                                                            Electric Charger
Source: Yole
                                                    Bi-Directional Converter/ Inverter/ Electric Motor

                                                                                    DC-DC Converter

                                                                                                          Page 16
II-VI and Finisar Both Positioned for Near Term Margin Expansion, with
Added Benefits from Combination

Key Drivers of Margin Improvement

                                                                                Combination

 Ramp in Silicon Carbide and    Significant traction for 100G CWDM4         $150 million run-rate cost
  3D-Sensing                      Gen3 platform                                synergies
 Increasing vertical            Large upside potential for 200G and 400G    Improved time to market,
  integration                     CDWM4 from Hyperscale customers              time to profitability and
                                 Developing a complete portfolio of 400G      time to scale
                                  solutions
                                 Design wins for next-generation coherent
                                  products

                                                                                                       Page 17
Significant Value Creation Potential from Synergies
                                                                                   Annual Estimated Synergies
                                                                                   Achieved Within 36 months

  Cost of Goods Sold            Supply chain management - Procurement
                                Infeed - Internal supply of enabling                    ~$85 million
                                 materials and components

                                More efficient R&D with scale
  Research & Development        Complementary engineering and design teams

                                Consolidation of overlapping corporate costs
                                                                                         ~$65 million
  General & Administration      Optimization of operating model

  Sales & Marketing             Savings from scale

                                                                                Total    ~$150 million

                                                                                                        Page 18
Strong Deleveraging Profile

    II-VI and Finisar have combined EBITDA                                                                 4.5
                                                                                                                                       4.1x
     generation today of                     $570mm1,2 including                                               4

     $150mm run-rate synergies                                                                              3.5
                                                                                                               3
    Combined company has a strong deleveraging
Antitrust and Competition Clearance Overview
  Country         Current Status                                           Expected Completion Date
  Germany         German Federal Cartel Office (FCO) cleared the                 Completed
                  transaction on January 17, 2019

  United States   HSR waiting period expired on January 28, 2019 with              Completed
                  no second request

  Romania         The filing is under review by the Romanian                    April 5, 2019
                  Competition Council

  Mexico          The filing is under review by the Federal Economic            July 2, 2019
                  Competition Commission

  China           The filing is under review by the State Administration        July - August 2019
                  for Market Regulation (SAMR)

                                                                                                      Page 20
China - SAMR Process Overview

  Phase              Timing                         SAMR Activity
  Submission         12/29/2018                     -----
  Pre-Registration   No maximum length of time      SAMR requests additional information from
  Period                                            parties
  Registration       Expected late February         SAMR registers the filing
  Phase I            Registration Date + 30 days    SAMR conducts preliminary review and contacts
                                                    third parties
  Phase II           Registration Date + 120 days   SAMR requests additional information based on
                                                    review and third party responses
  Phase III          Registration Date + 180 days   SAMR continues review of the transaction

                                                                                                Page 21
FINISAR/II-VI Integration Planning

Pre-Diligence   Due Diligence,                   Integration     PM, Project     Resources &
                                 Integration
Target Model    Target Model                    Management       Teams, and        Routines
                 & Synergies       Process          Office      Work Streams
 & Synergies                                                                     Defined and
Development       Validation       Kickoff      Established        Defined        Scheduled
  Jun 2018        Oct 2018        Dec 2018     Early Jan 2019   Jan/Feb 2019   End of Feb 2019

       Synergy
                                                Integration Planning
     Development

                                                                                        Page 22
News from II-VI Relevant
to OFC
Cloud Computing Driving Network-wide Growth

 Intra-Datacenter
    • Transition from 100 GbE to 400 GbE driven by new 12 Tb/s switches
    • II-VI new 56 Gb/s PAM4 VCSEL Arrays for 400 GbE
         • 200 GbE demo at MultiLane Booth #4507 (Optomind Transceiver)
         • 400 GbE demo at Samtec Booth #2500
 DCI & Core Network
    • Migration from 100 Gb/s to beyond 1Tb/s coherent transmission
    • II-VI: best-in-class pumps and micro-optics for miniature amps
 Undersea Networks
    • Hyper-scalers financing their own global networks
    • Increased connectivity to emerging economies (ex: India, SE-Asia)
    • II-VI new 800 mW pump & first orders for undersea WSS

                                II-VI Incorporated CONFIDENTIAL - Export Control Classification EAR99   Page 24
5G Will Accelerate Growth with New Services & Use Cases
 New Use Cases
    • IoT: smart home, smart city, smart factory, smart grid, autonomous car, AR
         • These use cases will require 10-fold increase in performance as measured by latency,
           throughput, reliability and scale - McKinsey, The Road to 5G, Feb. 2018
    • Requires access to massive computing capabilities (AI/ML) in the cloud
    • Real time delivery of accurate and relevant information to the IoT
 5G RF Networks
    • Full bandwidth achieved with mmWave technology starting around 2020
    • II-VI & SEDI (#1 Market Leader) GaN RF collaboration – qualified mid-2020
 5G Optical Access Networks
    • Front-haul bit rates migrating from 10 Gb/s to 25 Gb/s
    • New low latency requirements – sub-millisecond for autonomous cars
    • Multi-wavelength transmission in the optical access now economically viable
         • II-VI introducing wavelength management filters and handheld meters
    • WSS enables rapid wavelength re-configurability and survivability
         • II-VI introducing Edge WSS cost optimized for access networks

                                  II-VI Incorporated CONFIDENTIAL - Export Control Classification EAR99   Page 25
II-VI/SEDI Strategic Collaboration

 This collaboration is being driven by 5G

 Scope of the Collaboration
    • Manufacture state-of-the-art GaN/SiC HEMT devices on 150 mm platform
         • SEDI’s industry-leading HEMT device technology
         • II-VI’s 150 mm manufacturing platform
    • Expanding Warren, NJ device fab to add these core technologies
    • Production ramp in 2020 in time for 5G deployments

 Differentiated, vertically integrated from substrates to modules
    • Accelerate both companies’ wide-bandgap RF product roadmaps
    • Market leading GaN device performance, cost and scale
    • SEDI’s HEMT technology enables market share increase vs. Si LDMOS

                                                                             Page 26
OFC Panel on 3D Sensing
 High-Volume Applications of 3-D Sensing in Consumer and Automotive Markets

                              3-D sensing has many applications in consumer markets
                              (which include gesture and facial recognition, gaming, AR/VR,
                              security, and many others) and in automotive markets,
                              specifically for LIDAR and other advanced driver-assistance
                              systems. The recent years have seen initial volume
                              deployments in several of these segments, already driving
                              significant unit volumes for optical components and related
                              hardware. Yet the 3-D sensing market overall is still in a
                              nascent stage, demanding significant future innovation, but
                              also posing a tremendous revenue opportunity for optics and
                              related hardware.

   Dr. Sanjai Parthasarathi   Thursday, 7 March, 14:30-16:00
   VP, Strategic Marketing    Theater II, Hall E
   II-VI Photonics

                                                                                              Page 27
Horizon 2020 Programs
  Silicon Carbide – 200 mm (8 inch)
      • Horizon 2020 REACTION: a 4-year program (Start: Nov. 2018)
      • Goal: to establish in Europe the world’s first 200 mm pilot production facility
        for power electronics based on SiC
      • Power applications ranging from 600 V to 3.3 kV
      • II-VI introduced the world’s first 200 mm SiC substrates in 2015
      • Market for SiC Substrates: $1B by 2020

  Scandium – Selective Ion Recovery (SIR)
      • Horizon 2020 SCALE: a 4-year program (Start: Dec. 2016)
      • Goal: to develop a novel Scandium supply chain
      • II-VI’s SIR extracts from industrial waste streams economical sources of
        scandium at 50% of the cost of conventional techniques with better
        environmental benefits
      • Validated in European aluminum and titanium waste streams
      • Available for licensing
      • Market for Scandium Oxide: $1B by 2028, mostly for additive manucturing

                                                                                          Page 28
II-VI Additional Markets
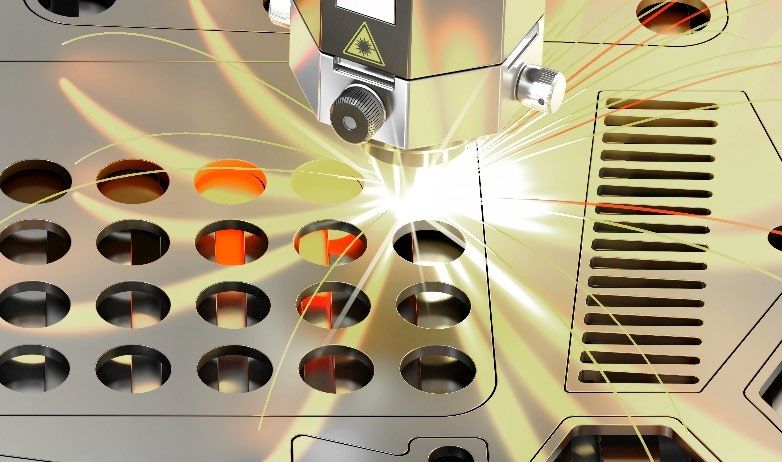
II-VI Core Market I Industrial Laser Materials Processing
  High Power Semiconductor Lasers & Laser Optics
   A full suite of components for multiple laser modalities
   Strong CO2 deployed base in active use and strong secondary market
   Industrial laser components: 25-35% of worldwide revenue

  FIBER LASER OPTICS           CO2 LASER OPTICS   LASER BARS   CUTTING HEADS   DIRECT DIODE LASER ENGINE

Laser Components, Processing Heads, Beam Delivery Optics / Components

Fiber Lasers Market CAGR (‘17-‘22): +8%
Direct Diode Market CAGR (‘17-‘22): +7%
Source: Strategies Unlimited
CO2 laser optics: 15-20%
One micron products: 15-20%

                                                                                                           Page 30
II-VI Core Market I Military
          Military-Aerospace business serves four strategic areas
            • Intelligence surveillance & reconnaissance (ISR)
            • Missiles and ordnance
            • EMI & survivability
          Highly differentiated core capabilities & products
            • Materials engineered in-house
            • Complex electro-optics sub-assemblies with high value add
          Emerging strategic platforms

World leader in large sapphire panel output 24,000 sf dedicated facility

Infrared Countermeasure Systems Market
CAGR (’17-’22): +8%
Source: Strategies Unlimited

                                                                           Page 31
II-VI Growth Applications I EUV Lithography
           EUV Lithography already started for 7 nm node production
           Multiple II-VI products used in each EUV system, ~1-2% of total value
           Products leverage II-VI materials: ZnSe, CdTe, CVD Diamond and RBSiC

        REAR MIRRORS             OUTPUT COUPLERS   MODULATOR     REACTION BONEDED SIC   CVD DIAMOND

                                                                   Structural Ceramic Subsystems
EUV Lithography Systems
Market CAGR (‘16-’22): 9%                                      EUV Source System: Focusing Optics
Source: Allied Market Research
                                                                          Beam Transport System
                                                          CO2 System: Seed Laser, Power Amplifiers
                                                                                                      EUV Lithography System

                                                                                                                    Page 32
II-VI Financial Summary
II-VI Segment Revenue by End Markets for Full Year FY18

                                                                                                  End Market Distribution of Full Year FY18 Revenue

                                                                                                         Fiber Optic &                                Life Science,
                                  FY18       FYY18 Op Margin    FY18/FY17 Revenue        Industrial
 Reported Segments                                                                                         Wireless        Military    Semi Cap        Consumer,
                                Revenue          – GAAP              Growth            (Automotive)
                                                                                                            Comm.                                         Other

 Laser Solutions **             $406M             9.5%                 28%                 67%               12%             3%*          7%              11%
                                                                                           (1%)

 Photonics **                   $487M            13.5%                 10%                 13%               77%             0%           3%              7%

                                                                                           15%
 Performance Products           $266M            11.6%                 24%
                                                                                           (2%)
                                                                                                             13%           40% *         19%              13%

                                                                                           33%
 II-VI Consolidated             $1,159M          11.7%                 19%
                                                                                           (1%)
                                                                                                             39%             10%          8%              10%

 * Now managed in Performance Products as of Q4FY18
 ** The Laser Solutions and Photonics’ results adjusted for the LSG move from Laser Solutions to Photonics

                                                                                                                                                             Page 34
II-VI Segment Revenue by End Markets for Q2FY19

                                                                                 End Market Distribution of Q2FY19 Revenue

                                                        Q2FY19/
                                            Q2FY19 Op                                Fiber Optic &                           Life Science,
                        Q2FY18    Q2FY19                Q2FY18      Industrial
 Reported Segments                           Margin –                                  Wireless       Military   Semi Cap     Consumer,
                        Revenue   Revenue               Revenue   (Automotive)
                                              GAAP                                      Comm.                                    Other
                                                        Growth

 Laser Solutions        $105M     $106M       12%         1%         57%                 14%            5%          7%           17%
                                                                      (1%)

 Photonics              $115M     $160M       15%        38%          8%                 83%            0%          3%           6%

                                                                     21%
 Performance Products   $61M      $77M        15%        26%
                                                                      (6%)
                                                                                         12%           41%         17%           9%

                                                                     27%
 II-VI Consolidated     $282M     $343M       12%        22%
                                                                      (2%)
                                                                                         46%            11%         7%           9%

                                                                                                                                    Page 35
II-VI Financial Trends
                   Booking/Revenue/Backlog                                                                                  Margin Performance
                                                                                                                        40.0%                     39.8%                      38.9%
                                                                                                 37.8%

                                             $1,210 $1,159
                        $1,072
                                 $972
    $875 $827
                                                                   $704 $657                             18.1%                    19.5%                    19.1%                       18.7%
                                                                                $513
                                      $399                  $451                                              11.1%                       11.9%                    11.7%                      11.7%
                $290

         FY16                  FY17                 FY18               H1FY19                        FY16                    FY17                       FY18                      H1FY19
                     Booking            Revenue            Backlog                                                    Gross Margin             EBITDA            Operating Margin

Cash and Liquidity                           FY16                    FY17              FY18         H1 FY19                 Expectations
 Cash and
 Equivalents                                 $218M                   $271M             $247M         $230M
                                                                                                                                                                 FY18                    FY19
 Cash Flow
 from Operations                             $123M                   $118M             $161M         $88M                       Gross Margin                     39.8%                38.5%-41%

 Long-Term Debt                                                                                                                 EBITDA                           19.1%                18.5%-21%
 (Including current portion)                 $235M                   $342M             $439M         $481M
                                                                                                                                Operating Margin                 11.7%                 11%-13%
 Shareholder’s Equity                        $782M                   $900M             $1,024M      $1,073M

                                                                                                                           Typical industry EPS adjustments are detailed at the end of this presentation.

                                                                                                                                                                                                Page 36
Appendix
Transaction Summary
Transaction                               Approximately $3 billion of total equity value
Consideration                               – Finisar shareholders to own approximately 31% of the combined company

Per Share Consideration
                                          $15.60 in cash and 0.2218x shares of II-VI common stock
                                            – Exchange ratio set at announcement based on total consideration to Finisar shareholders of $26.00 per share

                                          $2.0 billion of new funded debt in the form of fully-committed financing (in addition to unfunded revolver)
                                            – $450 million New Revolving Credit Facility
Sources of Financing                        – $1,975 million New Term Loans 1
                                          $709 million of combined balance sheet cash
                                          $1,219 million of equity issued to Finisar shareholders

                                          Approval by II-VI and Finisar shareholders
Approval Process
                                          Regulatory approvals

Expected Closing                          First half of CY2019, subject to customary closing conditions

                                          Up to $100 million of expected annual cost synergies realized within 24 months of transaction close; up to $150 million
                                               within 36 months of transaction close
Financial Highlights
                                          Detailed merger integration plan in place to catalyze growth
                                          Rapid deleveraging expected, from 3.5x net total leverage at close 2 to under 1.0x net total leverage by FYE 2022
    1.   Currently reflects $1,175 million of Term Loan A and $800 million of Term Loan B after Term Loan A upsize in January 2019 Agent Round.
    2.   Assumes cash balance of $288 million, total debt of $2,351 million and PF Adj. EBITDA of $588 million given 6/30/19 close.

                                                                                                                                                                     Page 38
Finisar Transaction Financing

Transaction                                         $2.0 billion new funded debt, fully committed financing
Financing                                             – $450 million unfunded revolver at close

                                                                                                                        ($ in billion)                             x LTM EBITDA (w/ synergies)1
Pro-forma                                         Gross Debt                                                                   $2.4                                                      4.0x
Capitalization
                                                  Cash                                                                         $0.3                                                      0.5x
Statistics
                                                  Net Debt                                                                     $2.1                                                      3.5x

                                                    Combined company has a strong deleveraging profile
Deleveraging and                                    Rapid deleveraging expected, from 3.5x net total leverage at close 2 to under 1.0x net total leverage by
Capital Allocation                                   FYE 2022
                                                    Ongoing ability to maximize strategic opportunities
1.   Represents statistics at 06/30/2019 close. Includes $150mm run-rate synergies. EBITDA excludes amortization of intangibles, the impact of SFAS 123(R) stock-based compensation expense and one-time charges.
2.   Assumes cash balance of $288 million, total debt of $2,351 million and PF Adj. EBITDA of $588 million given 6/30/19 close.

                                                                                                                                                                                                                    Page 39
II-VI Historical GAAP EPS and Adjusted EPS Equivalent
      To calculate EPS comparable to some peers, below are the values of typical adjustments used by other companies
II-VI Consolidated                           Q1      Q2      Q3         Q4         Q1         Q2         Q3         Q4         Q1      Q2
Summary of Typical Industry Non-GAAP
Adjustments                                 FY17    FY17    FY17       FY17       FY18       FY18       FY18       FY18       FY19    FY19
Amortization                                  3.2     3.2      3.1        3.2        3.6        3.8        3.6        3.6       3.7     4.1

Share Based Comp - COGS                       0.7     0.6      0.7        0.5        1.0        0.8        0.4        0.6       1.0     0.5

Share Based Comp - SGA                        3.4     3.3      3.8        3.0        5.3        4.5        3.2        3.8       4.3     4.5

M&A Related Expenses                            -       -          -      0.3        2.0            -          -          -     1.9     8.6

                                              7.3     7.1      7.6        7.0       11.9        9.1        7.2        8.0      10.9    17.7

Tax                                             -       -          -     (8.4)           -          -     (0.1)      (0.2)        -    (0;1)

Impact of the “Tax Cuts and Jobs Act” and       -       -          -          -          -     15.8       (6.5)      (1.3)        -        -
Company Actions

PAT                                           7.3     7.1      7.6       (1.4)      11.9       24.9        0.6        6.5      10.9    17,7

Outstand Shares                              63.6    64.4     65.0       65.0       65.3       65.0       65.1       65.1      66.2    65.7

EPS Impact of Typical Industry Non-GAAP      0.11    0.11     0.12      (0.02)      0.18       0.38       0.01       0.10      0.16    0.27
Adj.

                                                                                                                                             Page 40
II-VI Financial Summary
II-VI Segment Revenue by End Markets for Full Year FY18

                                                                                                  End Market Distribution of Full Year FY18 Revenue

                                                                                                         Fiber Optic &                                Life Science,
                                  FY18       FYY18 Op Margin    FY18/FY17 Revenue        Industrial
 Reported Segments                                                                                         Wireless        Military    Semi Cap        Consumer,
                                Revenue          – GAAP              Growth            (Automotive)
                                                                                                            Comm.                                         Other

 Laser Solutions **             $406M             9.5%                 28%                 67%               12%             3%*          7%              11%
                                                                                           (1%)

 Photonics **                   $487M            13.5%                 10%                 13%               77%             0%           3%              7%

                                                                                           15%
 Performance Products           $266M            11.6%                 24%
                                                                                           (2%)
                                                                                                             13%           40% *         19%              13%

                                                                                           33%
 II-VI Consolidated             $1,159M          11.7%                 19%
                                                                                           (1%)
                                                                                                             39%             10%          8%              10%

 * Now managed in Performance Products as of Q4FY18
 ** The Laser Solutions and Photonics’ results adjusted for the LSG move from Laser Solutions to Photonics

                                                                                                                                                             Page 43
II-VI Segment Revenue by End Markets for Q2FY19

                                                                                 End Market Distribution of Q2FY19 Revenue

                                                        Q2FY19/
                                            Q2FY19 Op                                Fiber Optic &                           Life Science,
                        Q2FY18    Q2FY19                Q2FY18      Industrial
 Reported Segments                           Margin –                                  Wireless       Military   Semi Cap     Consumer,
                        Revenue   Revenue               Revenue   (Automotive)
                                              GAAP                                      Comm.                                    Other
                                                        Growth

 Laser Solutions        $105M     $106M       12%         1%         57%                 14%            5%          7%           17%
                                                                      (1%)

 Photonics              $115M     $160M       15%        38%          8%                 83%            0%          3%           6%

                                                                     21%
 Performance Products   $61M      $77M        15%        26%
                                                                      (6%)
                                                                                         12%           41%         17%           9%

                                                                     27%
 II-VI Consolidated     $282M     $343M       12%        22%
                                                                      (2%)
                                                                                         46%            11%         7%           9%

                                                                                                                                    Page 44
II-VI Financial Trends
                   Booking/Revenue/Backlog                                                                                  Margin Performance
                                                                                                                        40.0%                     39.8%                      38.9%
                                                                                                 37.8%

                                             $1,210 $1,159
                        $1,072
                                 $972
    $875 $827
                                                                   $704 $657                             18.1%                    19.5%                    19.1%                       18.7%
                                                                                $513
                                      $399                  $451                                              11.1%                       11.9%                    11.7%                      11.7%
                $290

         FY16                  FY17                 FY18               H1FY19                        FY16                    FY17                       FY18                      H1FY19
                     Booking            Revenue            Backlog                                                    Gross Margin             EBITDA            Operating Margin

Cash and Liquidity                           FY16                    FY17              FY18         H1 FY19                 Expectations
 Cash and
 Equivalents                                 $218M                   $271M             $247M         $230M
                                                                                                                                                                 FY18                    FY19
 Cash Flow
 from Operations                             $123M                   $118M             $161M         $88M                       Gross Margin                     39.8%                38.5%-41%

 Long-Term Debt                                                                                                                 EBITDA                           19.1%                18.5%-21%
 (Including current portion)                 $235M                   $342M             $439M         $481M
                                                                                                                                Operating Margin                 11.7%                 11%-13%
 Shareholder’s Equity                        $782M                   $900M             $1,024M      $1,073M

                                                                                                                           Typical industry EPS adjustments are detailed at the end of this presentation.

                                                                                                                                                                                                Page 45
Appendix
Finisar Transaction Overview
Transaction             Approximately $3.2 billion of total equity value
Consideration             – Finisar shareholders to own approximately 31% of the combined company
                        $26.00 per share
Per Share                 – $15.60 in cash and 0.2218 shares of II-VI common stock, valued at $10.40 per share based on the closing price of II-VI’s
Consideration                   common stock of $46.88 on November 8, 2018
                            – Fixed exchange ratio
                        $2.0 billion of new funded debt in the form of fully committed financing (in addition to $450mm unfunded revolver)
                          – Permanent financing expected to come through pro rata and institutional markets
Sources of                – Revolver and TLA, 5 year tenor; TLB, 7 year tenor, blended interest rate expected L+225 bps
Financing                 – Expect to de-lever to current levels within 2 years
                        $1.0 billion of combined balance sheet cash
                        $1.4 billion of equity issued to Finisar shareholders
                        Approval by II-VI and Finisar shareholders
Approval Process
                        Regulatory approvals

Expected Timeline       Middle of calendar year 2019, subject to customary closing conditions

                        $150mm of expected annual cost synergies realized within 36 months of close
Financial Highlights    Expected to drive accretion in Non-GAAP earnings-per-share for the first full year post close of approximately 10% and more
                           than double that thereafter

                                                                                                                                                  Page 47
Finisar Transaction Financing

Transaction                                        $2.0 billion new funded debt, fully committed by BofA Merrill Lynch
Financing                                            – $450 million unfunded revolver at close

                                                                                                                       ($ in billion)                             x LTM EBITDA (w/ synergies)1
Pro-forma                                         Gross Debt                                                                  $2.4                                                     4.1x
Capitalization
                                                  Cash                                                                        $0.3                                                     0.6x
Statistics
                                                  Net Debt                                                                    $2.0                                                     3.5x

                                                   Taken together, company has EBITDA generation of $570mm1
Deleveraging and
Capital Allocation                                 Combined company has a strong deleveraging profile
                                                   Ongoing ability to maximize strategic opportunities

1.   Represents LTM 09/30/2018 for II-VI and LTM 07/29/2018 for Finisar and includes $150mm run-rate synergies. EBITDA excludes amortization of intangibles, the impact of SFAS 123(R) stock-based compensation expense and one-
     time charges.

                                                                                                                                                                                                                   Page 48
II-VI Historical GAAP EPS and Adjusted EPS Equivalent
      To calculate EPS comparable to some peers, below are the values of typical adjustments used by other companies
II-VI Consolidated                           Q1      Q2      Q3         Q4         Q1         Q2         Q3         Q4         Q1      Q2
Summary of Typical Industry Non-GAAP
Adjustments                                 FY17    FY17    FY17       FY17       FY18       FY18       FY18       FY18       FY19    FY19
Amortization                                  3.2     3.2      3.1        3.2        3.6        3.8        3.6        3.6       3.7     4.1

Share Based Comp - COGS                       0.7     0.6      0.7        0.5        1.0        0.8        0.4        0.6       1.0     0.5

Share Based Comp - SGA                        3.4     3.3      3.8        3.0        5.3        4.5        3.2        3.8       4.3     4.5

M&A Related Expenses                            -       -          -      0.3        2.0            -          -          -     1.9     8.6

                                              7.3     7.1      7.6        7.0       11.9        9.1        7.2        8.0      10.9    17.7

Tax                                             -       -          -     (8.4)           -          -     (0.1)      (0.2)        -    (0;1)

Impact of the “Tax Cuts and Jobs Act” and       -       -          -          -          -     15.8       (6.5)      (1.3)        -        -
Company Actions

PAT                                           7.3     7.1      7.6       (1.4)      11.9       24.9        0.6        6.5      10.9    17,7

Outstand Shares                              63.6    64.4     65.0       65.0       65.3       65.0       65.1       65.1      66.2    65.7

EPS Impact of Typical Industry Non-GAAP      0.11    0.11     0.12      (0.02)      0.18       0.38       0.01       0.10      0.16    0.27
Adj.

                                                                                                                                             Page 49
You can also read