Analysts Briefing 2020 Interim Results - 12th August 2020 - Cathay Pacific

Page created by Herbert Lindsey
 
CONTINUE READING
Analysts Briefing 2020 Interim Results - 12th August 2020 - Cathay Pacific
Analysts Briefing
2020 Interim Results
12th August 2020

Confidential and Proprietary Information
© Cathay Pacific Airways Limited and its subsidiaries
Analysts Briefing 2020 Interim Results - 12th August 2020 - Cathay Pacific
Disclaimer
 This document has been prepared by Cathay Pacific Airways Limited (“the “Company”, and together with its subsidiaries, the “Group”) solely for information
 purposes and certain information has not been independently verified. No representation or warranty, express or implied, is made as to, and no reliance should be
 placed on, the accuracy, fairness, completeness, reasonableness or correctness of the information or opinions presented herein or any verbal or written
 communication in connection with the contents contained herein. Neither the Company nor any of its affiliates, directors, officers, employees, agents, advisers or
 representatives shall have any responsibility or liability whatsoever, as a result of negligence, omission, error or otherwise, for any loss howsoever arising in
 relation to any information presented or contained in this document or otherwise arising in connection with this presentation. The information presented or
 contained in this document is subject to change without notice and shall only be considered current as of the date of this presentation.

 This document may contain certain forward-looking statements that reflect the Company’s beliefs, plans or expectations about the future or future events . These
 forward‐looking statements are based on a number of assumptions, current estimates and projections, and are therefore subject to inherit risks, uncertainties and
 other factors beyond the Company’s control. The actual results or outcomes of events may differ materially and/or adversely due to a number of factors, including
 changes in the economies and industries in which the Group operates (in particular in Hong Kong and Mainland China), macro-economic and geopolitical
 uncertainties, changes in the competitive environment, foreign exchange rates, interest rates and commodity prices, and the Group’s ability to identify and
 manage risks to which it is subject. Nothing contained in these forward-looking statements is, or shall be, relied upon as any assurance or representation as to the
 future or as a representation or warranty otherwise. Neither the Company nor its directors, officers, employees, agents, affiliates, advisers or representatives
 assume any responsibility to update these forward‐looking statements or to adapt them to future events or developments or to provide supplemental information in
 relation thereto or to correct any inaccuracies.

 This document is for information purposes only and does not constitute or form any part of, and should not be construed as, an invitation or offer to acquire,
 purchase or subscribe for securities nor is it calculated to invite any such offer or invitation, whether in Hong Kong, the United States, or elsewhere.

 This document does not constitute, and should not be construed as, any recommendation or form the basis for any investment decisions regarding any securities
 of the Company. Potential investors and shareholders of the Company should exercise caution when investing in or dealing in the securities of the Company

Confidential and Proprietary Information
© Cathay Pacific Airways Limited and its subsidiaries                                                                                                               2
Analysts Briefing 2020 Interim Results - 12th August 2020 - Cathay Pacific
Agenda

                                                        •   Briefing highlights
                                                        •   Operating Performance
                                                                 - COVID-19 Impact
                                                                 - CX & KA Passenger Services
                                                                 - CX & KA Cargo Services
                                                                 - CX & KA Operating costs
                                                                 - Subsidiaries and Associates
                                                        •   Group Financial Position
                                                        •   Responses to COVID-19
                                                        •   Q&A
                                                        •   Appendices

                                                        Hosted by:
                                                        - Martin Murray, Chief Financial Officer
                                                        - Ronald Lam, Chief Customer and Commercial Officer

Confidential and Proprietary Information
© Cathay Pacific Airways Limited and its subsidiaries                                                         3
Analysts Briefing 2020 Interim Results - 12th August 2020 - Cathay Pacific
Briefing highlights

Confidential and Proprietary Information
© Cathay Pacific Airways Limited and its subsidiaries
Analysts Briefing 2020 Interim Results - 12th August 2020 - Cathay Pacific
Unprecedented impact of COVID-19 on the Group’s businesses

                                                                                                                               $m
                                                        HK$ million                                   1H 2020    1H 2019
                                                                                                                           change
                                                        Cathay Pacific and Cathay Dragon’s
                                                                                                       (8,224)      907     -9,131
                                                        profit before taxation
                                                        Taxation                                          863      (232)   +1,095
                                                        Cathay Pacific and Cathay Dragon’s
                                                                                                       (7,361)      675     -8,036
                                                        profit after taxation
                                                        Share of (losses)/profits from subsidiaries    (2,095)       83     -2,178
                                                        Share of profits from associates                (409)       589      -998
                                                        Group attributable profit                      (9,865)     1,347   -11,212

                                                        •   The first six months of 2020 were the most challenging that the
                                                            Cathay Pacific Group has faced in its more than 70-year history.
                                                        •   The loss for the first half of 2020 included impairment and related
                                                            charges of HK$2,464 million.

Confidential and Proprietary Information
© Cathay Pacific Airways Limited and its subsidiaries                                                                          5
Analysts Briefing 2020 Interim Results - 12th August 2020 - Cathay Pacific
2020 1H performance summary

                                                        • Our 3 year transformation had built a solid foundation
                                                        • Social unrest starting in August 2019 impacted demand and operations of
                                                          the business
                                                        • In response, we reduced our passenger capacity from October 2019 and
                                                          re-built our cash reserves
                                                        COVID-19 Pandemic
                                                        • COVID-19 has led to a global collapse in the demand for air travel and
                                                          resulted in a drastic decline in the Group’s passenger revenues from
                                                          February 2020
                                                        • Cathay Pacific & Cathay Dragon’s passenger capacity was reduced on
                                                          average by 97% from April to June. Hong Kong Express ceased operations
                                                          from mid-March until the start of August.
                                                        • Cargo flight operations continued to be resilient with cargo capacity in high
                                                          demand. While Cathay Pacific continues to operate a full freighter
                                                          schedule, passenger flight reductions have had a significant impact on
                                                          overall cargo capacity
                                                        • Without a domestic segment, management expects the short-term outlook
Confidential and Proprietary Information
© Cathay Pacific Airways Limited and its subsidiaries
                                                          to remain bleak
                                                                                                                                          6
Analysts Briefing 2020 Interim Results - 12th August 2020 - Cathay Pacific
Financial performance significantly down in 2020 for passenger

   Group Financial Statistics                                                                                            1H 2020            1H 2019     Change
   Group Revenue                                                                                      HK$m                        27,669      53,547       -48.3%
   Cathay Pacific and Cathay Dragon’s (loss)/profit after taxation                                    HK$m                        (7,361)        675       -8,036
   Group attributable (loss)/profit                                                                   HK$m                        (9,865)      1,347      -11,212

   Operating Statistics
                                                                                                                         1H 2020            1H 2019     % Change
   – Cathay Pacific & Cathay Dragon
   Available tonne kilometres (ATK)                                                                   million                       8,595      16,318      -47.3%
   Available seat kilometres (ASK)                                                                    million                     27,732       80,814      -65.7%
   Available cargo & mail tonne kilometres (AFTK)                                                     million                       5,958       8,635      -31.0%
   Passenger yield                                                                                     HK₵                           55.5        54.9       +1.1%
   Cargo yield                                                                                         HK$                           2.71        1.88      +44.1%
   Cost per ATK (with fuel, excluding impairment)                                                      HK$                           3.75        3.12      +20.2%
   Cost per ATK (without fuel, excluding impairment))                                                  HK$                           2.95        2.23      +32.3%
                                                                                                       HK$
   Underlying* cost per ATK (without fuel)                                                                                           2.99        2.23      +34.1%
 * Excludes exceptional items, impairment and related charges, as well as adjusted for the effect of foreign currency movements
Confidential and Proprietary Information
© Cathay Pacific Airways Limited and its subsidiaries                                                                                                               7
Analysts Briefing 2020 Interim Results - 12th August 2020 - Cathay Pacific
Operating performance
COVID-19 Impact & Initial Response

Confidential and Proprietary Information
© Cathay Pacific Airways Limited and its subsidiaries
Analysts Briefing 2020 Interim Results - 12th August 2020 - Cathay Pacific
The impact of COVID-19 & our response

                              Survive                   Recapitalise         Restructure           Revive
                         Cost containment &                                  Right size for the   Agile recovery
                                                         Restore liquidity
                          cash preservation                                    new normal

Confidential and Proprietary Information
© Cathay Pacific Airways Limited and its subsidiaries                                                              9
Analysts Briefing 2020 Interim Results - 12th August 2020 - Cathay Pacific
Impact on Hong Kong Aviation Environment

Monthly Air Passengers in Hong Kong
‘000 Passengers
                                             Hong Kong’s aviation market was performing strongly                                       Passenger volume reduced              Heavily
                                                         before the summer of 2019                                                         since August 2019                impacted
 8,000                                                                                                                                                                     by COVID-
                                                                                                                                                                               19

 6,000

 4,000

 2,000

      0
          Jan   Feb Mar        Apr     May     Jun      Jul   Aug Sep    Oct   Nov Dec    Jan   Feb Mar    Apr   May   Jun Jul   Aug Sep   Oct   Nov Dec   Jan   Feb Mar   Apr   May   Jun
                                                  2018                                                                   2019                                          2020

                                                                        Cathay Pacific and Cathay Dragon          Others Hong Kong Passengers

 Sources: Hong Kong International Airport, Cathay Investor Relations

Confidential and Proprietary Information
© Cathay Pacific Airways Limited and its subsidiaries                                                                                                                                    10
COVID-19 Impact on the Global Aviation Industry

Estimated Airline Industry 2020 Net Loss of US$84Bn Due to COVID-19                                                                                   Airlines Face Major Liquidity Concerns
US$Bn                                                                                                                        %
             Asia                                                                                                  Global                                     As at beginning of                               Considerable risk of                     Cathay had committed
            Pacific    North America     Europe         Middle East        Africa         Latin America            Total                                     2020, typical airlines                           airlines running out of                 liquidity of 2.3 months of
     0
                                                                                                                                                            had cash reserves of 2                           cash before recovery or                  2019 revenues at start of
  (10)                                                                                                                                                       months of revenues                                      aid arrives                                 2020
             (29)        Of the estimated 2020 net loss for the industry of
  (20)                   US$84Bn, US$29Bn is expected to be from Asia

  (30)                                                                                                                                                Balance Sheet Liquidity
                                                                                                                                                      Cash and Equivalents Coverage of Revenues (1)
  (40)                      (23)                                                                                                                      Months
                                                                                                                    (84)

  (50)                                                                                                                                                10

  (60)                                                                                                                                                  8
                                           (22)
  (70)                                                                                                                                                  6
                                                            (5)
  (80)
                                                                             (2)                                                                        4
                                                                                                 (4)
  (90)
                                                                                                                                                        2
Estimated % Reduction in RPKs (2020 vs. 2019)
                                                                                                                                                        0
%           (54%)          (53%)          (56%)           (56%)            (59%)               (57%)               (55%)                                             Africa              Asia Pacific              Europe             Latin America   Middle East   North America
                                                                                                                                                                                       Min                                  Max                         Medium

Sources: Economic Performance of the Airline Industry, IATA 2020 Mid-Report dated 9 June                                                              Source: IATA’s press release, “Government Financial Aid for Airlines” dated 26 May
2020                                                                                                                                                  2020*

                                                                      Note:
Confidential and Proprietary Information
                                                                      (1) Latest available 12 months cumulative reserves. Figures for Africa, Latin America, and the Middle East may not be representative due to small sample size
© Cathay Pacific Airways Limited and its subsidiaries                                                                                                                                                                                                                               11
COVID-19 immediate response actions

                                                    Flight capacity
                                                    • Significant reductions in passenger flight capacity (97% reduction in total capacity for April and May
                                                      2020, 96% reduction for June 2020) and skeleton flight schedule in the coming months due to border
                                                      restrictions and minimal demand
                                                    • Cargo capacity loss due to extensive cuts to passenger schedule, but freighters operating at full capacity

                                                    Workforce
                                                    • Voluntary unpaid leave scheme – Two rounds with 80% and 90% employee uptake respectively
                                                    • Employee furloughs/ stand-downs are in place is several regions where labor laws allow
                                                    • Two rounds of executive pay cuts

                                                    Operating costs
                                                    • Cut in discretionary spending (e.g. marketing, training, travel etc)
                                                    • Coordinated discussions with priority relationship vendors re cash deferral, discounts, etc.
                                                    • Working with the HKSAR Government and Hong Kong Airport Authority on cost saving and cash
                                                      deferral measures
                                                    Capital expenditure
                                                    • Capex deferrals where possible
                                                    • A321neo and A350 fleet deliveries have been deferred
                                                    • Advanced negotiations ongoing with Boeing for the deferral of 777-9 deliveries

Confidential and Proprietary Information
© Cathay Pacific Airways Limited and its subsidiaries                                                   Survive     Recapitalise   Restructure     Revive          12
Current skeleton passenger flight schedule

  CX & KA Capacity Suspensions
  All but 21 destinations                          Services and frequencies maintained:
  (airports) in the CX &                           • Chinese mainland, Hong Kong, Macao, Taiwan regions (5):
  KA network have                                     Beijing, Shanghai-Pudong, and Taipei (Chengdu and Xiamen resumed from mid-Jul)
  been suspended                                   • The rest of Asia (7):
                                                      Bangkok, Ho Chi Minh City, Jakarta, Kuala Lumpur, Manila, Singapore and Tokyo-Narita
                                                   • Europe (3):
                                                     Amsterdam and London-Heathrow (Frankfurt resumed from 12th Jul)
                                                   • North America (4):
                                                      Los Angeles, New York-JFK, San Francisco and Vancouver
                                                   • Southwest Pacific (2):
                                                      Melbourne and Sydney

  UO Network Suspension
  From 23rd March to 1st August 2020, HK Express temporarily suspended flight operations, in response to significantly
  reduced travel demand and travel restrictions imposed by governments around Asia Pacific due to the COVID-19
  pandemic

Confidential and Proprietary Information
© Cathay Pacific Airways Limited and its subsidiaries                                         Survive   Recapitalise   Restructure   Revive   13
Customer and staff are a key concern

 Protecting Customers                                        Supporting Team Members

 •     10 Step Guide explaining measures taken to            •   Provision of gloves, masks, gowns, eye shields and hand
       ensure safe flying experience provided                    sanitisers to frontline staff
 •     Significant efforts to process refunds or rebooking   •   Modified inflight service introduced on all flights to
 •     Support for Marco Polo members through points             strengthen health and safety protocols
       relief                                                •   Office enhanced cleaning and entry screening, with remote
 •     Reinforcing safety of HEPA filtered cabin air             working option & segregated team protocols
Confidential and Proprietary Information
© Cathay Pacific Airways Limited and its subsidiaries                      Survive    Recapitalise   Restructure   Revive   14
Liquidity & government support

                                         • The Group was initially losing cash at a rate of HK$2.5 to 3.0 billion per month as it serviced a high level of
                                           customer refunds

    Government                           • This has subsequently reduced (as net refunds have cycled through) and is expected to remain at a rate of
    support to                             approximately HK$1.5 billion per month whilst minimal passenger services are in place
    conserve
    cash and                             • The Group has received HK$1,060 million of government grants globally, mostly in relation to COVID-19
    reduce costs
                                                    HK$640 million in relation to income grants are recognised as revenue from other services and recoveries

                                                    HK$420 million in relation to cost reductions or waivers are recognised net of respective cost categories

                                         • January – SGD175m public bond issuance (MTN)
  Steps taken to                         • February – HKD400m HK Private Placement issuance
  increase                               • March – USD304m sale and leaseback of six aircraft
  liquidity                              • June – HKD 6.0b in short term bridging loans

Confidential and Proprietary Information
© Cathay Pacific Airways Limited and its subsidiaries                                                  Survive     Recapitalise   Restructure     Revive         15
Operating performance
CX & KA Passenger Services

Confidential and Proprietary Information
© Cathay Pacific Airways Limited and its subsidiaries
COVID-19 has resulted in severe passenger capacity reductions

                                                                                                                   1H 2020   1H 2019      % Var
                                                            Available seat kilometres (ASK)          Million        27,732     80,814      -65.7%
                                                            Revenue passenger kilometres (RPK)       Million        18,668     68,078      -72.6%
                                                            Revenue Passengers carried               '000            4,389     18,261      -76.0%
                                                            Passenger load factor                    %                67.3        84.2   -16.9%pt
                                                            Passenger revenue                        HK$ million    10,396     37,449      -72.2%
                                                            Passenger yield                          HK cents         55.5        54.9      +1.1%
                                                            Passenger Revenue per ASK                HK cents         37.5        46.3     -19.0%

                                                        •     Very weak demand for passenger travel because of COVID-19 and associated
                                                              travel restrictions.

                                                        •     A ban on transit traffic through Hong Kong International Airport (HKIA) and on non-
                                                              resident arrivals into Hong Kong from overseas countries and regions was
                                                              implemented from 25 March.
                                                        •     As a result there were substantial ASK capacity reductions in the first six months of
                                                              2020, amounting to 29% in February, 73% in March, and 97% in April and May.

Confidential and Proprietary Information
© Cathay Pacific Airways Limited and its subsidiaries                                                                                           17
Passenger traffic & efficiency significantly impacted
                                                                                                                                              RASK – HK
Capacity - ASKs                                                                                                                               cents

    90,000                                                                                                                                   48.0

    80,000                                                                                                                                   46.0

    70,000                                                                          84.0%                84.2%                               44.0
                                                        84.0%                                                    80.5%
                                                                84.2%
                           84.7%
    60,000                                                                                                                                   42.0

    50,000                                                                                                                                   40.0

    40,000                                                                                                                                   38.0

    30,000                                                                                                                                   36.0

                                                                                                                                  67.3%
    20,000                                                                                                                                   34.0

    10,000                                                                                                                                   32.0

            0                                                                                                                                30.0
                           1H17                         2H17    1H18                2H18                 1H19    2H19             1H20

                           Available seat kilometres (ASK)              Load factor (as a proportion of ASK)     Passenger revenue per ASK

Confidential and Proprietary Information
© Cathay Pacific Airways Limited and its subsidiaries                                                                                                     18
The impact has been felt globally
YTD June 2020 statistics
  Americas                                              North Asia

  ASK: -64.5%                                           ASK: -73.8%
  LF: -16.7%pt                                          LF: -14.8%pt
  Yield: +7.3%                                          Yield: +1.5%

  Europe                                                Southeast Asia

  ASK: -66.9%                                           ASK: -65.7%
  LF: -18.4%pt                                          LF: -20.4%pt
  Yield: +1.3%                                          Yield: +8.0%

  Southwest Pacific                                     South Asia, Middle
                                                        East, and Africa

  ASK: -53.3%
  LF: -14.7%pt                                          ASK: -64.1%
  Yield: +6.1%                                          LF: -19.8%pt
                                                        Yield: -1.3%

Confidential and Proprietary Information
© Cathay Pacific Airways Limited and its subsidiaries                        19
Operating performance
CX & KA Cargo Services

Confidential and Proprietary Information
© Cathay Pacific Airways Limited and its subsidiaries
Cargo performance strong as a result of the market imbalance

                                                                                                      1H        1H
                                                                                                                          % Var
                                                                                                     2020      2019
                                                        Cargo revenue              HK$ million       11,177    10,275      +8.8%
                                                        Available Cargo Tonne
                                                                                   Million            5,958     8,635     -31.0%
                                                        Kilometres (AFTK)
                                                        Cargo RFTK                 Million            4,129     5,477     -24.6%
                                                        Cargo carried              '000 tonnes         667        979     -31.9%
                                                        Cargo load factor          %                   69.3      63.4    +5.9%pt
                                                        Cargo yield                HK$                 2.71      1.88     +44.1%
                                                        Cargo revenue per AFTK     HK$                 1.88      1.19     +58.0%
                                                        •    Considerable loss of available capacity as a result of the
                                                             extensive cuts to our passenger schedule.
                                                        •    Yield and load factor improved as a result of an imbalance
                                                             between capacity and demand in the cargo market.
                                                        •    Additional cargo-carrying capacity by (1) increasing the
                                                             utilisation of CX freighters; (2) chartering flights from our all-
                                                             cargo subsidiary Air Hong Kong; and (3) operating cargo-only
Confidential and Proprietary Information
                                                             passenger flights as well as carrying cargo in the passenger
© Cathay Pacific Airways Limited and its subsidiaries
                                                             cabins of Boeing 777-300ER aircraft                                   21
Higher cargo revenue efficiency due to market capacity reduction
Capacity - AFTKs                                                                                                                            Cargo Revenue per
                                                                                                                                            AFTK – HK$

      12,000                                                                                                                                            1.9

                                                                                                                                                        1.7
      10,000

                                                                                                                                                        1.5

       8,000
                                                                                                                                                        1.3
                                                        69.2%                     69.3%
                                                                68.3%                                                 65.4%
       6,000                  66.2%                                                                   63.4%                                             1.1

                                                                                                                                         69.3%          0.9
       4,000

                                                                                                                                                        0.7

       2,000
                                                                                                                                                        0.5

              0                                                                                                                                         0.3
                             1H17                       2H17    1H18              2H18               1H19             2H19               1H20

                      Load factor (as a proportion of AFTK)        Available cargo and mail tonne kilometres (AFTK)           Cargo Revenue per AFTK

Confidential and Proprietary Information
© Cathay Pacific Airways Limited and its subsidiaries                                                                                                           22
Operating performance
CX & KA Operating Costs

Confidential and Proprietary Information
© Cathay Pacific Airways Limited and its subsidiaries
Operating costs per ATK skewed by reduction in capacity

                                                        •   Cost per ATK (without fuel) adjusting for exceptional, impairments
                                                            and foreign exchange movements increased +34.1%.
                                                        •   This reflected the effect of reducing capacity when some costs are
                                                            fixed or semi-variable.
                                                        •   Average into-plane fuel prices fell -22.4%, offset by an increase in
                                                            fuel hedging losses as a result of fixed volume fuel hedges; an
                                                            overall -52.6% fuel cost decrease.
                                                        •   Fuel consumption per ATK declined -8.5%, due to decreased load
                                                            factors.
                                                        •   Aircraft utilization decreased -55.0% to 5.4 hours a day reflecting
                                                            passenger capacity cuts in 1H 2020. Consequently 16 aircraft are
                                                            not expected to re-enter meaningful economic activity with an
                                                            impairment of HK$1,212m.
                                                        •   On time performance however improved +12.3%pt to 86.5% (within
                                                            15 minutes).

Confidential and Proprietary Information
© Cathay Pacific Airways Limited and its subsidiaries                                                                              24
Focus on reducing operating cost and cash burn

        As reported (HK$M):                                                                                                   1H 2020              1H 2019                 % Var
        Staff                                                                                                                      7,420                9,042             -17.9%
        Inflight service and passenger expenses                                                                                      941                2,682             -64.9%
        Landing, parking and route expenses                                                                                        3,861                8,451             -54.3%
        Aircraft maintenance                                                                                                       3,193                4,592             -30.5%
        Depreciation, amortisation and operating leases                                                                            6,751                6,917              -2.4%
        Net finance charges                                                                                                        1,327                1,241              +6.9%
        Others (including commissions)                                                                                             1,891                3,494             -45.9%
        Total operating costs (without fuel)                                                                                     25,384               36,419              -30.3%

        Cost per ATK (without fuel, excluding impairment and related charges)                                                      2.95                  2.23          +32.3%
        Underlying * cost per ATK (without fuel)                                                                                   2.99                  2.23          +34.1%
* Underlying costs exclude exceptional items, impairment and related charges, and are adjusted for the effect of foreign currency movements. Exceptional items included redundancy costs of
HK$42 million in connection with the closure of outport crew bases and HK$2 million credit associated with the acquisition of HK Express. (2019: data security costs of HK$20 million and costs
of HK$39 million associated with the acquisition of HK Express.)

   Confidential and Proprietary Information
   © Cathay Pacific Airways Limited and its subsidiaries                                                                                                                                  25
Into plane fuel prices & hedging losses

                                                                CX Jet Cost and Calculated CX Brent Price
     100.00
       90.00           USD/BBL

       80.00
       70.00
       60.00
       50.00
       40.00
       30.00
       20.00
       10.00

                                              Jet Actual Cost            Calculated CX Brent Price             Brent Daily Spot
          Fuel costs and KPI’s                                                                       1H 2020        1H 2019        % Var
          Group gross fuel cost (HK$m)                                                                 5,719           14,693      -61.1%
          Group fuel hedging losses (HK$m)                                                             1,599              114     1302.6%
          Group fuel cost (HK$m)                                                                       7,318           14,807      -50.6%

          Average into-plane fuel price ex hedges (US$/bbl)                                          $151.96          $195.76      -22.4%
          CX&KA Fuel consumption per mATK (bbl)                                                        1,253            1,369       -8.5%
Confidential and Proprietary Information
© Cathay Pacific Airways Limited and its subsidiaries                                                                                       26
Forward fuel hedging position

Cash Flow Hedge reserve at 30 June 2020 a loss of HK$3.0 billion (pre tax)
                                                                       Fuel hedged                      Average strike price (Brent,
                                              Period
                                                                  (in thousand barrels)                         USD/Bbl)
                                  3rd Quarter 2020 *                          4,740                                       63.42
                                   4th Quarter 2020                           4,586                                       61.08
                                   1st Quarter 2021                           4,499                                       59.49
                                   2nd Quarter 2021                            4,111                                      58.03
                                   3rd Quarter 2021                           3,706                                       56.17
                                   4th Quarter 2021                           3,221                                       52.28
                                   1st Quarter 2022                           2,770                                       47.26
                                   2nd Quarter 2022                           1,864                                       44.61
                * Note: due to a forecast over hedged position, a HK$95m ineffectiveness charge has been booked as at 30 June 2020

Confidential and Proprietary Information
© Cathay Pacific Airways Limited and its subsidiaries                                                                                  27
Operating performance
Subsidiaries and Associates

Confidential and Proprietary Information
© Cathay Pacific Airways Limited and its subsidiaries
Hong Kong Express performance update

   Financial Performance                                            1H 2020           •   HK Express reported a significant loss for
                                                                                          1H 2020.
   Total Revenue                                         HK$m                  844
                                                                                      •   The airline stopped flying in mid-March
   Loss after taxation                                   HK$m                 (779)
                                                                                          because of COVID-19 and associated travel
   Ancillary revenue penetration                           %                   17.1       restrictions, and only recently reintroduced
                                                                                          some flights.
   Operating Statistics – HKE                                                         •   As at 30 Jun 2020, HK Express operated an
   Available seat kilometres (ASK)                       Million              1,726       all Airbus narrow-body fleet of 24 aircraft.
   Revenue passenger kilometres (RPK)                    Million              1,480       The young fleet had an average age of just
                                                                                          over five years.
   Passenger yield                                      HK cents               44.6
   Cost per ASK (with fuel)                             HK cents               92.3   •   On-time performance was 91.5% within 15
   Passenger load factor                                   %                   85.7       minutes.
   Aircraft utilisation                                 Hours/day               3.1   •   The average load factor was 85.7% during
   On-time performance                                     %                   91.5       the period.
   Average age of fleet                                  Years                  5.4

Confidential and Proprietary Information
© Cathay Pacific Airways Limited and its subsidiaries                                                                                  29
Other major subsidiaries

                                                        –   Air Hong Kong recorded an increase in profit in the first half of 2020 compared with the
                                                            first half of 2019 due to additional cargo-carrying capacity

                                                        –   Lower volumes (-64%) of laundry items handled and an impairment charge of HK$658
                                                            million on VLS assets, plus HK$18m of associated goodwill written off at group level

                                                        –   Suffered from significantly (-73%) lower meal volumes and an impairment charge of
                                                            HK$526 million on CPCS assets, plus HK$21m of associated goodwill written off at
                                                            group level

                                                        –   Decrease in cargo tonnage handled

Confidential and Proprietary Information
© Cathay Pacific Airways Limited and its subsidiaries                                                                                                  30
Major associates

                                                        –   Cathay Pacific has an 18.13% interest in Air China.
                                                        –   Our share of Air China’s results is based on its financial statements drawn
                                                            up three months in arrear. Consequently the results do not reflect the
                                                            impact of COVID-19 on Air China from 1st April 2020 to 30th June 2020.
                                                        –   Air China’s financial results declined in the six months to 31st March 2020.

                                                        –   Air China Cargo’s (ACC) financial results significantly improved from the
                                                            same period last year due to the higher utilisation of freighters and lower
                                                            fuel prices.

Confidential and Proprietary Information                                                                                                   31
© Cathay Pacific Airways Limited and its subsidiaries
Group Financial Position

Confidential and Proprietary Information
© Cathay Pacific Airways Limited and its subsidiaries
Financial position and cash flows

                                                                                                        30 Jun 2020                  30 Jun 2019
                                                                                                                                                         % Var
    Cash Flow                                                                                              HK$M                         HK$M

    Net cash (outflow)/inflow from operating activities                                                               (8,117)                 9,868              -182.3%
    Net cash outflow from investing activities*                                                                       (1,601)                (9,869)              -83.8%
    Net cash outflow pre financing                                                                                    (9,718)                      (1)               n/a
    Net cash inflow/(outflow) from financing activities                                                                 2,264                (2,844)             -179.6%
    * Excluding movement in other liquid funds (non-cash & non-cash equivalents)

                                                                                                        30 Jun 2020                  31 Dec 2019
    Balance Sheet                                                                                                                                        % Var
                                                                                                           HK$M                         HK$M
    Shareholders’ Funds                                                                                               49,371                 62,773               -21.3%
    Net Borrowings                                                                                                    93,033                 82,396              +12.9%
    Capital Employed (including non-controlling interests)                                                          142,408                 145,172                -1.9%

    Liquidity metrics

    Available unrestricted liquidity to the Group                                                                     15,432                 20,011               -22.9%
    Net Debt/Equity Ratio                                                                                                 1.88                 1.31        +0.57 times
    Net Debt (pre HKFRS 16)/Equity Ratio**                                                                                1.50                 0.99       +0.51 times
Confidential and Proprietary Information                ** Bank covenants are set at 2.0 on a net debt (pre HKFRS 16)/Equity basis
© Cathay Pacific Airways Limited and its subsidiaries                                                                                                                 33
Group profit/(loss) and net debt/equity ratio ten year comparison

                                    4,000                                                                                                                       2.20
                                                                                                                                              Post
                                                                                                                                              HKFRS 16
                                                                                                                                                                1.80
                                        0
          Profit/(loss) (HK$'m)

                                                                                                                                                                        D/E ratio (Times)
                                                                                                                                                                1.40
                                   (4,000)
                                                                                                                                                                1.00
                                                                                                                                          Pre
                                   (8,000)                                                                                                HKFRS 16
                                                                                                                                                                0.60

                                  (12,000)                                                                                                                      0.20
                                             1H11    1H12     1H13         1H14        1H15        1H16         1H17        1H18          1H19         1H20

                                                               Profit/(Loss)                   Net debt/equity ratio (Reported)

                                                1H 2011   1H 2012     1H 2013        1H 2014     1H 2015       1H 2016       1H 2017        1H 2018      1H 2019    1H 2020

      Profit/(Loss) Margin %                        6.0      (1.9)             0.1       0.7           3.9           0.8          (4.5)        (0.5)          2.5      (35.7)
Confidential and Proprietary Information
© Cathay Pacific Airways Limited and its subsidiaries                                                                                                                                       34
Recapitalisation Plan
        Survive              Recapitalise               Restructure   Revive

Confidential and Proprietary Information
© Cathay Pacific Airways Limited and its subsidiaries
Recapitalisation commitment from HKSAR Government and all major
shareholders
                                                            HKSAR Government committed a total of HK$27.3Bn to Cathay

                                                               –     HK$19.5Bn investment via Preference Shares subscription

                                                               –     HK$7.8Bn Bridge Loan Facility

                                                               –     Appointment of two observers to Cathay’s board

                                                            Continued Commitment from All Major Shareholders

                                                               –     Swire Pacific, Air China, and Qatar Airways have signed irrevocable
                                                                     undertakings to take up their pro-rata portion of the Rights Issue (HK$10Bn)

                                                            Investment into Cathay as Core to Hong Kong’s Status as an International
                                                             Aviation Hub and Global Financial Centre

                                                               –     Cathay is responsible for 55.3% of passenger traffic at the Hong Kong
                                                                     International Airport

                                                               –     The aviation and foreign tourism sector contributes to 10.2% of Hong Kong’s
                                                                     GDP, with aviation supporting ~333,000 jobs

                                                            Source: IATA The Importance of Air Transport to Hong Kong 2018 Report, OAG 2019

Confidential and Proprietary Information
© Cathay Pacific Airways Limited and its subsidiaries                                 Survive        Recapitalise       Restructure           Revive   36
Recapitalisation plan updates

  Instruments                                                                                  Size (HK$)

                                                                                                                                 HKSAR Government provided the Bridge
  Bridge Loan Facility                                                                          HK$7.8Bn
                                                                                                                                    Loan Facility (1) on 9 June 2020

                                                                                                                                Fully subscribed and proceeds received on
  Rights Issue to Existing Shareholders                                                        HK$11.7Bn
                                                                                                                                              11 August 2020

                                                                                                                              Fully subscribed by HKSAR Government and
  Preference Shares (with Warrants)                                                            HK$19.5Bn
                                                                                                                                  proceeds received on 12 August 2020

                                                                                                                                 Potentially further access equity and debt
  Total Capital Raise                                                                         HK$39.0Bn
                                                                                                                                   markets to strengthen balance sheet

   Note: (1) Available for 12 months in one or more drawdowns, each loan matures 18 months after the date of the relevant drawdown
Confidential and Proprietary Information
© Cathay Pacific Airways Limited and its subsidiaries                                                           Survive         Recapitalise   Restructure     Revive         37
Pro Forma Financial Impact
Based on Post-HKFRS 16 Financials as of 30 June 2020

  Increase equity balance by at least                                          Reduce net debt by at least                                                 Reduce gearing to
             HK$31Bn                                                                  HK$31Bn                                                                   0.77x

                     Total Equity (HK$MM)                                           Net Financial Debt (HK$MM)                                                     Gearing (x)
                                                                                 93,033                                                                1.88x
                                                 80,587
                   HK$31Bn                                                                           HK$31Bn

                                                                                                                61,817
            49,371

                                                                                                                                                                                       0.77x

      As of 30 Jun 2020            Post Proposed Recapitalisation           As of 30 Jun 2020       Post Proposed Recapitalisation                As of 30 Jun 2020        Post Proposed Recapitalisation

* Includes Preference Shares                                         * Net Financial Debt = Total Financial Debt - Cash                      * Gearing = Net Debt / Total Equity (post-HKFRS 16)

Notes: Refer to previous slide for detailed information on size, maturity and mechanism. Assumes that the Preference Shares and Rights Shares had been issued, in respect of balance sheet on
30 June 2020. The pro forma financial effects of the Recapitalisation Plan as presented (a) are for illustrative purposes only and do not purport to be indicative or a projection of the results and
financial position of Cathay immediately after the completion of the Recapitalisation Plan, (b) are based on the audited consolidated financial statements of Cathay for Interim 2020
Confidential and Proprietary Information
© Cathay Pacific Airways Limited and its subsidiaries                                                                Survive          Recapitalise         Restructure            Revive                38
Restructure
        Survive             Recapitalise                Restructure   Revive

Confidential and Proprietary Information
© Cathay Pacific Airways Limited and its subsidiaries
Overview of restructure plan

           Fleet and Network                                   Impairments                                Rationalisation

                                                        • Reduction in asset values and
     • Fleet & network optimization                                                                 • By fourth quarter of 2020,
                                                          the provision for onerous
                                                                                                      management will recommend
                                                          contracts on 16 aircraft that
     • Fleet deliveries deferred to                       are unlikely to re-enter
                                                                                                      to the Board the optimum size
       meet the Group’s requirement                       meaningful economic service
                                                                                                      and shape of the Group to
                                                                                                      meet the air travel needs of
                                                          again before retirement or
     • Grounding and transfer of                          return to lessors
                                                                                                      Hong Kong
       approximately one-third of
       passenger aircraft to parking                                                                • Inevitably this will involve
                                                        • Reduction in carrying value of
       locations outside of Hong                                                                      rationalisation
                                                          assets of Cathay Pacific
       Kong                                               Catering Services and Vogue
                                                                                                    • Early voluntary retirement for
                                                          Laundry Services
     • Accelerated retirement of                                                                      older cockpit crew announced
       older fleet types                                • To reassess carrying values at
                                                          end of 2020

Confidential and Proprietary Information
© Cathay Pacific Airways Limited and its subsidiaries                                 Survive   Recapitalise   Restructure      Revive   40
Realignment of fleet deliveries and retirements
          Deliveries (including Hong Kong Express)

                                                          2020 deliveries
            Airline                Aircraft type                               Delayed
                                                        (latest fleet plan)
            UO                     A320neo                       4                -
            KA                     A321neo                       2                4
            CX                     A350-900                      3                1
            CX                     A350-1000                     1                2
                                   Total                        10                7
                                                                                                               Net 14 less aircraft than
          Retirements (owned and leased)                                                                       previously planned.

                                                           Retired or
            Airline                Aircraft type                              Accelerated
                                                        impaired in 2020
            CX/KA                  A330-300                      7                4
            CX                     777-300ER                     2                1
            KA                     A320-200                      7                2
            KA                     A321-200                      1                -
                                   Total                        17                7
Confidential and Proprietary Information
© Cathay Pacific Airways Limited and its subsidiaries                                 Survive   Recapitalise     Restructure      Revive   41
Fleet simplification and transfer

•       Continued simplification of the number of sub-fleets is reducing cost and complexity in deployment

•       Continued prudent operational and asset management considerations
          –       Transfer of approximately a third of the passenger aircraft to parking locations outside of Hong Kong over the
                  coming months

          –       Retirement of older fleet types.
                    •       One B777-200 aircraft and one Boeing 747-400BCF freighter were retired in 2020

          –       Return of aircraft
                    •       Return of four A320/A321 family and two A330-300s in the remainder of 2020

Confidential and Proprietary Information
© Cathay Pacific Airways Limited and its subsidiaries                             Survive   Recapitalise   Restructure   Revive    42
Revive
         Survive             Recapitalise               Restructure   Revive

Confidential and Proprietary Information
© Cathay Pacific Airways Limited and its subsidiaries
IATA sees a prolonged revival, with risk tilted to the downside

               Source: IATA/ Tourism Economics Air Passenger Forecasts
Confidential and Proprietary Information
© Cathay Pacific Airways Limited and its subsidiaries                    Survive   Recapitalise   Restructure   Revive   44
Positioning Cathay Pacific Group for the future

                                         1              Global Aviation Leader

                                                                Core to Hong Kong and the GBA as an International Aviation Hub and Global
                                                           2    Financial Centre

                                                                Leading Cargo Business Supporting Hong Kong’s Position as the #1 Global
                                                           3    Air Cargo Hub

                                         4              Strong and Aligned Shareholders and Strong Commercial Relationships

Confidential and Proprietary Information
© Cathay Pacific Airways Limited and its subsidiaries                                          Survive   Recapitalise   Restructure   Revive   45
1        Global Aviation Leader (I)

                                                                                                                      World’s Top Airline Award              World’s Top 10 Airlines Award
                  Hong Kong’s Flag Carrier and the 8th Largest Carrier of
                                                                                                                               - Skytrax                          - AirlineRatings.com
                          International Passengers Globally
                                                                                                                        4th           6th           5th        Top 10          Top 10          Top 10
                                                                                                                       2019          2018          2017         2020            2019            2018

                                           International Passenger RPK (Bn)
                                                                                                                      Best Airline Economy Class
           302                                                                                                              (Cathay Dragon)                    Best Airline Business Class
                                                                                                                   Best Frequent Flyer (Marco Polo)          - The Annual TTG Travel Awards
                            247              244                                                                    - Business Traveler China Awards

                                                              171                                                             2018          2018                        2018            2017
                                                                    155           154            152
                                                                                                       139

                                                                                                                        Best Long Haul Airline                     Best Airline Brand
                                                                                                                    - Gulf Cooperation Council Food              - The DesignAir Awards
                                                                                                                            and Travel Awards
                                                                                                             (1)
                                                                                                                                     2017                                       2016

     Source: IATA WATS World Air Transport Statistics 2019 Report

                                                                      Note:
Confidential and Proprietary Information
                                                                      (1) Cathay Pacific Group
© Cathay Pacific Airways Limited and its subsidiaries                                                                    Survive            Recapitalise   Restructure           Revive                 46
1      Global Aviation Leader (II)

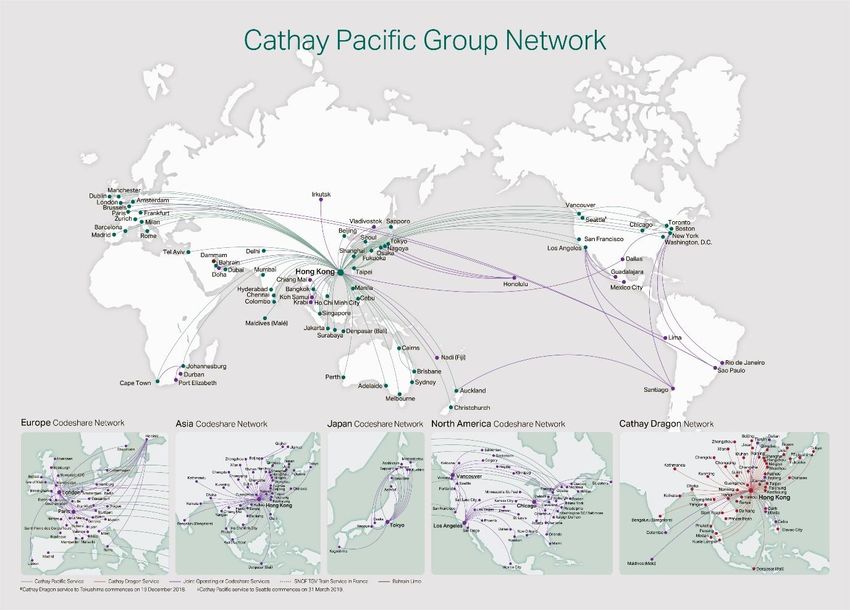
            Differentiated Services Capturing the Entire Breadth of                                    Industry Leading Global Scale and Footprint
         Customers in Hong Kong and Further Supported by Associated
                                  Companies
                                                                                              Core to Hong Kong’s Status as an International Aviation Hub and
                                                                                                                 Global Financial Centre
      Holds 4 out of 6 Air Operating                    Supported by Significant
       Certificates for Hong Kong                       Subsidiary & Associate
      Passenger and Cargo Airlines                           Companies

                                                        Cargo Handling        Catering

                                                        Ground Handling       Commercial
                                                                               Laundry

                                                                     FFP Program

                              Other Carrier                                                    119 Destinations globally 35                    Countries covered

                              Other Carrier
                                                         Airline Operator     Cargo Airline
                                                                                              33,000 Employees           235                  Aircraft in operation

Confidential and Proprietary Information
© Cathay Pacific Airways Limited and its subsidiaries                                             Survive       Recapitalise    Restructure       Revive              47
2
          Core to Hong Kong and the Greater Bay Area as an International
          Aviation Hub and Global Financial Centre (I)
        Cathay is responsible for 55.3% of Hong Kong International     The aviation and foreign tourism sector contributes to 10.2%
       Airport’s passenger traffic by ASK and is at the core of Hong   of Hong Kong’s GDP, with aviation supporting ~333,000 jobs
                       Kong’s aviation ecosystem

                                                                                                                         Aviation
                                                                                                                          10.2%

                             55.3%

                                                                                            Other
                                                                                            89.8%
                                                        Other
                                                        44.7%

       Source: OAG 2019                                                Source: IATA The Importance of Air Transport to Hong Kong 2018 Report

Confidential and Proprietary Information
© Cathay Pacific Airways Limited and its subsidiaries                       Survive         Recapitalise       Restructure          Revive     48
2
           Core to Hong Kong and the Greater Bay Area as an International
           Aviation Hub and Global Financial Centre (II)

        • Hong Kong is a premier logistics hub and springboard to the                                                            • The Greater Bay Area Plan supports consolidating and
          Chinese mainland, with strategic location and world-class                                                                enhancing Hong Kong's status as international financial centre
          infrastructure
                                                                                                                                 • China Development Bank has committed RMB360Bn (2020
        • Greater Bay Area Plan will continue to enhance Hong Kong's                                                               quota) to the development of the Greater Bay Area
          position as an international aviation, maritime and logistics hub
                    GBA     Tokyo      SF Bay NY Met
                                                                                                                                 • Strengthens Hong Kong’s status as a global offshore RMB hub
                                                                         7 Airports in GBA w ith 3 Airports Serving
                                                                            +50MM Passenger Traffic Annually                       and as an international asset management centre
 # of Airports         7          2             4           7

 Surface Area     56.5K     36.7K        17.4K         34.5K

 Population       68MM      44MM          8MM          24MM                                                                                                           • Increased cross-boundary RMB
 GDP              1.4Tn     1.9Tn        0.8Tn         1.8Tn       Guangzhou Baiyun
                                                                                                                                                                        interbank lending
 GDP Grow th       7.9%      3.6%         2.7%         3.5%

                                                                                                               Huizhou Pingtan
                                                                                                                                                                      • Enhanced Shenzhen-Hong
Greater Bay Area is the                                         Foshan Shadi
                                                                                                                                                                        Kong Stock Connect
                                                                                             Shenzhen Bao'an
Largest Aviation Hub in
the World by Population
                                                                                                                                                                      • Relaxed bond capital market
Served
                                                                                Macau                                                                                   issue requirements
                                                                                                HKIA
                               International Airport
                               Domestic Airport
                               Bridge In Service
                                                                             Zhuhai Jinwan                                                                            • Reduced regulation on
                               Bridge Under Construction                                                                                                                insurance industry
                               High Speed Rail In Service
                               High Speed Rail Under Construction/ Planned

Source: Greater Bay Area Aviation Report 2019, 2018 Constitutional and Mainland Affairs Bureau
 Confidential and Proprietary Information
 © Cathay Pacific Airways Limited and its subsidiaries                                                                                    Survive      Recapitalise    Restructure      Revive         49
3
          Leading Cargo Business Supporting Hong Kong’s Position as the
          #1 Global Air Cargo Hub

                                                                                                                        40% Market Share in the
            3rd       Largest Air Cargo Carrier                                                                         #1 Global Air Cargo Hub

         Cathay is the world’s 3rd largest carrier of international air                                     Hong Kong is the #1 global air cargo hub with Cathay
                         cargo by volume                                                                          Pacific handing 40% of annual volume

                                  Freight Volume (Bn Tonne Km)                                                                        Cargo Volume (Tonnes)
            12.7                 12.7
                                                        11.6                                                         5.1
                                                                                                         40%                         4.5
                                                                          8.5                                        2.0                            3.8
                                                                                              7.8
                                                                                                                                                                   3.0            2.8

                                                                                                                     3.1

                                                           (1)
          Carrier 1            Carrier 2                               Carrier 4            Carrier 5             Hong Kong         Hub 2          Hub 3          Hub 4          Hub 5

                                                                                                        Source: Airport Council International 2019 World Airport Traffic Rankings, Cathay
       Source: IATA WATS World Air Transport Statistics 2019 Report
                                                                                                        annual report
                                                                 Note:
Confidential and Proprietary Information
                                                                 (1) Cathay Pacific Group
© Cathay Pacific Airways Limited and its subsidiaries                                                          Survive          Recapitalise        Restructure           Revive            50
4
           Strong and Aligned Shareholders and Strong Commercial
           Relationships
 Strong and Supportive Shareholders                                                          Founding Member of Oneworld Alliance
                              Swire Pacific Limited
                              • Ownership in Cathay: 45.00%
                              • Hong Kong based international conglomerate
                                with a diversified portfolio across property,
                                aviation, beverage, marine services,and trading
                                & industrials

                              Air China Limited
                              • Ownership in Cathay: 29.99%
                              • Flag carrier in China based in Beijing (Cathay
                                owns 18.13% of Air China)
                              • Intensive co-operation with Air China in code
                                sharing and FFP programs

                              Qatar Airways Company
                              • Ownership in Cathay: 9.99%
                              • State-owned flag carrier of Qatar
                              • Further strengthen Cathay’s network in the                  Serves 535MM passengers into 1,100 destinations
                                EMEA region                                                               in 180 countries

 Source: Oneworld Alliance website
                                                                                              Member airline flights take off or land every 5
                                                                                                             seconds, 24 / 7
Confidential and Proprietary Information
© Cathay Pacific Airways Limited and its subsidiaries                             Survive     Recapitalise    Restructure       Revive          51
Outlook

                                                        •   International Air Transport Association (IATA) forecasts very gradual
                                                            recoveries over a protracted period.
                                                        •   The recapitalisation has given us time and a platform from which to
                                                            develop a strategy to ensure our sustainability, while meeting our
                                                            repayment commitments to the Government and returns to our
                                                            shareholders.
                                                        •   We will continue to closely monitor market demand and be agile
                                                            during recovery to pre-crisis levels.
                                                        •   Commitment to customer and staff safety remains a priority, and we
                                                            are grateful to staff for their hard work and commitment during
                                                            challenging times.
                                                        •   Strong stakeholder support who remain bullish on Hong Kong as both
                                                            a financial centre and an International Aviation hub from the
                                                            opportunities created with the development of the GBA.

Confidential and Proprietary Information
© Cathay Pacific Airways Limited and its subsidiaries                                                                          52
Q&A
For more information, please visit our website
www.cathaypacific.com

Confidential and Proprietary Information
© Cathay Pacific Airways Limited and its subsidiaries
You can also read