Pan American Silver Investor Presentation - May 16, 2019
←
→
Page content transcription
If your browser does not render page correctly, please read the page content below
Pan American Silver
Investor Presentation
      May 16, 2019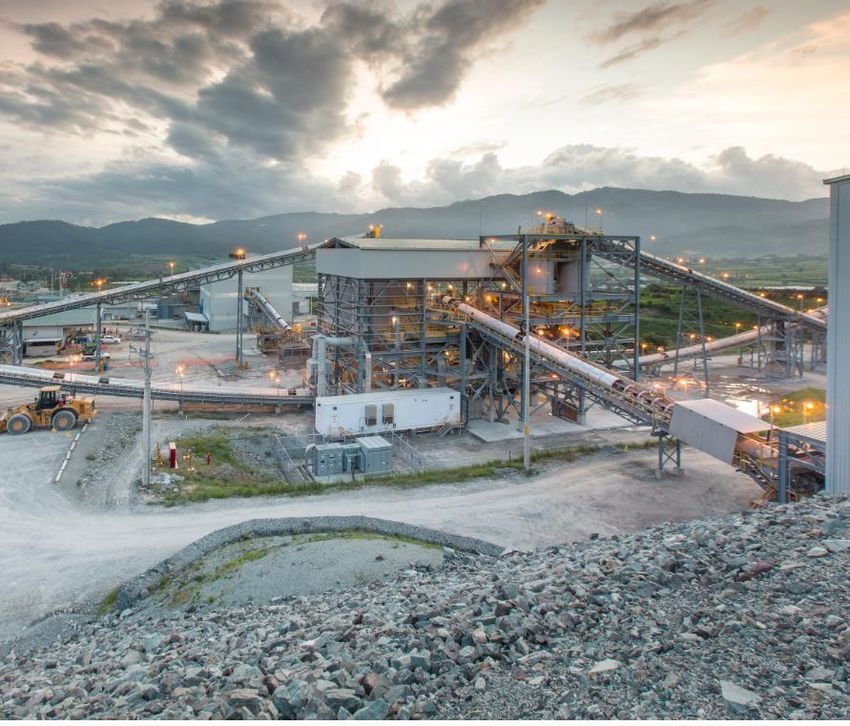
Cautionary Note
Non-GAAP Measures

This presentation of Pan American Silver Corp. (“Pan American” or the “Company”), which includes reference to the assets acquired in the Tahoe Resources Inc. (“Tahoe”) February 22, 2019 acquisition, refers to
various non-GAAP measures, such as cash costs per payable ounce of silver, net of by-product credits (“Cash Costs”), all-in sustaining cost (“AISC”), all-in sustaining cost per silver ounce sold, free cash flow, operating
margin, operating margin per ounce, total debt, adjusted (loss) earnings, adjusted (loss) earnings per share and working capital. Free cash flow is calculated as net cash generated from operating activities less cash
invested in sustaining capital. Pan American believes the inclusion of sustaining capital investments better reflects total operating cash flows. Operating free cash flow does not have any standardized meaning
prescribed by GAAP and is therefore unlikely to be comparable to similar measures presented by other companies.

These measures do not have a standardized meaning prescribed by IFRS as an indicator of performance, and may differ from methods used by other companies. Readers should refer to the “Alternative Performance
(non-GAAP) Measures” section in Pan American’s Management’s Discussion and Analysis for the period ended March 31, 2019, available at www.sedar.com. For non-GAAP information pertaining to prior years,
please also refer to our Management’s Discussion and Analysis for the respective year-ends.

Reporting Currency and Financial Information

Unless we have specified otherwise, all references to dollar amounts or $ are to United States dollars.

Cautionary Note Regarding Forward Looking Statements and Information

Certain of the statements and information in this presentation constitute “forward-looking statements” within the meaning of the United States Private Securities Litigation Reform Act of 1995 and “forward-looking
information” within the meaning of applicable Canadian provincial securities laws. All statements, other than statements of historical fact, are forward-looking statements or information. Forward-looking
statements or information in this presentation relate to, among other things, future financial and operational performance; future production of silver, gold and other metals produced by the Company, including
the newly acquired Tahoe mines; future updates of our mineral reserves and resources, including the newly acquired Tahoe assets; our expectations with respect to future metal prices and market trends; potential
restart of operations at the Escobal mine; our development of the Navidad project; the successful implementation of our sustainability plans and programs and timing thereof; and the Company’s plans and
expectations for its properties and operations.

These statements and information reflect Pan American’s current views with respect to future events and are necessarily based upon a number of assumptions that, while considered reasonable by Pan American,
are inherently subject to significant operational, business, economic and regulatory uncertainties and contingencies. These assumptions include: our ability to successfully integrate the operations and employees
and realize synergies and cost savings at the times, and to the extent, anticipated; tonnage of ore to be mined and processed; ore grades and recoveries; prices for silver, gold and base metals remaining as
estimated; currency exchange rates remaining as estimated; capital, decommissioning and reclamation estimates; our mineral reserve and recourse estimates and the assumptions upon which they are based; prices
for energy inputs, labour, materials, supplies and services (including transportation); no labour-related disruptions at any of our operations; no unplanned delays or interruptions in scheduled production; all
necessary permits, licenses and regulatory approvals for our operations are received in a timely manner; and our ability to comply with environmental, health and safety laws. The foregoing list of assumptions is not
exhaustive.

Pan American cautions the reader that forward-looking statements and information involve known and unknown risks, uncertainties and other factors that may cause actual results and developments to differ
materially from those expressed or implied by such forward-looking statements or information contained in this presentation and Pan American has made assumptions and estimates based on or related to many of
these factors. Such factors include, without limitation: restart of the Escobal mine, expansion of the La Colorada mine, development of Navidad, fluctuations in silver, gold and base metal prices; fluctuations in prices
for energy inputs, labour, materials, supplies and services (including transportation); fluctuations in currency markets (such as the Canadian dollar, Peruvian sol, Mexican peso, Argentine peso, Bolivian boliviano and
Guatemalan quetzal versus the U.S. dollar); operational risks and hazards inherent with the business of mining (including environmental accidents and hazards, industrial accidents, equipment breakdown, unusual
or unexpected geological or structural formations, cave-ins, flooding and severe weather); risks relating to the credit worthiness or financial condition of suppliers, refiners and other parties with whom Pan
American does business; inadequate insurance, or inability to obtain insurance, to cover these risks and hazards; employee relations; relationships with, and claims by, local communities and indigenous populations;
our ability to obtain all necessary permits, licenses and regulatory approvals in a timely manner; changes in laws, regulations and government practices in the jurisdictions where we operate, including
environmental, export and import laws and regulations; diminishing quantities or grades of mineral reserves as properties are mined; increased competition in the mining industry for equipment and qualified
personnel; and those factors identified under the caption “Risks and Uncertainties” in Pan American’s most recent management’s discussion and analysis, under the caption “Risks Related to Pan American’s
Business” in Pan American’s most recent form 40-F and Annual Information Form, and under the caption “Risk Factors” in Pan American’s management information circular dated December 4, 2018 with respect to
the arrangement with Tahoe and the special meeting of Pan American’s shareholders on January 8, 2019, each filed with the United States Securities and Exchange Commission and Canadian provincial securities
regulatory authorities, respectively. Although Pan American has attempted to identify important factors that could cause actual results to differ materially, there may be other factors that cause results not to be as
anticipated, estimated, described or intended. Investors are cautioned against undue reliance on forward-looking statements or information. Forward-looking statements and information are designed to help
readers understand management’s current views of our near and longer term prospects and may not be appropriate for other purposes. Pan American does not intend, nor does it assume any obligation to update
or revise forward-looking statements or information, whether as a result of new information, changes in assumptions, future events or otherwise, except to the extent required by applicable law.

  2                                                                                          May 16, 2019
Cautionary Note
Technical Information

Scientific and technical information contained in this presentation with respect to Pan American Silver Corp. has been reviewed and approved by Martin Wafforn, P.Eng., SVP Technical Services and Process
Optimization, and Chris Emerson, FAusIMM, VP Business Development and Geology, who are Pan American’s qualified persons for the purposes of National Instrument 43-101 (“NI 43-101”). Mineral reserves in
this presentation were prepared under the supervision of, or were reviewed by, Martin Wafforn and Chris Emerson.

See Pan American’s Annual Information Form dated March 12, 2019, available at www.sedar.com for further information on Pan American’s material mineral properties as at December 31, 2018,
including information concerning associated QA/QC and data verification matters, the key assumptions, parameters and methods used by the Pan American to estimate mineral reserves and mineral
resources, and for a detailed description of known legal, political, environmental, and other risks that could materially affect Pan American’s business and the potential development of Pan
American’s mineral reserves and resources. Please also refer to Pan American’s press release dated October 23, 2018, with respect to the La Colorada mine exploration results.

See Tahoe’s Annual Information Form dated February 22, 2018, available at www.sedar.com for further information on Tahoe’s material mineral properties as at December 31, 2017, including
information concerning associated QA/QC and data verification matters, the key assumptions, parameters and methods used by the Tahoe to estimate mineral reserves and mineral resources, and
for a detailed description of known legal, political, environmental, and other risks that could materially affect Pan American’s business and the potential development of Tahoe’s mineral reserves
and resources.

  3                                                                                    May 16, 2019
Cautionary Note About Mineral Reserves and
Resources
The mineral reserves and resources of Pan American in this presentation reflect our year-end 2018 mineral reserves and resources estimates (excluding the newly acquired Tahoe assets) as announced in the news
release dated February 21, 2019 and Tahoe’s mineral reserves and resources in this presentation reflect its mineral reserves and resources estimates as of January 1, 2018 announced on February 15, 2018. See
presentation appendix for more detailed information. Pan American intends to provide future mineral reserve and resource updates to include the Tahoe assets.
Cautionary Note to US Investors Concerning Estimates of Mineral Reserves and Resources
This presentation has been prepared in accordance with the requirements of Canadian securities laws, which differ from the requirements of U.S. securities laws. Unless otherwise indicated, all mineral reserve and
resource estimates included in this presentation have been prepared in accordance with Canadian National Instrument 43-101 – Standards of Disclosure for Mineral Projects (‘‘NI 43-101’’) and the Canadian Institute
of Mining, Metallurgy and Petroleum classification system. NI 43-101 is a rule developed by the Canadian Securities Administrators that establishes standards for all public disclosure an issuer makes of scientific and
technical information concerning mineral projects.
Canadian standards, including NI 43-101, differ significantly from the requirements of the United States Securities and Exchange Commission (the “SEC”), and information concerning mineralization, deposits,
mineral reserve and resource information contained or referred to herein may not be comparable to similar information disclosed by U.S. companies. In particular, and without limiting the generality of the
foregoing, this presentation uses the terms ‘‘measured resources’’, ‘‘indicated resources’’ and ‘‘inferred resources’’. U.S. investors are advised that, while such terms are recognized and required by Canadian
securities laws, the SEC has not recognized them under Industry Guide 7 prior to the adoption of the modernization of Property Disclosure for Mining Registrants. The requirements of NI 43-101 for identification of
‘‘reserves’’ has not the same as those of the SEC, and reserves reported by Pan American in compliance with NI 43-101 may not qualify as ‘‘reserves’’ under SEC standards. Under U.S. standards, mineralization may
not be classified as a ‘‘reserve’’ unless the determination has been made that the mineralization could be economically and legally produced or extracted at the time the reserve determination is made. U.S.
investors are cautioned not to assume that any part of a “measured resource” or “indicated resource” will ever be converted into a “reserve”. U.S. investors should also understand that “inferred resources” have a
great amount of uncertainty as to their existence and great uncertainty as to their economic and legal feasibility. It cannot be assumed that all or any part of “inferred resources” exist, are economically or legally
mineable or will ever be upgraded to a higher category. Under Canadian securities laws, estimated “inferred resources” may not form the basis of feasibility or pre-feasibility studies except in rare cases. Disclosure
of “contained ounces” in a mineral resource is permitted disclosure under Canadian securities laws. However, the SEC has previously only permitted issuers to report mineralization that does not constitute
“reserves” by SEC standards as in place tonnage and grade, without reference to unit measures. Accordingly, information concerning mineral deposits set forth herein may not be comparable with information made
public by companies that report in accordance with U.S. standards.

  4                                                                                         May 16, 2019
The World’s Premier Silver Mining Company
World class primary silver asset portfolio with the largest silver reserve base 1
An industry leader in high margin / low cost production
Robust growth potential with: Escobal restart, expansion at La Colorada following recent discovery, and
development of Navidad, one of the world’s largest undeveloped primary silver deposits
25-year proven track record of responsibly building and operating mines in Latin America
Strong financial position, enabling the Company to advance key growth projects
Largest publicly traded silver mining company by free float
(1) See presentation appendix for more detailed information on Pan American’s and Tahoe’s reserves and resources.
5 May 16, 2019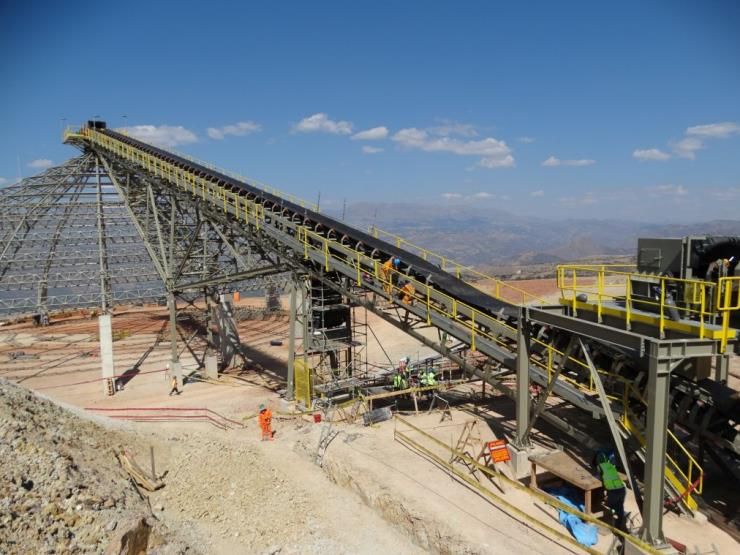
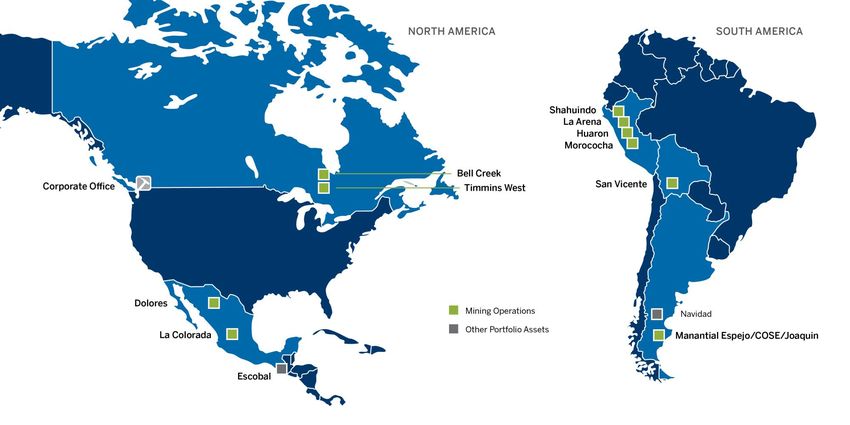
Diversified Portfolio Across the Americas

6                May 16, 2019
Tahoe Transaction:
Accretive on Reserves per Share
The Tahoe transaction increased silver equivalent reserves per share nearly 50%
from 4.3 AgEqOz/share to 6.4 AgEqOz/share.
                                    1,600                                                                                                                                                               7.0
                                                                                                                                                                                       1,337
                                    1,400                                                                                                                                                               6.0

                                                                                                                                                                                                                  Silver equivalent reserve ounces/share
Silver equivalent reserves (Moz)1

                                    1,200
                                                                                                                                                                                                        5.0
                                    1,000
                                                                                                                                                                                                        4.0
                                     800
                                                                                                                                                 639                 662
                                                                    590                603                 580                584                                                                       3.0
                                     600              531

                                            346                                                                                                                                                         2.0
                                     400

                                     200                                                                                                                                                                1.0

                                       0                                                                                                                                                                0.0
                                            2011      2012         2013               2014                2015               2016               2017                2018          March 2019 2

                                            Silver   Gold AgEq        Zinc AgEq              Lead AgEq                Copper AgEq                 Silver equivalent reserve ounces/share
  (1) Silver equivalent reserves are estimated using average market prices as published by the London Metal Exchange (“LME”, for zinc, lead, copper) and London Bullion Market Association (“LBMA”, for silver and gold).
  (2) The silver equivalent reserves reflect Pan American’s year-end 2018 mineral reserve estimates as announced in the news release dated February 21, 2019 and Tahoe’s mineral reserves estimates for year-end 2017
  announced on February 15, 2018. The silver equivalency was calculated using 2018 annual average market prices as published by the LME (for zinc and copper) and LBMA (for silver and gold).
  (3) See presentation appendix for more detailed information on the Pan American’s and Tahoe’s reserves and resources.

    7                                                                                          May 16, 2019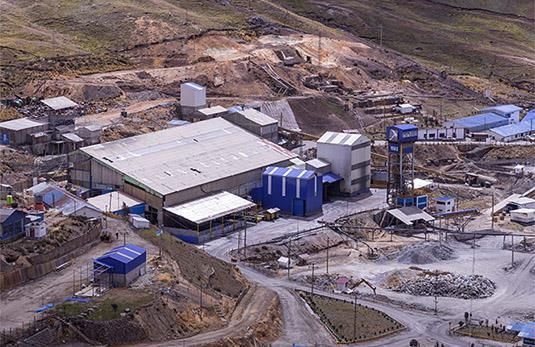
Tahoe Transaction:
      Accretive on Production per Share
      The Tahoe acquisition increased silver equivalent production per share by 22% based on 2019
      Guidance, before any consideration for potential Escobal production(1).

                                                                       Silver equivalent production              Silver equivalent production (oz)/share            97.8     0.7
                                                   100

                                                                                                                                                                                   Silver equivalent production (oz)/share
                                                                                                                                                                             0.6
             Silver equivalent production (Moz)2

                                                   80
                                                                                                                                                                             0.5

                                                                                                                                                      58.5
                                                   60                                                                                 53.9                                   0.4
                                                                                                          51.6           51.5
                                                                                           46.7
                                                                              41.1
                                                                                                                                                                             0.3
                                                   40           35.3
                                                         29.7
                                                                                                                                                                             0.2

                                                   20
                                                                                                                                                                             0.1

                                                    0                                                                                                                        0.0
                                                         2011   2012          2013         2014           2015          2016         2017            2018           2019
                                                                                                                                                                  Guidance
(1)    Based on the 2019 Guidance. Please refer to the MD&A for the period ended March 31, 2019 for more information.
(2)    Silver equivalent production is calculated using annual average market prices as published by the LME and LBMA, and budget prices for the 2019 Guidance.

       8                                                                                          May 16, 2019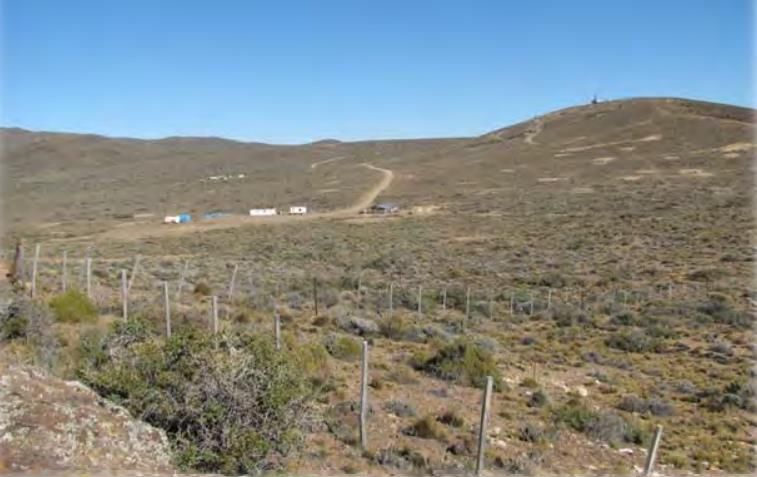
Strong Operating Margins through
    Cost Discipline
    Generated a cumulative operating margin1 of ~$0.5 billion dollars over the 2015 to 2018 period.

                                                     $700                                                                                                                          $20
            Cumulative Operating Margin (Millions)

                                                                                                                                                                                           $/oz
                                                                                            $17.35                $16.99                                                           $18
                                                     $600                                                                              $15.61
                                                                    $15.53
                                                                                                                                                              $14.50
                                                                                                                                                                                   $16
                                                     $500                                                                                                                          $14
                                                                    $14.49

                                                                                                                                                                                   $12
                                                     $400                                   $11.94
                                                                                                                                                                                   $10
                                                                                                                  $10.28
                                                     $300                                                                               $9.68
                                                                                                                                                         $7.75 - $10.75
                                                                                                                                                                                   $8

                                                     $200                                                                                                                          $6

                                                                                                                                                                                   $4
                                                     $100
                                                                                                                                                                                   $2
                                                                                                                                                                               2
                                                       $0                                                                                                                          $0
                                                                                                                                                                           2
                                                                    2015                    2016     3            2017           1     2018             2019 Guidance
                                                                                 1                            1                                 1
                                                       All-in sustaining costs       Operating Margin per ounce      Cumulative Operating Margin    Average Realized Silver Price

(1) All-in sustaining costs per ounce (AISC), Operating Margin per ounce and Cumulative Operating Margin are non-GAAP financial measures; see the “Non-GAAP Measures” section of our Cautionary Note
on page 2 of this presentation. Operating Margin per ounce and Cumulative Operating Margin are calculated as the difference between the average realized silver price and AISC, on a per ounce sold basis
and on a dollar basis, respectively.
(2) 2019 Guidance based on the budgeted silver price and the mid-point of the 2019 Guidance range for AISC on a consolidated silver basis and silver production; for more information on the 2019
      9 please refer to the MD&A for the period ended March 31, 2019.
Guidance,                                                                              May 16, 2019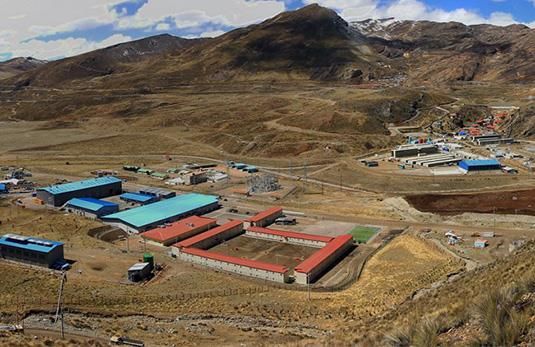
Compelling Valuation
An attractive entry point post Tahoe transaction for investors seeking exposure to the
premier silver mining company

                                                                2019 P/CF
                     25.00x
                     20.00x                                                                                        18.25x
                                                                                                       14.29x
                     15.00x                                                                   12.43x
                                                                                      9.76x
                     10.00x                              7.38x     7.71x    8.18x
                               5.50x   6.19x    6.40x
                      5.00x
                      0.00x

                                                                 2020 P/CF
                      25.00x                                                                                        22.21x
                      20.00x                                                                              16.41x
                      15.00x
                                                                                  8.26x   8.26x   9.46x
                      10.00x                                             6.22x
                                               5.18x    5.56x    5.59x
                               3.61x   3.61x
                       5.00x
                       0.00x

     Source: The above graphs were prepared based solely on data from FactSet Consensus Estimates as at April 30, 2019 without independent verification.

10                                                                 May 16, 2019
Compelling Valuation
An attractive entry point post Tahoe transaction for investors seeking exposure to the
premier silver mining company
2019 EV/EBITDA
25.00x
20.00x 18.72x
15.00x
9.30x
10.00x 7.70x 8.21x
7.07x
5.62x
4.50x
5.00x
0.00x
HOC-LON FSM PAAS FRES-LON CDE HL WPM
2020 EV/EBITDA
24.55x
25.00x
20.00x
16.04x
15.00x
10.00x
6.05x 6.37x
4.02x 4.58x 4.63x
5.00x 2.53x
0.00x
FSM HOC-LON PAAS CDE HL FRES-LON WPM MAG
Source: The above graphs were prepared based solely on data from FactSet Consensus Estimates as at April 30, 2019 without independent verification.
11 May 16, 2019Escobal: One of the Largest Primary Silver Deposits
Escobal compares favorably against other assets held by large and mid-cap silver companies;
it has the largest production1, largest reserve base2 , and an attractive cost position3
1
Dolores
Huaron
2017 Silver Production (Moz Ag)
(1) Escobal’s silver production and AISC is based on Tahoe’s disclosure for 2016. Escobal has not operated since June 2017. See slide 26 for further details.
(2) Bubble size represents silver reserves; see presentation appendix for more detailed information on Pan American’s and Tahoe’s reserves and resources.
(3) AISC (US$/oz) or all-in sustaining costs per silver ounce sold in USD is shown net of by-product credits and considered to be a non-GAAP financial measure.
Source: CIBC World Markets and company public disclosure.
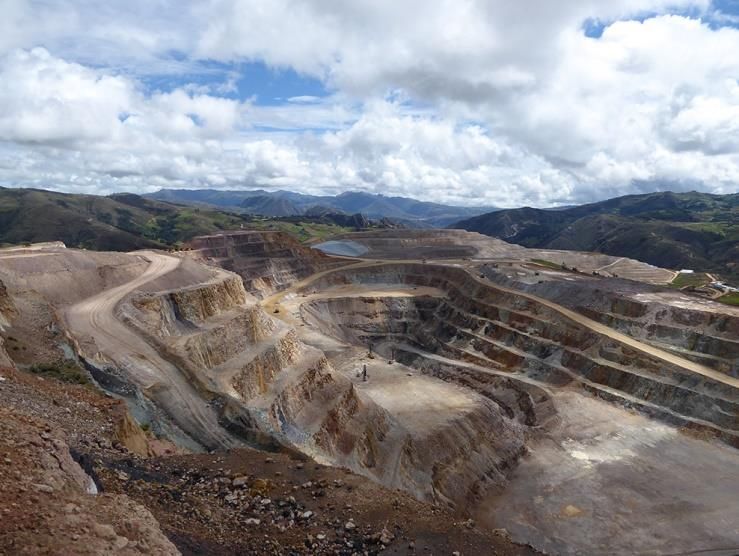
12 May 16, 2019Operational Excellence:
Peruvian Case Study
Our investment in mechanization resulted in safer, more productive and higher
margin mines. We plan on applying that same approach to operational excellence
to our newly acquired assets.
Free Cash Flow1
Over the 2013 to 2018 period: $40
• 13% increase in silver $30
production $20
Millions
• 36%, 33%, and 61% increase in
$10
zinc, lead, and copper
production $-
2013 2014 2015 2016 2017 2018
2
• ~20% decrease in unit costs -$10
• ~$45M increase in annual -$20
free cash flow1 Morococha Huaron
(1) Free Cash Flow is a non-GAAP measure and is calculated as net cash generated from operating activities less sustaining capital; see the “Non-GAAP Measures” section of our
Cautionary Note on page 2 of this presentation.
(2) Huaron mine generated Free Cash Flow in 2018, despite capital investments in tailings storage facility expansions and mine deepening projects to support multi-year production.
13 May 16, 2019Q1 2019 Highlights 14
Consolidated Q1 2019 Highlights
     • Acquisition of Tahoe completed February 22, 2019; Q1 2019 results
       reflect contribution of acquired mines from February 22, 2019 to March
       31, 2019
     • Revenue of $232.6M, up 12% from Q1 2018 on higher metal sales
       (except copper)
     • Net income of $33.8M, equivalent to $0.19 basic income per share
     • Adjusted income of $8.7M, equivalent to $0.05 basic adjusted income
       per share
     • Silver production of 6.13 Moz and Gold production of 80.5 koz, on track
       to achieve annual guidance
     • Quarterly cash dividend of $0.035 per common share approved

15                                  May 16, 2019
Q1 2019 Consolidated Cash Flows
(2)
(1)
(1) Excludes amounts included in Mine care & maintenance.
(2) Excludes amounts included in Transaction & integration costs.
16 May 16, 2019Liquidity and Capital Position
US$ Millions March 31, 2019
Cash and Short-term investments 121.6
Total available liquidity(1) 286.6
Working Capital(2) 771.7
Amount drawn on Revolving Credit Facility 335.0
Total debt(3) 363.1
(1) Total available liquidity is a non-GAAP measure, and includes cash and cash equivalents, short-term investments, and the undrawn portion of the Company’s secured line of credit.
(2) Working capital is a non-GAAP measure calculated as current assets less current liabilities. The Company and certain investors use this information to evaluate whether the Company is
able to meet its current obligations using its current assets.
(3) Total debt is a non-GAAP measure calculated as the total of amounts drawn on the Revolving Credit Facility, finance lease liabilities and loans payable.
See the “Non-GAAP Measures” section of our Cautionary Note on page 2 of this presentation.
17 May 16, 20192019 Guidance
Reflects full year for the Silver Segment mines and from February 22, 2019 to December 31, 2019 for the Gold
Segment mines.
Gold Production AISC
Silver Production Cash Costs
(thousand
(million ounces) ($ per ounce)(1) ($ per ounce)(1)
ounces)
Silver Segment:
La Colorada 8.0 - 8.2 4.1 - 4.8 2.50 - 3.50 3.50 - 4.50
Dolores 5.2 - 5.5 114.5 - 120.0 4.50 - 5.50 14.00 - 16.00
Huaron 3.6 - 3.7 0.5 6.00 - 7.00 7.50 - 9.25
Morococha (92.3%)(2) 2.8 - 2.9 1.2 - 1.5 3.10 - 4.00 7.00 - 9.00
San Vicente (95.0%)(3) 3.5 - 3.7 0.3 10.60 - 11.50 12.25 - 13.50
Manantial Espejo/COSE/Joaquin 3.4 - 3.6 42.0 - 45.0 17.00 - 18.50 17.75 - 19.50
Total(4) 26.5 - 27.5 162.5 - 172.5 6.50 - 7.50 9.75 - 11.25
Gold Segment:
Shahuindo 0.1 135.0 - 165.0 550 - 625 875 - 1,000
La Arena — 117.5 - 122.5 800 - 850 1,275 - 1,325
Timmins(5) — 155.0 - 160.0 890 - 940 1,025 - 1,075
Total(4) 0.1 407.5 - 447.5 740 - 810 1,025 - 1,125
Total Production(6) 26.6 - 27.6 570.0 - 620.0 — —
Consolidated Silver Basis — — (2.25) - 0.50 7.75 - 10.75
(1) Cash Costs and AISC are non-GAAP measures. Please refer to the section “Alternative Performance (Non-GAAP) Measures” of the MD&A for the period ended March 31, 2019, for a detailed description of these measures and where appropriate a reconciliation of the measure to the Q1 2019
Financial Statements. The Cash Costs and AISC forecasts assume metal prices of $14.50/oz for silver, $2,600/tonne ($1.18/lb) for zinc, $1,950/tonne ($0.88/lb) for lead, $6,150/tonne ($2.79/lb) for copper, and $1,250/oz for gold; and average annual exchange rates relative to 1 USD of 19.50 for the
Mexican peso ("MXN"), 3.33 of the Peruvian sol ("PEN"), 41.80 for the Argentine peso ("ARS"), 6.91 for the Bolivian boliviano ("BOL"), and $1.30 for the Canadian dollar ("CAD").
(2) Morococha data represents Pan American’s 92.3% interest in the mine's production.
(3) San Vicente data represents Pan American’s 95.0% interest in the mine's production.
(4) As shown in the detailed quantification of consolidated AISC, included in the “Alternative Performance (Non-GAAP) Measures” section of the MD&A for the period ended March 31, 2019, expenses for corporate general and administrative, exploration and project development are included in
Consolidated (silver basis) AISC, though are not allocated amongst the operations and thus are not included in either the silver or gold segment totals.
(5) Timmins mines are classified as assets held for sale in the Company's Q1 2019 Financial Statements, as described in the Note 4 of the Company's Q1 2019 Financial Statements, and in the "Acquisition of Tahoe" section of the MD&A for the period ended March 31, 2019. The gold production from
the Timmins operations is included in the consolidated guidance, pending resolution from the sale process.
(6) Totals may not add due to rounding.
18 May 16, 2019Strategic Priorities
Integration & • Integrate Tahoe operations and capture synergies
Synergies
• Divest non-core assets
Balance Sheet • Reduce debt incurred through Tahoe acquisition
• Focus on cost control to optimize operating margins – targeting all-in
sustaining costs of $7.75 - $10.75 per ounce in 2019(1)
Operations • Ramp-up Dolores underground mine to 1,500 tpd
• Begin producing from Joaquin and COSE mines
• La Colorada exploration discovery – targeting initial resource estimate in Q4 2019
• Potential development of the Navidad project
Value Drivers • Potential restart of operations at Escobal – focus on supporting the ILO 169
Consultation Process led by Guatemalan Ministry of Energy & Mines and implementing
Pan American’s approach to community engagement and business practices
Vision: The Premier Silver Mining Company
(1) AISC on a consolidated silver basis and calculated by treating all revenues from metals other than silver, including gold, as a by-product credit.
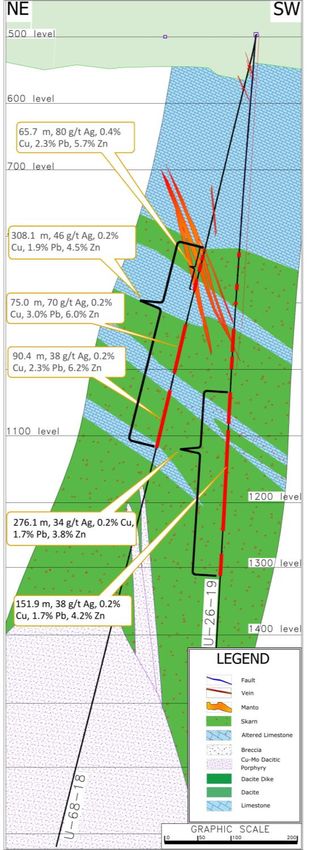
19 May 16, 2019La Colorada Skarn
Discovery Section
Recent drill highlights include:
• U-86-18: 24.5 m at 37 g/t Ag, 0.28% Cu, 1.95% Pb, 4.27% Zn;
• and 8.7 m at 25 g/t Ag, 0.08% Cu, 3.41% Pb, 4.97% Zn
• U-08-19: 61.1 m at 80 g/t Ag, 0.23% Cu, 0.41% Pb, 3.27% Zn
• U-12-19: 22.1 m at 131 g/t Ag, 0.43% Cu, 0.59% Pb, 3.24% Zn
• U-22-19: 129.2 m at 45 g/t Ag, 0.10% Cu, 1.09% Pb, 4.02% Zn;
• including 84.5 m at 63 g/t Ag, 0.13% Cu, 1.27% Pb, 5.18% Zn
• U-26-19: 276.1 m at 34 g/t Ag, 0.18% Cu, 1.69% Pb, 3.76% Zn;
• including 47 m at 31 g/t Ag, 0.17% Cu, 2.49% Pb, 4.40% Zn;
• including 151.9 m at 38 g/t Ag, 0.20% Cu, 1.73% Pb, 4.22% Zn;
• including 33.2 m @ 53 g/t Ag, 0.26% Cu, 2.32% Pb, 5.23% Zn
Please see Technical Information cautionary note provided in our news
release for Q1 2019 dated May 8, 2019
20 May 16, 2019A Sustainable Business:
History of Replacing Reserves
Over the last 13 years, PAAS added 351 million ounces of contained silver to mineral reserves
through mine-site exploration, replacing 356 million ounces produced in the same period. Our
reserve replacement cost in 2018 was $0.51 per ounce (2).
600 567
Cumulative Contained Silver Production Contained Silver Reserves
400
Million Oz
317 324
300
280 286 288
228 232 231 235
213 224
200
0
2006 2007 2008 2009 2010 2011 2012 2013 2014 2015 2016 2017 2018 1
(1) 2018 Silver reserves are inclusive of reserves from Tahoe Resources published on January 1, 2018.
(2) Non-GAAP measure; calculated as total drilling cost divided by ounces found/replaced in reserves.
21 May 16, 2019Other Portfolio Assets
• Pan American owns ~26% (~29% fully diluted) of Maverix Metals Inc. (“MMX”),
a precious metals royalty and streaming company, representing a market value
of ~CAD$143 M1.
• ~12% interest (~16% fully diluted) in New Pacific Metals Corp. providing
exposure to the Silver Sand property in Bolivia.
• See New Pacific disclosure for 2018 drill program results
• Free carried interest of 25% to commercial production in the Shalipayco
project, a zinc development project located in Peru owned by Nexa Resources.
(1) Based on MMX closing price as at March 26, 2019 of $2.60/share on the TSX Venture Exchange and Pan American’s ownership of ~26% of Maverix.
22 May 16, 2019Pan American a Leader in Responsible Mining
Culture of Social Responsibility and Environmental Performance Track Record of Success in Latin America
Transparent Sustainability Reporting 25 years of building trust with local communities
• Based on annual consultation process with all and indigenous groups across Latin America
stakeholder groups
• Report on our efforts towards the UN’s
Sustainable Development Goals
Successfully permitted 2 new mines and 5
major mine expansions in the past 13 years
• Report on environmental and social audits
Generating Local Benefits
Member of the Mining +78 local supply companies started with our support
Association of Canada’s Towards +11 alternative economic (non-mining) development programs
Sustainable Mining Program
Awarded “Business of the Year”
in 2016 for our sustainable
development work in Peru
Zero material environmental or
social incidents in Company history Robert R. Hedley Award for Excellence in Social
and Environmental Responsibility (AME, 2018)
Social responsibility is an important pillar of Pan American’s governing philosophy
23 May 16, 2019Appendix
PAAS Company Snapshot
  Ticker TSX/NASDAQ                                              PAAS

  Shares Outstanding                                             209.4 million

  CVRs                                                           15.6 million

  Market Cap1                                                    $2.3 billion

  Avg. Daily Volume (3 month)1                                   2.6 million

  Dividend Yield2                                                1.3%

  Total debt3                                                    $363.1 million

  Total available liquidity4                                     $286.6 million

(1) All data based on NASDAQ exchange; as of market close May 15, 2019.
(2) Based on closing share price on May 15, 2019 and dividend declared May 8, 2019, annualized.
(3) Total debt is a non-GAAP measure that includes all financial liabilities; total debt at March 31, 2019.
(4) Total available liquidity is a non-GAAP measure, and includes cash and cash equivalents, short-term
investments, and the undrawn portion of the Company’s secured line of credit.
See the “Non-GAAP Measures” section of our Cautionary Note on page 2 of this presentation.

 25                                                                    May 16, 2019
Escobal: One of The World’s Best Silver Mines
World Class Silver Mine
High quality, well built operation with over US$500 million invested1
One of the world’s largest primary silver deposits with reserves of 264Moz
One of the world’s largest primary silver operations with three consecutive
years of production above 20 Moz Ag per year prior to 2017
AISC consistently below US$10/oz Ag
Pan American management will bring its Latin American experience
towards concluding the consultation process and building social license
Historical Production (Moz Ag) Reserves & Resources2 (as at January 1, 2018)
Grade Contained Metal
Tonnes Ag Au Pb Zn Ag Au Pb Zn
(Mt) (g/t) (g/t) (%) (%) (Moz) (koz) (kt) (kt)
P&P Reserves 24.7 334 0.35 0.8% 1.3% 264 278 196 320
M&I Resources 16.4 209 0.21 0.4% 0.7% 110 110 61 107
Inferred Resources 1.9 180 0.90 0.2% 0.4% 11 54 4 8
(1) Based on development, expansion, and sustaining capital invested from 2011 to 2017. (2) Mineral resources are inclusive of mineral reserves. See presentation
26 slides 38-44 of the appendix for more detailed information on the Pan American’s and Tahoe’s reserves and resourcesEscobal Mining License:
ILO 169 Consultation Process
Supreme Court
Review Pre-Consultation Consultation
Verification
• Minera San Rafael (“MSR”) • Moderated by the • Moderated by MEM • MEM to submit results of the
to work with 2011 Guatemalan Ministry of • Formal dialogue process consultation process to the
Environmental Impact Study Energy and Mines (“MEM”) between Xinka indigenous Guatemalan Supreme Court
(“EIS”) consultant and and includes MSR, various communities and MSR (“SC”) and SC certifies with
experts at two Guatemalan government agencies and all three parties (MSR, MEM,
Universities to review, define ministries, academic Xinka) that the ILO 169
and recommend Area of institutions and community consultation has been
Influence to Ministry of leaders followed properly
Environment (“MARN”) • Define and agree to the • SC verification is subject to
• MARN to approve the area terms, timeline and limited appeals process by
of influence mechanisms under which parties included in the
the consultation will take original injunction
place
27 May 16, 2019La Colorada
Pan American’s Largest Silver Producing Mine with Significant Growth Potential
• La Colorada is an underground mine located in Zacatecas,
Mexico
• 100% owned and operated by Pan American
• Epithermal silver deposit, with transition at depth to a base
metal predominant system
• Currently producing silver-gold doré bars from a conventional La Colorada
cyanide leach plant for the oxide ore, and silver-rich lead
and zinc concentrates from a flotation plant treating
sulphide ore
• Successful exploration drilling at La Colorada has discovered
wide zones of mineralization below current production levels
• Potential to substantially expand mineral resources, mine life Mexico
and ultimately production capacity
Production1 (Moz Ag) Reserves & Resources2 (as at December 31 , 2018)
Grade Contained Metal
Tonnes Ag Au Pb Zn Ag Au Pb Zn
(Mt) (g/t) (g/t) (%) (%) (Moz) (koz) (kt) (kt)
P&P Reserves 8.6 366 0.29 1.44 2.52 101.0 79 123 216
M&I Resources 2.6 164 0.16 0.55 1.08 13.6 14 14 28
Inferred Resources 6.2 185 0.20 2.08 4.09 37.1 41 129 254
(1) Guidance at May 8, 2019; please refer to the Company’s news release dated May 8, 2019 for more information.
(2) See presentation slides 38-44 of the Appendix for more detailed information on the Pan American’s and Tahoe’s reserves and resources.
28 May 16, 2019Dolores
Large Silver/Gold Mine
• The Dolores mine is 100% owned and operated by
Pan American
• Low sulphidation epithermal deposit with strong
structural control. Silver and gold mineralization is
hosted in hydrothermal breccias and sheeted vein
zones Dolores
• Mining at Dolores is by open pit and underground
methods. The mine uses conventional cyanide heap
leaching to produce gold and silver doré
• Expansion completed in 2017 featuring a pulp
agglomeration plant to process high-grade ore from
a new underground mine, together with the high-
grade portion of the ore from the open-pit mine Mexico
• Average throughput capacity of 20,000 tpd
Production1 (Moz Ag) Reserves & Resources2 (as at December 31, 2018)
Grade Contained Metal
Tonnes Ag Au Ag Au
(Mt) (g/t) (g/t) (Moz) (koz)
P&P Reserves 44.5 27 0.85 39.0 1211
M&I Resources 6.1 22 0.33 4.2 64
Inferred Resources 4.3 45 1.15 6.2 158
(1) Guidance at May 8, 2019; please refer to the Company’s news release dated May 8, 2019 for more information.
(2) See presentation slides 38-44 of the Appendix for more detailed information on the Pan American’s and Tahoe’s reserves and resources.
29 May 16, 2019Huaron
Polymetallic Silver Mine
• The Huaron underground mine is 100% owned and
operated by Pan American
• Huaron is a hydrothermal polymetallic deposit of silver,
lead, zinc, and copper occurring in veins, mantos and
disseminated volcanic intrusions
Peru
• The mine operates at 2,500 tpd using flotation
technology to produce silver in copper, lead, and zinc
concentrates
• Mechanization of mining methods at Huaron has
improved efficiency and reduced operating costs Huaron
• Upgrades to the flotation circuit have resulted in
improved mill recoveries
Production1 (Moz Ag) Reserves & Resources2 (as at December 31, 2018)
Grade Contained Metal
Tonnes Ag Cu Pb Zn Ag Cu Pb Zn
(Mt) (g/t) (%) (%) (%) (Moz) (kt) (kt) (kt)
P&P Reserves 10.4 159 0.5 1.41 2.84 53.1 52 147 295
M&I Resources 3.8 153 0.24 1.52 2.84 18.7 9 58 108
Inferred Resources 6.2 157 0.37 1.5 2.75 31.0 23 93 169
(1) Guidance at May 8, 2019; please refer to the Company’s news release dated May 8, 2019 for more information.
(2) See presentation slides 38-44 of the Appendix for more detailed information on the Pan American’s and Tahoe’s reserves and resources.
30 May 16, 2019Morococha
Polymetallic Mine
• The Morococha underground mine is 92.3% owned
and operated by Pan American
• Polymetallic mineralization comprising silver, lead,
zinc, and copper
• Mineralization includes epithermal veins, bedded
silver-base metal replacements or mantos and Peru
intrusive-sediment contact skarns.
• Morococha operates at 2,000 tpd using standard
flotation technology to produce silver in zinc, lead,
and copper concentrates
• Mechanization of mining methods at Morococha has Morococha
improved efficiency and reduced operating costs
• Current activities focus on opportunities to enhance
productivities and efficiencies while designing for the
eventual mill relocation
Production1 (Moz Ag) Reserves & Resources2 (as at December 31, 2018)
Grade Contained Metal
Tonnes Ag Cu Pb Zn Ag Cu Pb Zn
(Mt) (g/t) (%) (%) (%) (Moz) (kt) (kt) (kt)
P&P Reserves 6.8 155 0.38 1.31 3.78 34.1 26 90 258
M&I Resources 0.8 149 0.24 0.94 2.64 3.7 2 7 21
Inferred Resources 4.7 140 0.38 1.08 4.3 21.4 18 51 204
(1) Guidance at May 8, 2019; please refer to the Company’s news release dated May 8, 2019 for more information.
(2) See presentation slides 38-44 of the Appendix for more detailed information on the Pan American’s and Tahoe’s reserves and resources.
31 May 16, 2019San Vicente
Polymetallic Silver-Zinc Mine
• The San Vicente underground mine is 95% owned
and operated by Pan American
• Hydrothermal polymetallic deposit consisting of
replacement veins in pre-existing faults,
replacements in conglomerates, and mineralization
in dacitic dykes
• The San Vicente plant has an average throughput of
950 tpd and utilizes a standard flotation process to
produce silver-zinc and silver-lead concentrates
• Lower production costs resulting from productivity
enhancements associated with mechanization San Vicente
efforts, enhanced mine dilution controls and
improvements in site infrastructure
Production1 (Moz Ag) Reserves & Resources2 (as at December 31, 2018)
Grade Contained Metal
Tonnes Ag Cu Pb Zn Ag Cu Pb Zn
(Mt) (g/t) (%) (%) (%) (Moz) (kt) (kt) (kt)
P&P Reserves 2.2 392 0.42 0.35 2.97 28.1 9 8 66
M&I Resources 1.0 153 0.21 0.18 2.14 4.9 2 2 21
Inferred Resources 2.5 322 0.27 0.33 3.44 26.3 7 8 87
(1) Guidance at May 8, 2019; please refer to the Company’s news release dated May 8, 2019 for more information.
(2) See presentation slides 38-44 of the Appendix for more detailed information on the Pan American’s and Tahoe’s reserves and resources.
32 May 16, 2019Manantial Espejo
Providing Support to the Development of the Joaquin and COSE Projects
• The Manantial Espejo underground mine is 100% owned and
operated by Pan American
• Low sulphidation, silver-gold epithermal deposit
• Ore is treated by gravity concentration, agitation leaching and
Merril Crowe processing to produce silver-gold doré
• Underground mining at the nearby COSE and Joaquin
properties will generate further value from the Manantial
Espejo plant
• Combined production from the Joaquin, COSE and Manantial
Espejo mines is expected to add 21 million silver ounces over
the 2018 to 2021 period1
Manantial Espejo
• Extending the life of the Manantial Espejo plant allows
continued exploration activities and potential to add other
high grade deposits
Production2 (Moz Ag) Proven & Probable Reserves3 (as at December 31, 2018)
Grade Contained Metal
Tonnes Ag Au Ag Au
(Mt) (g/t) (g/t) (Moz) (koz)
Manantial
1.3 161 1.51 6.7 63
Espejo
Joaquin 0.5 721 0.41 11.0 6
COSE 0.1 918 17.70 2.2 43
(1) See new release dated Dec. 21, 2017
(2) Guidance at May 8, 2019; please refer to the Company’s news release dated May 8, 2019 for more information.
33 (3)
May 16, 2019
See presentation slides 38-44 of the Appendix for more detailed information on the Pan American’s and Tahoe’s reserves and resources.Shahuindo
Sizeable Gold Mine with Significant Growth Potential
• 100% owned open pit gold mine located in northern Peru
producing silver by-products from doré
• Heap leach processing
• Commercial production began in 2016 with current
estimated mine life until 2028
• Significant exploration opportunity and ability to extend
mine life
• Full ramp-up of recent expansion to 36 ktpd expected to be
achieved during the first half of 2019 Shahuindo
Production1 (koz Au) Reserves & Resources2 (as at January 1, 2018)
Grade Contained Metal
Tonnes Au Ag Au Ag
(Mt) (g/t) (g/t) (Moz) (koz)
135 - 165
P&P Reserves 127.8 0.46 5.6 1907 23.1
79 90 M&I Resources 28.9 0.40 5.2 371 4.8
Inferred Resources 110.8 0.70 13.2 2500 47.0
2017A 2018A 2019 Guidance3
(1) Guidance at May 8, 2019; please refer to the Company’s news release dated May 8, 2019 for more information.
(2) Mineral resources are inclusive of mineral reserves. See presentation slides 38-44 of the Appendix for more detailed information on the Pan American’s and Tahoe’s reserves and resources.
(3) Shaded region represents 30.7koz of gold production in 2019 prior to Pan American Silver ownership as of February 22, 2019.
34 May 16, 2019La Arena
Producing Gold Mine with Sulphide Expansion Potential
• 100% owned open pit gold mine located in Peru producing
doré
• Run-of-mine heap leach currently processing 36 ktpd
• Commercial production began in 2011 with estimated mine
life until 2021
• PEA released in February 2018 on sulphide expansion (“La
Arena II”)
• Highlights from the PEA include:
− 21 year mine life
− Average annual production of 149 koz gold and 94 kt of
copper
− US$824M after-tax NPV8% La Arena
− Mineral resources that are not mineral reserves do not have
demonstrated economic viability. This PEA is preliminary in
nature and includes inferred mineral resources that are
considered too speculative geologically to be categorized as
mineral reserves and there is no certainty that the PEA will be
realized.
Reserves & Resources2 (as at January 1, 2018)
Production1 (koz Au)
La Arena Tonnes Au Au
(Mt) (g/t) (koz)
P&P Reserves 44.0 0.40 568
M&I Resources 5.9 0.40 75
Inferred Resources 0.4 0.31 4
196 117.5 -
162 122.5 La Arena II Tonnes Au Cu Au Cu
(Mt) (g/t) (%) (koz) (kt)
M&I Resources 742.4 0.24 0.4% 5,637 2,626
3
2017A 2018A 2019 Guidance Inferred Resources 91.6 0.23 0.2% 683 158
(1) Guidance at May 8, 2019; please refer to the Company’s news release dated May 8, 2019 for more information.
35 (2) Mineral resources are inclusive of mineral reserves. See presentation slides 38-44 of the Appendix for more detailed information on the Pan American’s
and Tahoe’s reserves and resources.
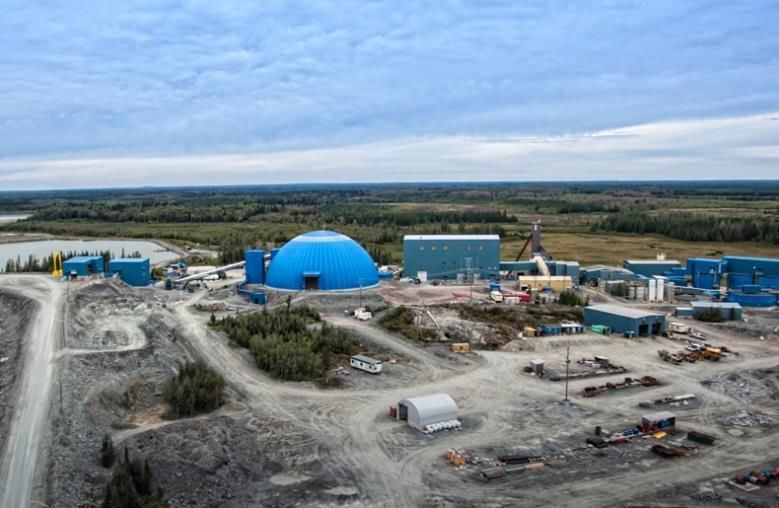
(3) Shaded region represents 32.8koz of gold production in 2019 prior to Pan American Silver ownership as of February 22, 2019.Timmins Mines
Two Producing Mines in Prolific Canadian Mining Camp
• The Timmins mines are comprised of the 100% owned
Timmins West and Bell Creek mines, both located near
Timmins, Ontario
• Underground gold operation with an estimated mine
reserve life until 2024, producing doré
• Leach / CIL-CIP / EW processing at Bell Creek, which has
capacity of 4 ktpd
• Shaft upgrade to 1,080 metres depth in commission,
which will greatly reduce bottlenecks at Bell Creek Bell Creek
Timmins West
• Significant land position in the Timmins Camp with
potential for exploration upside
• The Timmins Mines are located near several other high
quality gold operations including Goldcorp’s Porcupine
mine and Detour’s Lake mine
Production1 (koz Au) Reserves & Resources2 (as at January 1, 2018)
Tonnes Au Au
(Mt) (g/t) (koz)
P&P Reserves 8.9 3.39 969
155 - 160
167 152 M&I Resources 3.8 5.65 690
Inferred Resources 4.1 4.17 548
3
2017A 2018A 2019 Guidance
(1) Guidance at May 8, 2019; please refer to the Company’s news release dated May 8, 2019 for more information.
(2) Mineral resources are inclusive of mineral reserves. See presentation slides 38-44 of the Appendix for more detailed information on the Pan American’s and Tahoe’s reserves and resources.
(3) Shaded region represents 37.3koz of gold production in 2019 prior to Pan American Silver ownership as of February 22, 2019.
36 May 16, 2019Navidad
One of The World’s Largest Undeveloped Primary Silver Deposits
• 100% owned silver mine located in Chubut Province in Argentina
• Pan American gained control of the project in 2010 through the
acquisition of Aquiline Resources
• The project currently comprises eight individual mineral deposits in
three separate mineralized trends (Navidad, Esperanza and Argenta
trends)
− The six deposits of the Navidad Trend occur along strike over a
distance of about 5.8 kilometres and are essentially continuous
Navidad
Resources1 (as at December 31, 2018)
Grade Contained Metal
Tonnes Ag Cu Pb Ag Cu Pb
(Mt) (g/t) (%) (%) (Moz) (kt) (kt)
M&I Resources 155.2 127 0.06 0.86 632.4 71 1326
Inferred
45.9 81 0.02 0.57 119.4 9 262
Resources
(1) See presentation slides 38-44 of the Appendix for more detailed information on the Pan American’s and Tahoe’s reserves and resources
37 May 16, 2019All Pan American Silver Proven and Probable Reserves1,2
Property Location Category Tonnes (Mt) Ag g/t Au g/t Zn% Pb% Cu%
Huaron Peru Proven 6.3 156 2.84 1.36 0.55
Probable 4.1 163 2.84 1.49 0.42
Morococha (92.3%)3 Peru Proven 3.7 160 4.17 1.36 0.44
Probable 3.1 150 3.32 1.26 0.32
La Colorada Mexico Proven 4.3 387 0.31 2.92 1.66
Probable 4.3 346 0.27 2.13 1.21
Dolores Mexico Proven 35.8 27 0.86
Probable 8.7 27 0.79
La Bolsa Mexico Proven 9.5 10 0.67
Probable 6.2 7 0.57
Manantial Espejo Argentina Proven 1.2 156 1.26
Probable 0.1 204 3.64
San Vicente (95%)3 Bolivia Proven 1.5 396 3.00 0.34 0.43
Probable 0.7 383 2.90 0.37 0.40
Joaquin Argentina Probable 0.5 721 0.41
COSE Argentina Probable 0.1 918 17.7
Total4 Proven + Probable 90.0 97 0.76 2.98 1.31 0.45
Notes:
(1) Prices used to estimate mineral reserves for 2018 were $18.50 per ounce of silver, $1,300 per ounce of gold, $2,400 per tonne of zinc, $2,100 per tonne of lead, and $6,000 per
tonne of copper, except at Manantial Espejo where $16.50 per ounce of silver and $1,250 per ounce of gold were used. Metal prices used for La Bolsa were $14.00 per ounce of
silver and $825 per ounce of gold.
(2) Mineral reserve estimates were prepared under the supervision of, or were reviewed by, Christopher Emerson, FAusIMM, Vice President Business Development and Geology and
Martin G. Wafforn, P.Eng., Senior Vice President Technical Services and Process Optimization, each of whom are Qualified Persons as that term is defined in National Instrument
43-101 (“NI 43-101).
(3) This information represents the portion of mineral reserves attributable to Pan American based on its ownership interest in the operating entity as indicated.
(4) Totals may not add up due to rounding.
Pan American Silver Corp. Mineral Reserve and Resource Information as at December 31, 2018All Pan American Silver Measured and Indicated Resources1,2
Property Location Category Tonnes (Mt) Ag g/t Au g/t Zn% Pb% Cu%
Huaron Peru Measured 2.1 155 2.91 1.56 0.19
Indicated 1.7 151 2.76 1.47 0.30
Morococha (92.3%) 3 Peru Measured 0.3 145 2.15 0.87 0.21
Indicated 0.5 151 2.93 0.98 0.26
La Colorada Mexico Measured 0.6 193 0.22 1.00 0.60
Indicated 2.0 156 0.15 1.11 0.54
Dolores Mexico Measured 4.5 20 0.25
Indicated 1.6 27 0.53
La Bolsa Mexico Measured 1.4 11 0.90
Indicated 4.5 9 0.50
Manantial Espejo Argentina Measured 0.1 169 1.66
Indicated 0.2 241 2.86
San Vicente (95%) 3 Bolivia Measured 0.8 154 2.23 0.17 0.21
Indicated 0.2 148 1.73 0.22 0.22
Navidad Argentina Measured 15.4 137 1.44 0.10
Indicated 139.8 126 0.79 0.04
Pico Machay Peru Measured 4.7 0.91
Indicated 5.9 0.67
Joaquin Argentina Indicated 0.1 385 0.58
Measured +
Total4 186.3 121 0.58 2.18 0.86 0.05
Indicated
Notes:
(1) Prices used to estimate mineral resources for 2018 were $18.50 per ounce of silver, $1,300 per ounce of gold, $2,400 per tonne of zinc, $2,100 per tonne of lead, and $6,000
per tonne of copper, except at Dolores and Manantial Espejo, where $24.00 per ounce of silver and $1,400 per ounce of gold were used. Metal prices used for Joaquin were
$25.00 per ounce of silver and $1,400 per ounce of gold. Metal prices used for La Bolsa were $14.00 per ounce of silver and $825 per ounce of gold. Metal prices for Navidad
were $12.52 per ounce of silver and $1,100 per tonne of lead.
(2) Mineral resource estimates were prepared under the supervision of, or were reviewed by, Christopher Emerson, FAusIMM, Vice President Business Development and
Geology and Martin G. Wafforn, P.Eng., Senior Vice President Technical Services and Process Optimization, each of whom are Qualified Persons as that term is defined in
National Instrument 43-101 (“NI 43-101).
(3) This information represents the portion of mineral resources attributable to Pan American based on its ownership interest in the operating entity as indicated.
(4) Totals may not add up due to rounding.
Pan American Silver Corp. Mineral Reserve and Resource Information as at December 31, 2018All Pan American Silver Inferred Resources1,2
Property Location Category Tonnes (Mt) Ag g/t Au g/t Zn% Pb% Cu%
Huaron Peru Inferred 6.2 157 2.75 1.50 0.37
Morococha (92.3%) 3 Peru Inferred 4.7 140 4.30 1.08 0.38
La Colorada Mexico Inferred 6.2 185 0.20 4.09 2.08
Dolores Mexico Inferred 4.3 45 1.15
La Bolsa Mexico Inferred 13.7 8 0.51
Manantial Espejo Argentina Inferred 0.5 194 2.71
San Vicente (95%) 3 Bolivia Inferred 2.5 322 3.44 0.33 0.27
Navidad Argentina Inferred 45.9 81 0.57 0.02
Pico Machay Peru Inferred 23.9 0.58
Joaquin Argentina Inferred 0.01 389 1.29
COSE Argentina Inferred 0.03 382 7.10
Total4 Inferred 108.0 92 0.59 3.64 0.83 0.10
Notes:
(1) Prices used to estimate mineral resources for 2018 were $18.50 per ounce of silver, $1,300 per ounce of gold, $2,100 per tonne of lead, $2,400 per tonne of zinc,
and $6,000 per tonne of copper, except at Dolores and Manantial Espejo, where $24.00 per ounce of silver and $1,400 per ounce of gold were used. Metal prices
used for Joaquin were $25.00 per ounce of silver and $1,400 per ounce of gold. Metal prices used for La Bolsa were $14.00 per ounce of silver and $825 per ounce
of gold. Metal prices for Navidad were $12.52 per ounce of silver and $1,100 per tonne of lead.
(2) Mineral resource estimates were prepared under the supervision of, or were reviewed by, Christopher Emerson, FAusIMM, Vice President Business Development
and Geology and Martin G. Wafforn, P.Eng., Senior Vice President Technical Services and Process Optimization, each of whom are Qualified Persons as that term is
defined in National Instrument 43-101 (“NI 43-101).
(3) This information represents the portion of mineral resources attributable to Pan American based on its ownership interest in the operating entity as indicated.
(4) Totals may not add up due to rounding.
Pan American Silver Corp. Mineral Reserve and Resource Information as at December 31, 2018Tahoe Resources Mineral Reserves as of January 1, 2018
Proven Probable Proven & Probable
Gold Location Ownership Tonnes Grade Metal Tonnes Grade Metal Tonnes Grade Metal
(M) (g/t) (koz) (M) (g/t) (koz) (M) (g/t) (koz)
Bell Creek Canada 100% 0.5 3.90 68 1.9 4.12 246 2.4 4.07 315
Escobal Guatemala 100% 2.5 0.42 34 22.1 0.34 244 24.7 0.35 278
La Arena Peru 100% 0.3 0.38 3 43.7 0.40 565 44.0 0.40 568
Shahuindo Peru 100% 77.9 0.48 1,203 49.9 0.44 704 127.8 0.46 1,907
Timmins West Canada 100% 0.4 3.61 47 6.1 3.11 606 6.5 3.15 654
Total Gold Mineral Reserves 81.6 0.52 1,356 123.7 0.59 2,366 205.3 0.56 3,721
Proven Probable Proven & Probable
Silver Location Ownership Tonnes Grade Metal Tonnes Grade Metal Tonnes Grade Metal
(M) (g/t) (koz) (M) (g/t) (koz) (M) (g/t) (koz)
Escobal Guatemala 100% 2.5 486 39,532 22.1 316 224,961 24.7 334 264,493
Shahuindo Peru 100% 77.9 6 14,756 49.9 5 8,384 127.8 6 23,140
Total Silver Mineral Reserves 80.4 21 54,288 72.1 101 233,345 152.5 59 287,633
Proven Probable Proven & Probable
Lead Location Ownership Tonnes Grade Metal Tonnes Grade Metal Tonnes Grade Metal
(M) (%) (ktonnes) (M) (%) (ktonnes) (M) (%) (ktonnes)
Escobal Guatemala 100% 2.5 1.02 26 22.1 0.77 170 24.7 0.79 196
Total Lead Mineral Reserves 2.5 1.02 26 22.1 0.77 170 24.7 0.79 196
Proven Probable Proven & Probable
Zinc Location Ownership Tonnes Grade Metal Tonnes Grade Metal Tonnes Grade Metal
(M) (%) (ktonnes) (M) (%) (ktonnes) (M) (%) (ktonnes)
Escobal Guatemala 100% 2.5 1.75 44 22.1 1.25 276 24.7 1.30 320
Total Lead Mineral Reserves 2.5 1.75 44 22.1 1.25 276 24.7 1.30 320
41 May 16, 2019Tahoe Resources Mineral Resources as of January 1, 2018
Measured Indicated Measured & Indicated Inferred
Gold Location Ownership Tonnes Grade Metal Tonnes Grade Metal Tonnes Grade Metal Tonnes Grade Metal
(M) (g/t) (koz) (M) (g/t) (koz) (M) (g/t) (koz) (M) (g/t) (koz)
Bell Creek Canada 100% 1.2 4.43 167 4.1 4.27 569 5.3 4.31 736 3.0 4.36 415
Escobal Guatemala 100% 4.8 0.33 51 36.3 0.29 337 41.1 0.29 388 1.9 0.90 54
La Arena Peru 100% 0.3 0.38 3 49.6 0.40 640 49.9 0.40 643 0.4 0.32 4
Shahuindo Peru 100% 89.1 0.47 1,358 67.6 0.42 921 156.7 0.45 2,278 110.8 0.70 2,500
Timmins West Canada 100% 0.2 4.86 39 7.1 3.87 885 7.4 3.90 923 1.1 3.80 133
La Arena II Peru 100% 155.7 0.25 1,265 586.7 0.23 4,372 742.4 0.24 5,637 91.6 0.23 683
Fenn-Gib Canada 100% - - - 40.8 0.99 1,300 40.8 0.99 1,300 24.5 0.95 750
Whitney Canada 79% 1.0 7.02 218 2.3 6.77 491 3.2 6.85 709 1.0 5.34 171
Gold River Canada 100% - - - 0.7 5.29 117 0.7 5.29 117 5.3 6.06 1,028
Juby Canada 100% - - - 26.6 1.28 1,090 26.6 1.28 1,090 96.2 0.94 2,909
Marlhill Canada 100% - - - 0.4 4.52 57 0.4 4.52 57 - - -
Vogel Canada 100% - - - 2.2 1.75 125 2.2 1.75 125 1.5 3.60 169
Total Gold Mineral Resources 252.2 0.38 3,101 824.4 0.41 10,904 1,076.6 0.40 14,005 337.2 0.81 8,816
Measured Indicated Measured & Indicated Inferred
Silver Location Ownership Tonnes Grade Metal Tonnes Grade Metal Tonnes Grade Metal Tonnes Grade Metal
(M) (g/t) (koz) (M) (g/t) (koz) (M) (g/t) (koz) (M) (g/t) (koz)
Escobal Guatemala 100% 4.8 374 58,104 36.3 271 316,520 41.1 283 374,624 1.9 180 10,746
Shahuindo Peru 100% 89.1 6 16,807 67.6 5 11,122 156.7 6 27,929 110.8 13 46,980
Total Silver Mineral Resources 93.9 25 74,911 103.9 98 327,642 197.8 63 402,552 112.7 16 57,726
Measured Indicated Measured & Indicated Inferred
Copper Location Ownership Tonnes Grade Metal Tonnes Grade Metal Tonnes Grade Metal Tonnes Grade Metal
(M) (%) (ktonnes) (M) (%) (ktonnes) (M) (%) (ktonnes) (M) (%) (ktonnes)
La Arena II Peru 100% 155.7 0.37 580 586.7 0.35 2,046 742.4 0.35 2,626 91.6 0.17 158
Total Copper Mineral Resources 155.7 0.37 580 586.7 0.35 2,046 742.4 0.35 2,626 91.6 0.17 158
Measured Indicated Measured & Indicated Inferred
Lead Location Ownership Tonnes Grade Metal Tonnes Grade Metal Tonnes Grade Metal Tonnes Grade Metal
(M) (%) (ktonnes) (M) (%) (ktonnes) (M) (%) (ktonnes) (M) (%) (ktonnes)
Escobal Guatemala 100% 4.8 0.68 33 36.3 0.62 224 41.1 0.62 257 1.9 0.22 4
Total Lead Mineral Resources 4.8 0.68 33 36.3 0.62 224 41.1 0.62 257 1.9 0.22 4
Measured Indicated Measured & Indicated Inferred
Zinc Location Ownership Tonnes Grade Metal Tonnes Grade Metal Tonnes Grade Metal Tonnes Grade Metal
(M) (%) (ktonnes) (M) (%) (ktonnes) (M) (%) (ktonnes) (M) (%) (ktonnes)
Escobal Guatemala 100% 4.8 1.20 58 36.3 1.02 369 41.1 1.04 427 1.9 0.42 8
Total Lead Mineral Resources 4.8 1.20 58 36.3 1.02 369 41.1 1.04 427 1.9 0.42 8
42 May 16, 2019Tahoe Resources January 1, 2018 Mineral
Reserve and Mineral Resource Notes
1. Tahoe’s mineral reserve and mineral resource estimates contained in this Appendix are as reported in Tahoe’s public disclosure, and subsequently reproduced in Pan American Silver’s
management information circular with respect to the special meeting of its shareholders held on January 8, 2019.
2. Mineral Resource estimates are classified as Measured, Indicated or Inferred based on the confidence of the input data, geological interpretation and grade estimation parameters. The Mineral
Resource estimates were prepared in accordance with NI 43-101 and classifications adopted by the CIM Council.
3. Mineral Reserve estimates are based on known inputs that include metallurgical performance, taxation/royalty obligations, geologic and geotechnical characterization, operational costs, and
other economic parameters. The Company is not currently aware of any known factors that are reasonably likely to have a negative material impact on the Company’s Mineral Reserves. The
Mineral Reserve estimates were prepared in accordance with NI 43-101 and classifications adopted by the CIM Council.
4. Mineral Resources are inclusive of Mineral Reserves.
5. Bell Creek – The basis of the Mineral Resource and Mineral Reserve estimates for the Bell Creek mine is from NI 43-101 Technical Report, Updated Mineral Reserve Estimate for Bell Creek Mine,
Hoyle Township, Timmins, Ontario, Canada, dated March 27, 2015. Mineral Resources and Mineral Reserves reported at January 1, 2018 were calculated by subtracting mining depletion
through the end of 2017 from an updated resource model completed in May 2017. The Bell Creek Mineral Resources are reported as in situ resources using a gold cut-off grade of 2.2 g/t.
Mineral Reserves were calculated by applying the life-of-mine plan at January 1, 2018 to the Measured and Indicated Mineral Resources using a long-term gold price of $1,275/oz and reported
at a gold cut-off grade of 2.3 g/t. Mineral Reserves are supported by a mine plan that features variable stope thicknesses designed on the Mineral Resource model using operating costs of
$87.42 per tonne ore with 95% mining recovery, external dilution of 16% and metallurgical recovery of 94.5%.
6. Escobal – The basis of the Mineral Resource and Mineral Reserve estimates for the Escobal mine is from Escobal Mine Guatemala NI 43-101 Feasibility Study, dated November 5, 2014. Mineral
Resources and Mineral Reserves reported at January 1, 2018 were calculated by subtracting mine depletion volumes from the Mineral Resource and Mineral Reserve estimates stated in the
aforementioned technical report. Mineral Resources are reported using a 100 g/t silver-equivalent cut-off grade calculated using metal prices of $20.00/oz, silver, $1,300.00/oz gold, $1.00/lb
lead and $1.10/lb zinc. Mineral Reserves as of January 1, 2018 were calculated by applying an updated mine plan to the Mineral Resource estimate stated in the Escobal Feasibility Study taking
into account mining depletion through the end of 2017. Cut-off grades to define the January 1, 2018 Mineral Reserves were calculated from the NSR value of the resource model blocks
contained within the life-of-mine plan minus the production cost to account for variability in mining method and metallurgical response. Metal prices used to determine the NSR value were
$20.00 per ounce silver, $1,300.00 per ounce gold, $1.00 per pound lead and $1.10 per pound zinc. Actual mining, processing and general and administrative (G&A) costs, metallurgical
performance and smelter contract rates from the Escobal Mine were used to derive operating costs used in the reserve calculation.
7. La Arena – The basis of the Mineral Resource and Mineral Reserve estimates for the La Arena mine is from Technical Report on the La Arena Project, Peru, dated February 20, 2018 with an
effective date of January 1, 2018. Mineral Resources and Mineral Reserves reported at January 1, 2018 were calculated by applying the mine topographic surface at January 1, 2018 to an
updated Mineral Resource estimate completed July 1, 2017. Mineral Resources are reported at a cut-off grade of 0.10 g/t Au within an optimized undiscounted cash flow pit shell using a metal
price of $1,400/oz Au and actual costs experienced at the La Arena Mine. Mineral Reserves for the La Arena mine are reported at a 0.10 g/t gold cut-off grade and have been constrained to the
final pit design based on an optimized pit shell using $1,200 per ounce gold and actual operating costs incurred. As the resource block model is a diluted block model, no additional dilution or
mining losses were applied. The life-of-mine strip ratio is 1.9 (waste:ore).
8. Shahuindo – The basis of the Mineral Resource and Mineral Reserve estimates for the Shahuindo mine is from the NI 43-101 Technical Report on the Shahuindo Mine, Cajabamba, Peru, dated
January 25, 2016. Mineral Resources and Mineral Reserves reported at January 1, 2018 were calculated by applying the mine topographic surface at January 1, 2018 to an updated Mineral
Resource estimate completed July 1, 2017. The Shahuindo Mineral Resources are reported using a gold cut-off grade for oxide material of 0.15 g/t. Oxide resources are reported within a
$1,400/oz gold optimized pit shell. The sulfide Mineral Resources at Shahuindo are classified entirely as Inferred due to limited metallurgical characterization and wider drill spacing than in the
oxide portion of the deposit. There have been no economic or mining studies of the sulfide portion of the Shahuindo deposit completed to date; the Inferred sulfide Mineral Resource is
reported at a 0.5 g/t gold-equivalent cut-off grade using a silver-to-gold ratio of 80. Oxide Mineral Reserves are reported at a 0.18 g/t gold cut-off grade and have been constrained to the final
pit design based on an optimized pit shell using US$1,200/oz gold and actual operating costs incurred. The Mineral Reserves were calculated from Measured and Indicated oxide Mineral
Resources only and include 5% dilution and mining losses of 2%. The life-of-mine strip ratio is 1.1 (waste:ore). There are no sulfide Mineral Reserves reported for Shahuindo.
43 May 16, 2019You can also read