Pan American Silver Investor Presentation - September, 2019
←
→
Page content transcription
If your browser does not render page correctly, please read the page content below
Pan American Silver
Investor Presentation
     September, 2019
Cautionary Note
Non-GAAP Measures

This presentation of Pan American Silver Corp. and its subsidiaries (collectively, “Pan American”, “Pan American Silver”, the “Company”, “we” or “our”) refers to various non-GAAP measures, such as
such as “all-in sustaining costs per ounce sold", “cash costs per ounce sold”, “adjusted earnings” and “basic adjusted earnings per share”, "total debt", "capital", and “working capital". These measures
do not have a standardized meaning prescribed by IFRS as an indicator of performance, and may differ from methods used by other companies. Any reference to “Cash Costs” in this presentation should
be understood to mean cash costs per ounce of silver or gold sold, net of by-product credits. Any reference to “AISC” in this presentation should be understood to mean all-in sustaining costs per silver or
gold ounce sold, net of by-product credits.

Readers should refer to the “Alternative Performance (Non-GAAP) Measures” section of the Company’s Management’s Discussion and Analysis (“MD&A”) for the period ended June 30, 2019, available at
www.sedar.com.

Reporting Currency and Financial Information

Unless we have specified otherwise, all references to dollar amounts or $ are to United States dollars.

Integration of Tahoe Resources Inc. (“Tahoe”)

On February 22, 2019, the Company completed the previously announced transaction whereby Pan American acquired all of the issued and outstanding shares of Tahoe (“Acquisition”). The Company's
operations have been divided into silver and gold segments for the purposes of our financial reporting. All production, operating and financial results of the Acquired Mines (including Cash Costs and
AISC amounts) included in the Company's consolidated results and updated guidance, reflect only the results from February 22, 2019 onwards. Further details of the Acquisition are provided in the
"Acquisition of Tahoe" section of the MD&A for the period ended June 30, 2019.

Cautionary Note Regarding Forward Looking Statements and Information

Certain of the statements and information in this presentation constitute “forward-looking statements” within the meaning of the United States Private Securities Litigation Reform Act of 1995 and
“forward-looking information” within the meaning of applicable Canadian provincial securities laws. All statements, other than statements of historical fact, are forward-looking statements or
information. Forward-looking statements or information in this presentation relate to, among other things, future financial and operational performance; future production of silver, gold and other
metals produced by the Company; future Cash Costs and AISC; the sufficiency of the Company’s current working capital, anticipated operating cash flow or its ability to raise necessary funds; the
anticipated amount and timing of production at each of the Company’s properties and in the aggregate; our expectations with respect to future metal prices and exchange rates; the timing and
disclosure of the allocation of purchase price for the Acquisition; any potential future sale of assets (including the Timmins mines) and the timing for any such sale, and the impacts any such sale might
have on the Company; the duration and effect of the license suspensions and any road blocks relating to the Escobal mine; the estimated cost of and availability of funding necessary for sustaining
capital; forecast capital and non-operating spending; and the Company’s plans and expectations for its properties and operations.

 These statements and information reflect Pan American’s current views with respect to future events and are necessarily based upon a number of assumptions that, while considered reasonable by Pan
American, are inherently subject to significant operational, business, economic and regulatory uncertainties and contingencies. These assumptions include: tonnage of ore to be mined and processed;
ore grades and recoveries; prices for silver, gold and base metals remaining as estimated; currency exchange rates remaining as estimated; capital, decommissioning and reclamation estimates; our
mineral reserve and mineral resource estimates and the assumptions upon which they are based; prices for energy inputs, labour, materials, supplies and services (including transportation); no labour-
related disruptions at any of our operations; no unplanned delays or interruptions in scheduled production; all necessary permits, licenses and regulatory approvals for our operations are received in a
timely manner and can be maintained; and our ability to comply with environmental, health and safety laws, particularly given the potential for modifications and expansion of such laws. The foregoing
list of assumptions is not exhaustive.

…continued on next page

    2                                                                                  September 2019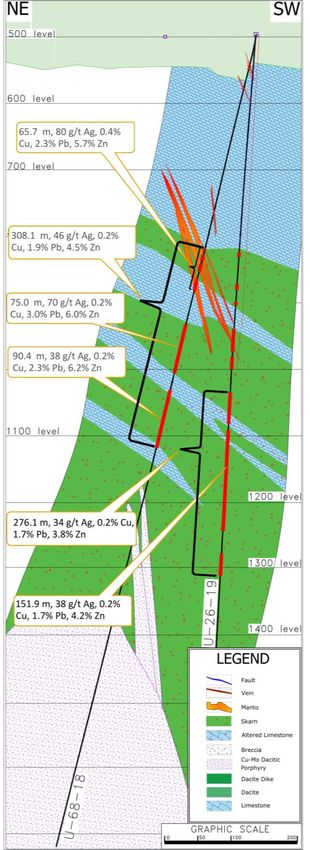
Cautionary Note
Cautionary Note Regarding Forward Looking Statements and Information (continued)…

The Company cautions the reader that forward-looking statements and information involve known and unknown risks, uncertainties and other factors that may cause actual results and
developments to differ materially from those expressed or implied by such forward-looking statements or information contained in this MD&A and the Company has made assumptions and
estimates based on or related to many of these factors. Such factors include, without limitation: fluctuations in silver, gold, and base metal prices; fluctuations in prices for energy inputs; fluctuations
in currency markets (such as the PEN, MXN, ARS, BOL, GTQ and CAD versus the USD); risks related to the technological and operational nature of the Company’s business; changes in national and
local government, legislation, taxation, controls or regulations and political, legal or economic developments in Canada, the United States, Mexico, Peru, Argentina, Bolivia, Guatemala or other
countries where the Company may carry on business, including the risk of expropriation related to certain of our operations, particularly in Argentina and Bolivia and risks related to the
constitutional court-mandated ILO 169 consultation process in Guatemala; risks and hazards associated with the business of mineral exploration, development and mining (including environmental
hazards, industrial accidents, unusual or unexpected geological or structural formations, pressures, cave-ins and flooding); risks relating to the credit worthiness or financial condition of suppliers,
refiners and other parties with whom the Company does business; inadequate insurance, or inability to obtain insurance, to cover these risks and hazards; employee relations; relationships with and
claims by the local communities and indigenous populations; availability and increasing costs associated with mining inputs and labour; the Company’s ability to secure our mine sites or maintain
access to our mine sites due to criminal activity, violence, or civil and labour unrest; the speculative nature of mineral exploration and development, including the risk of obtaining or retaining
necessary licenses and permits and the presence of laws, regulations and other legal impediments that may impose restrictions on mining, including those currently in the province of Chubut,
Argentina, or that might otherwise prevent or cause the suspension or discontinuation of mining activities; diminishing quantities or grades of mineral reserves as properties are mined; global
financial conditions; the Company’s ability to complete and successfully integrate acquisitions and to mitigate other business combination risks; challenges to, or difficulty in maintaining, the
Company’s title to properties and continued ownership thereof; the actual results of current exploration activities, conclusions of economic evaluations, and changes in project parameters to deal
with unanticipated economic or other factors; increased competition in the mining industry for properties, equipment, qualified personnel, and their costs; having sufficient cash to pay obligations
as they come due; and those factors identified under the caption “Risks Related to Pan American’s Business” in the Company’s most recent Form 40-F and Annual Information Form filed with the
United States Securities and Exchange Commission and Canadian provincial securities regulatory authorities, respectively. Although the Company has attempted to identify important factors that
could cause actual results to differ materially, there may be other factors that cause results not to be as anticipated, estimated, described, or intended. Investors are cautioned against attributing
undue certainty or reliance on forward-looking statements or information. Forward-looking statements and information are designed to help readers understand Management's current views of our
near and longer term prospects and may not be appropriate for other purposes. The Company does not intend, and does not assume any obligation, to update or revise forward-looking statements
or information to reflect changes in assumptions or in circumstances or any other events affecting such statements or information, other than as required by applicable law.

General Notes with Respect to Technical Information
Scientific and technical information contained in this presentation with respect to Pan American has been reviewed and approved by Martin Wafforn, P.Eng., SVP Technical Services and Process
Optimization, and Chris Emerson, FAusIMM, VP Business Development and Geology, who are Pan American’s qualified persons for the purposes of National Instrument 43-101 (“NI 43-101”). Mineral
reserves in this presentation were prepared under the supervision of, or were reviewed by, Martin Wafforn and Chris Emerson.
Mineral reserves and resources are as defined by the Canadian Institute of Mining, Metallurgy and Petroleum.
Pan American reports mineral resources and mineral reserves separately. Reported mineral resources do not include amounts identified as mineral reserves. Mineral resources that are not mineral
reserves have no demonstrated economic viability.
Pan American does not expect these mineral reserve and mineral resource estimates to be materially affected by metallurgical, environmental, permitting, legal, taxation, socio-economic, political,
and marketing or other relevant issues.
See the Company's Annual Information Form dated March 12, 2019, available at www.sedar.com for further information on the Company's pre-Tahoe acquisition material mineral properties,
including information concerning associated QA/QC and data verification matters, the key assumptions, parameters and methods used by the Company to estimate mineral reserves and mineral
resources, and for a detailed description of known legal, political, environmental, and other risks that could materially affect the Company's business and the potential development of the
Company's mineral reserves and resources.
For further information on the material mineral properties acquired from Tahoe, please refer to the Company's management information circular dated December 4, 2018, including additional
information contained in Tahoe's disclosure incorporated by reference therein, available at www.sedar.com.
Complete mineral reserve and resource information for all metals, including tonnage and grades, is available at www.panamericansilver.com. Quantities of contained metal are shown before
metallurgical recoveries.

  3                                                                                   September 2019
Cautionary Note About Mineral Reserves and
Mineral Resources
Cautionary Note to US Investors Concerning Estimates of Mineral Reserves and Mineral Resources
This presentation has been prepared in accordance with the requirements of Canadian securities laws, which differ from the requirements of U.S. securities laws. Unless otherwise indicated, all mineral
reserve and resource estimates included in this presentation have been prepared in accordance with Canadian National Instrument 43-101 – Standards of Disclosure for Mineral Projects (‘‘NI 43-101’’)
and the Canadian Institute of Mining, Metallurgy and Petroleum classification system. NI 43-101 is a rule developed by the Canadian Securities Administrators that establishes standards for all public
disclosure an issuer makes of scientific and technical information concerning mineral projects.
Canadian standards, including NI 43-101, differ significantly from the requirements of the United States Securities and Exchange Commission (the “SEC”), and information concerning mineralization,
deposits, mineral reserve and resource information contained or referred to herein may not be comparable to similar information disclosed by U.S. companies. In particular, and without limiting the
generality of the foregoing, this presentation uses the terms ‘‘measured resources’’, ‘‘indicated resources’’ and ‘‘inferred resources’’. U.S. investors are advised that, while such terms are recognized and
required by Canadian securities laws, the SEC has not recognized them under Industry Guide 7 prior to the adoption of the modernization of Property Disclosure for Mining Registrants. The
requirements of NI 43-101 for identification of ‘‘reserves’’ has not the same as those of the SEC, and reserves reported by Pan American in compliance with NI 43-101 may not qualify as ‘‘reserves’’
under SEC standards. Under U.S. standards, mineralization may not be classified as a ‘‘reserve’’ unless the determination has been made that the mineralization could be economically and legally
produced or extracted at the time the reserve determination is made. U.S. investors are cautioned not to assume that any part of a “measured resource” or “indicated resource” will ever be converted
into a “reserve”. U.S. investors should also understand that “inferred resources” have a great amount of uncertainty as to their existence and great uncertainty as to their economic and legal feasibility.
It cannot be assumed that all or any part of “inferred resources” exist, are economically or legally mineable or will ever be upgraded to a higher category. Under Canadian securities laws, estimated
“inferred resources” may not form the basis of feasibility or pre-feasibility studies except in rare cases. Disclosure of “contained ounces” in a mineral resource is permitted disclosure under Canadian
securities laws. However, the SEC has previously only permitted issuers to report mineralization that does not constitute “reserves” by SEC standards as in place tonnage and grade, without reference to
unit measures. Accordingly, information concerning mineral deposits set forth herein may not be comparable with information made public by companies that report in accordance with U.S. standards.

  4                                                                                  September 2019
The World’s Premier Silver Mining Company
Largest publicly traded silver mining company by free float
World class primary silver asset portfolio with one of the largest silver reserves of 557 M ounces
See presentation Appendix for more detailed information on the Company’s reserves and resources.
An industry leader in high margin / low cost production
Strong production profile
2019 production guidance: 25.3 – 26.3 Moz silver and 550 – 600 koz gold, plus base metal by-product
Strong financial position and capital discipline
Returned $438M to shareholders since 2010 and invested $539M in high-quality expansions funded from cash flow
Three large catalysts for growing shareholder value:
Navidad, Argentina – world’s largest undeveloped silver deposit
Escobal, Guatemala – one of world’s largest silver mines
Major new silver-zinc-lead discovery at La Colorada, Mexico
25-year proven track record of responsibly building and operating mines in Latin America
5 September 2019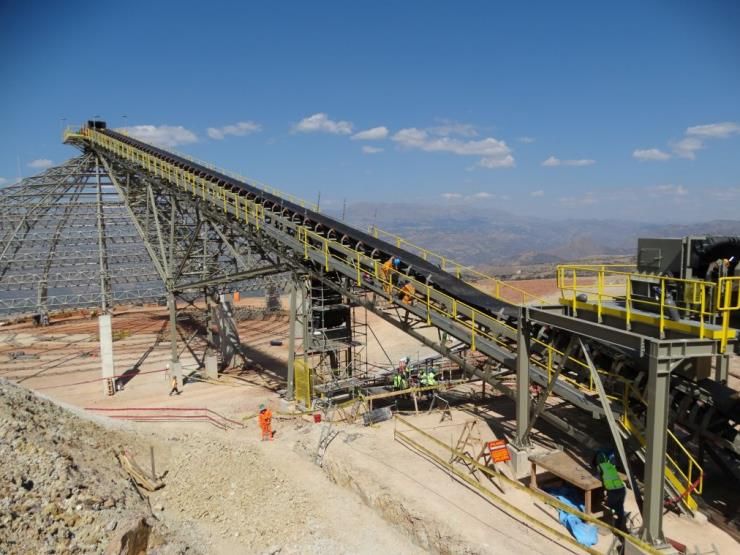
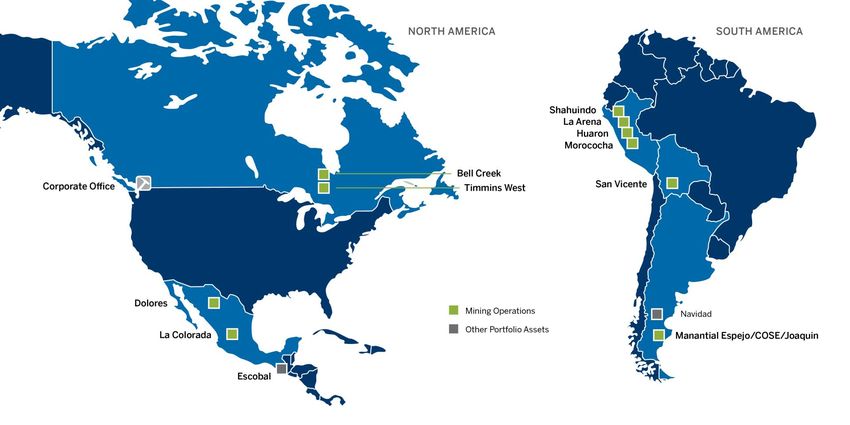
Diversified Portfolio Across the Americas

         25 years of experience working in Latin America
6                          September 2019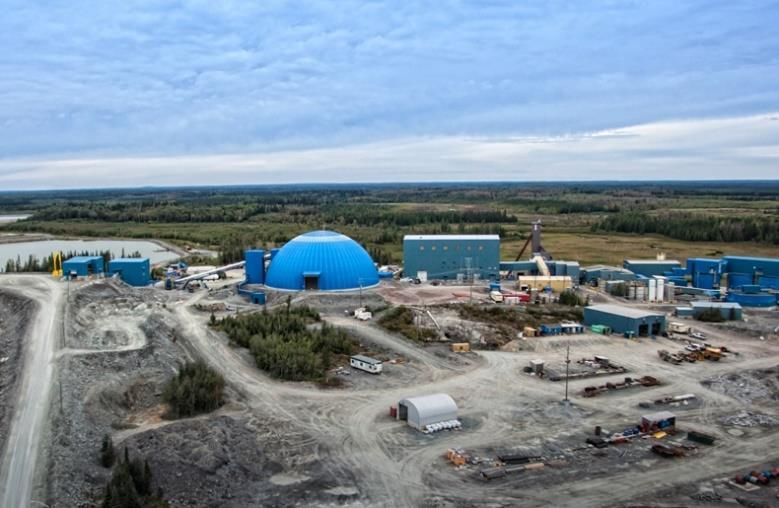
Tahoe Acquisition:
     Accretive on Reserves per Share
     The Tahoe transaction increased silver equivalent reserves per share nearly 50%
     from 4.3 AgEqOz/share to 6.5 AgEqOz/share.
                                               1,400                                                                                                                 1,315          7.0

                                               1,200                                                                                                                                6.0

                                                                                                                                                                                          Silver equivalent reserve ounces/share
           Silver equivalent reserves (Moz)1

                                               1,000                                                                                                                                5.0

                                                800                                                                                                                                 4.0
                                                                                                                                    639              662
                                                                            590          603            580         584
                                                600              531                                                                                                                3.0

                                                400    346                                                                                                                          2.0

                                                200                                                                                                                                 1.0

                                                  0                                                                                                                                 0.0
                                                       2011      2012       2013         2014          2015         2016           2017             2018             2019

                                                       Silver   Gold AgEq    Zinc AgEq         Lead AgEq        Copper AgEq         Silver equivalent reserve ounces/share

(1) Silver equivalent reserves are estimated using annual average market prices for each year as published by the London Metal Exchange (“LME”, for zinc, lead, copper) and London Bullion Market
Association (“LBMA”, for silver and gold).
See presentation Appendix for more detailed information on the Company's reserves and resources.

       7                                                                                       September 2019
Tahoe Acquisition:
   Accretive on Production per Share
   The Tahoe acquisition increased silver equivalent production per share by 27% based on 2019
   Guidance, before any potential Escobal production1.
                                                                     Silver equivalent production              Silver equivalent production (oz)/share                             0.7
                                                 100                                                                                                                 95.4

                                                                                                                                                                                   0.6

                                                                                                                                                                                         Silver equivalent production (oz)/share
           Silver equivalent production (Moz)2

                                                 80
                                                                                                                                                                                   0.5

                                                                                                                                                    58.5
                                                 60                                                                                53.9                                            0.4
                                                                                                       51.6          51.5
                                                                                          46.7
                                                                             41.1
                                                                                                                                                                                   0.3
                                                 40           35.3
                                                       29.7
                                                                                                                                                                                   0.2

                                                 20
                                                                                                                                                                                   0.1

                                                  0                                                                                                                                0.0
                                                       2011   2012          2013         2014         2015           2016         2017             2018            2019
                                                                                                                                                                 Guidance
(1) Based on the Revised August 2019 Forecast. Please refer to the MD&A for the period ended June 30, 2019 for more information.
(2) Silver equivalent production is calculated using annual average market prices for each year as published by the LME and LBMA, and realized metal prices for H1 2019 and forecast metal
prices for the remainder of 2019 for the 2019 Guidance.

     8                                                                                        September 2019
Strong Operating Margins through
Cost Discipline
Generated a Cumulative Operating Margin1 of ~$0.5 billion dollars over the 2015 to 2018 period.
                                           $700                                                                                                                                     $20
  Cumulative Operating Margin (Millions)

                                                                                                                                                                                           $/oz
                                                                                  $17.35                   $16.99                                                                   $18
                                           $600                                                                                  $15.61
                                                            $15.53
                                                                                                                                                             $15.10                 $16
                                           $500                                                                                                                                     $14
                                                            $14.49

                                                                                                                                                                                    $12
                                           $400                                   $11.94
                                                                                                                                                                                    $10
                                                                                                           $10.28
                                           $300                                                                                   $9.68
                                                                                                                                                                                    $8
                                                                                                                                                         $7.00 - $9.00
                                           $200                                                                                                                                     $6

                                                                                                                                                                                    $4
                                           $100
                                                                                                                                                                                    $2

                                            $0                                                                                                                                      $0
                                                                                                                                                                          2
                                                            2015                  2016                     2017                   2018                 2019 Guidance

                                                  All-in Sustaining Costs1   Operating Margin per Ounce1       Cumulative Operating Margin1      Average Realized Silver Price

 (1) All-in Sustaining Costs per Ounce (AISC), Operating Margin per Ounce and Cumulative Operating Margin are non-GAAP financial measures; see the “Non-GAAP Measures” section of our
 Cautionary Note on page 2 of this presentation. Operating Margin per Ounce and Cumulative Operating Margin are calculated as the difference between the average realized silver price and
 AISC, on a per ounce sold basis and on a dollar basis, respectively.
 (2) 2019 Guidance based on realized silver price for H1 2019 and forecast silver price for the remainder of 2019 for the 2019 Guidance and the mid-point of the Revised August 2019 Forecast
 range for AISC on a consolidated silver basis and silver production; for more information on the Revised August 2019 Forecast, please refer to the MD&A for the period ended June 30, 2019.

9                                                                                               September 2019
Free Cash Flow Allocation(1)
                                          10%
                                                                                                                                                    Return to shareholders
                                                                           27%
                                                                                                                                                      through dividends
                                           ~$1

                                                                                                                             Cash Flow Priorities
                                          Billion                                                                                                    Invest in high-return
                                     FCF generated                                                                                                         projects

                                      since 2010(2)                           13%
                         50%
                                                                                                                                                    Maintain balance sheet
                                                                                                                                                    flexibility, with low to
                                                                                                                                                           zero debt

Dividends            Share Repurchases                   Expansion Capital                 Debt Repayment

$438 M cumulative cash returned to shareholders (dividends and share buy-backs) since 2010 in
                    addition to investing $539 M in expansionary capital
 (1)  Generated approximately $1.02 billion in free cash flow and distributed approximately $1.08 billion.
 (2)  Free Cash Flow is a non-GAAP measure calculated as net increase (decrease) in cash and cash equivalents before dividend payments, share repurchases, expansion capital, M&A, short
      term investment payments and proceeds, debt repayments and proceeds and equity issuances.
 See the “Non-GAAP Measures” section of our Cautionary Note on page 2 of this presentation.

10                                                                            September 2019
Product Portfolio with Long-Term
Silver Exposure
2019 Guidance 2019 Revenue by Metal2 Reserves by Metal3
Silver
Production: 25.3 – 26.3 Moz
AISC: $9.75 - $11.251
Gold
Production: 550 – 600 koz
AISC: $1,025 - $1,1251
Silver Gold Zinc Lead Copper
For more information on the 2019 Guidance, please refer to the MD&A for the period ended June 30, 2019.
(1) All-in sustaining costs per ounce (AISC) is a non-GAAP financial measures; see the “Non-GAAP Measures” section of our Cautionary Note on page 2 of this presentation.
(2) 2019 revenue by metal is based on the mid-point of the Revised August 2019 Forecast range and realized metal prices for H1 2019 and the following metal prices for the remainder of 2019: of
$15.00/oz for silver, $2,400/tonne ($1.09/lb) for zinc, $1,950/tonne ($0.88/lb) for lead, $6,000/tonne ($2.72/lb) for copper, and $1,375/oz for gold.
(3) The reserves by metal reflect the Company's 2019 mineral reserve estimates as announced in the news release dated September 4, 2019 and metal price assumptions of $17.00/oz for silver, $1,300/oz
for gold, $2,500/tonne for zinc, $2,100/tonne for lead, and $6,000/tonne for copper. See presentation Appendix for more detailed information on the Company's reserves and resources.
11 September 2019Strategic Priorities
Integration & • Integrate Tahoe operations and capture synergies
Synergies • Divest non-core assets over time
• Reduce debt incurred through Tahoe acquisition
Capital Allocation • Return to shareholders through dividends
• Invest in high-return projects
• Focus on cost control to optimize operating margins
Operations • Ramp-up Dolores underground mine to 1,500 tpd
• Begin producing from Joaquin and COSE mines in Q4 2019
• La Colorada exploration discovery – targeting initial resource estimate in Q4 2019
Value Drivers • Potential development of the Navidad project
• Potential restart of operations at Escobal
Vision: The Premier Silver Mining Company
12 September 2019Q2 2019 Results
Consolidated Q2 2019 Highlights

      • Revenue of $282.9M(1), up 31% from Q2 2018 on higher metal sales
        volumes
      • Net earnings of $18.5M, or $0.09 basic earnings per share
      • Silver production of 6.5 Moz and gold production of 154.6 koz
      • Quarterly cash dividend of $0.035 per common share paid
      • Integration of former Tahoe operations progressing well
      • Exploration success continues at La Colorada

(1) As described in the "Acquisition of Tahoe" section of the MD&A for the period ended June 30, 2019, the Timmins and Bell Creek (the “Timmins”) mines
    are classified as assets-held-for-sale in the Company's Q2 2019 Financial Statements. As such, the consolidated revenue for the three and six months
    ended June 30, 2019 excludes $57.5 million and $78.6 million of Timmins' revenue.

 14                                                              September 2019
Q2 2019 Consolidated Cash Flows
(3) (2) (3)
(3)
(1)(3)
(1) Excludes amounts included in mine care & maintenance.
(2) Excludes amounts included in transaction & integration costs.
(3) “STI” means short-term investments, “OCF” means operating cash flow, “NCI” means non-controlling interests, and “NUAG” means New Pacific Metals Corp.
15 September 2019Liquidity and Capital Position
US$ Millions at June 30, 2019
Cash and Short-term investments 138.8
Working Capital(1) 793.1
Amount drawn on Revolving Credit Facility 335.0
Total debt(2) 378.8
(1) Working capital is a non-GAAP measure calculated as current assets less current liabilities. The Company and certain investors use this information
to evaluate whether the Company is able to meet its current obligations using its current assets.
(2) Total debt is a non-GAAP measure calculated as the total of amounts drawn on the Company’s $500 million revolving credit facility, finance lease
liabilities and loans payable.
See the “Non-GAAP Measures” section of our Cautionary Note on page 2 of this presentation.
16 September 2019Portfolio Optionality
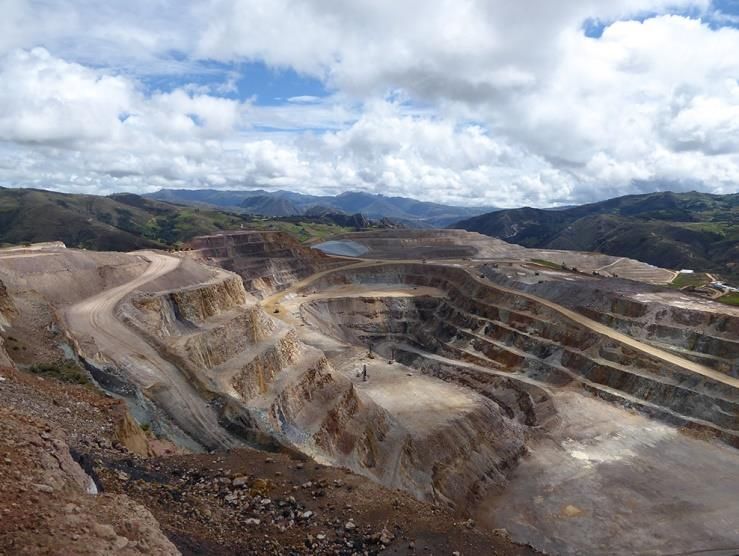
Escobal
One of The Largest Primary Silver Deposits
        Escobal compares favorably against other assets held by large and mid-cap silver companies; it has the
                    largest production1, largest reserve base2 , and an attractive cost position3

                                                                                                                                                                        1

                          Dolores

                      Huaron

                                                                        2017 Silver Production (Moz Ag)

  Source: all information shown in the table has been obtained from CIBC World Markets, as at November 2017, and has not been independently verified by the Company.
  (1) Escobal’s silver production and AISC is based on Tahoe’s disclosure for 2016. Escobal has not operated since June 2017. See slides on Escobal in presentation Appendix for further details.
  (2) Bubble size represents silver reserves; see presentation Appendix for more detailed information on Pan American’s and Tahoe’s reserves and resources.
  (3) AISC (US$/oz) or all-in sustaining costs per silver ounce sold is shown net of by-product credits and considered to be a non-GAAP financial measure.

 18                                                                          September 2019
Escobal
One of The World’s Best Silver Mines
High quality, well built operation with over US$500 million invested 1
One of the world’s largest primary silver deposits with reserves of 264 Moz 2
3 consecutive years of production above 20 Moz Ag / year at
AISC consistently below US$10/oz Ag prior to 2017
Implement Pan American’s approach to community engagement and business
practices, and support ILO 169 consultation led by Guatemalan government
Historical Production (Moz Ag) Reserves & Resources2 (as at June 30, 2019)
Grade Contained Metal
Tonnes Ag Au Pb Zn Ag Au Pb Zn
(Mt) (g/t) (g/t) (%) (%) (Moz) (koz) (kt) (kt)
P&P Reserves 24.7 334 0.35 0.79 1.30 264.5 278 196 320
M&I Resources 16.5 208 0.21 0.37 0.65 110.1 110 61 106
Inferred
1.9 180 0.90 0.22 0.42 10.7 54 4 8
Resources
(1) Based on development, expansion, and sustaining capital invested from 2011 to 2017.
19 See presentation Appendix for more detailed information on the Company's reserves and resources.Navidad
One of the Largest Undeveloped Primary Silver Deposits
• 100% owned silver project located in Chubut Province,
Argentina
• Acquired in 2010 through the acquisition of Aquiline Resources
Inc.
• The project comprises eight individual mineral deposits in
three separate mineralized trends (Navidad, Esperanza and
Argenta trends)
− The six deposits of the Navidad Trend occur along strike Navidad
over a distance of about 5.8 km and are essentially
continuous
• “Law 5001”, passed in 2003, prohibits mining in Chubut
Province.
• In March 2018, a “Zonification” bill was submitted to the Resources1 (as at June 30, 2019)
Chubut legislature that would permit mining in certain zones of
the province, with Navidad being located in the proposed
permitted zone. This bill has not been debated or passed in the Grade Contained Metal
legislature at this time. Tonnes Ag Cu Pb Ag Cu Pb
(Mt) (g/t) (%) (%) (Moz) (kt) (kt)
M&I Resources 155.2 127 0.05 0.85 632.4 71 1326
Inferred
45.9 81 0.02 0.57 119.4 9 262
Resources
(1) See presentation Appendix for more detailed information on the Company's reserves and resources.
20 September 2019La Colorada Discovery
Major skarn deposit discovered late 2018
Discovery located adjacent and below Pan American’s La Colorada vein system
Drilling encountered wide intercepts with high-grade, polymetallic mineralization
Drill holes currently cover an area of 600 metres x 300 metres
Targeting initial resource estimate late 2019
DRILL HIGHLIGHTS
• U-39-18: 223 m at 69 g/t Ag, 0.2 % Cu, 1.86% Pb and 3.36% Zn
• U-51-19: 114.0 m at 109 g/t Ag, 0.38% Cu, 1.66% Pb and 3.80% Zn
• including 58.2 m at 158 g/t Ag, 0.59% Cu, 2.57% Pb and 5.08% Zn
• U-46-19: 126.0 m at 55 g/t Ag, 0.22% Cu, 3.79% Pb and 6.56% Zn
• and 32.9 m at 74 g/t Ag, 0.44% Cu, 5.38% Pb and 10.29% Zn
• U-22-19: 254 m at 41 g/t Ag, 0.07 % Cu, 0.92 % Pb, 3.68 % Zn
• Including 129 m at 25 g/t Ag, 0.1% Cu, 1.09% Pb, 5.18% Zn
• U-68-18: 308.1 m at 46 g/t Ag, 0.20% Cu, 1.93% Pb, 4.56% Zn
• including 75.0 m at 70 g/t Ag, 0.23% Cu, 3.01% Pb, 6.02% Zn
• U-26-19: 276.1 m at 34 g/t Ag, 0.18% Cu, 1.69% Pb, 3.76% Zn
Drill results have been reported in our news releases dated October 23, 2018, February 21, 2019, May 8, 2019 and August 1, 2019.
For further details please see the Company’s website at www.panamericansilver.com/operations/north-and-central-america/la-colorada/
21 September 2019Other Portfolio Assets
• Maverix Metals Inc. - Pan American owns ~26% (~29% fully diluted) of this
precious metals royalty and streaming company, representing a market value of
~CAD$181 M1.
• Silver Sand property (Bolivia) – Pan American holds ~16.9% interest in New
Pacific Metals Corp. providing exposure to this prospective silver project2.
• Amalia project (Mexico) – JV agreement with Radius Gold whereby Pan
American can earn an initial 65% in the project and may earn an additional 10%
by completing a preliminary feasibility study.
• Shalipayco project (Peru) – Pan American holds a free carried interest of 25%
to commercial production in this zinc development project owned by Nexa
Resources.
(1) Based on Maverix Metals Inc. (“Maverix”) closing price as at August 30, 2019 of $6.56/share on the TSX Venture Exchange (listed as “MMX”) and Pan
American’s ownership of ~26% of Maverix.
(2) Share ownership interest as of May 22, 2019 and calculated on a non-diluted basis.
22 September 2019A History of Replacing Reserves
Over the last 14 years, Pan American invested $185 million in exploration, added 356 million ounces
of contained silver to mineral reserves through mine-site exploration and replaced 372 million
ounces produced in the same period, at a reserve replacement cost of $0.52 per ounce (1).
600 (3)
Millions oz
557
Cumulative Contained Silver Production Contained Silver Reserves
500
400
(2) 324
317
300
280 286 288 280
300
228 232 231 235
213 224
200
100
0
2006 2007 2008 2009 2010 2011 2012 2013 2014 2015 2016 2017 2018 Q2 2019
(1) Non-GAAP measure; calculated as total drilling cost divided by ounces found/replaced in reserves.
(2) Includes mineral reserves from assets acquired from Minefinders Corporation.
(3) Includes mineral reserves from assets acquired from Tahoe.
See presentation Appendix for more detailed information on the Company's reserves and resources.
23 September 2019A Leader in Responsible Mining
Culture of Social Responsibility and Environmental Performance Track Record of Success in Latin America
Transparent Sustainability Reporting 25 years of building trust with local communities
• Based on annual consultation process with all and indigenous groups across Latin America
stakeholder groups
• Report on our efforts towards the UN’s
Sustainable Development Goals
Successfully permitted 2 new mines and 5
major mine expansions in the past 13 years
• Report on environmental and social audits
Generating Local Benefits
Member of the Mining +78 local supply companies started with our support
Association of Canada’s Towards +11 alternative economic (non-mining) development programs
Sustainable Mining Program
Awarded “Business of the Year”
in 2016 for our sustainable
development work in Peru
Zero material environmental or
social incidents in Company history Robert R. Hedley Award for Excellence in Social
and Environmental Responsibility (AME, 2018)
Social responsibility is an important pillar of Pan American’s governing philosophy
24 September 2019PAAS Company Snapshot
Ticker TSX/NASDAQ PAAS
Shares Outstanding 209.6 million
Shares issuable upon exchange of CVRs1 15.6 million
Market Cap2 $3.9 billion
Avg. Daily Volume (3 month)2 3.4 million shares
Dividend Yield3 0.8%
Total debt4 $378.8 million
Total available liquidity5 $303.8 million
(1) Shareholders of Tahoe received one contingent value right ("CVR") for each Tahoe under the plan of arrangement with Pan American Silver. Each
CVRs will be exchanged for 0.0497 of a Pan American share upon first commercial shipment of concentrate following restart of operations at the
Escobal mine. The CVRs expire in 2029.
(2) All data based on NASDAQ exchange; as of market close August 30, 2019.
(3) Based on closing share price on August 26, 2019 and dividend declared August 7, 2019, annualized.
(4) Total debt is a non-GAAP measure that includes all financial liabilities; total debt at June 30, 2019.
(5) Total available liquidity is a non-GAAP measure, and includes cash and cash equivalents, short-term investments, and the undrawn portion of the
Company’s revolving credit facility.
See the “Non-GAAP Measures” section of our Cautionary Note on page 2 of this presentation.
25 September 2019Appendix
2019 Guidance
Table reflects revisions to the 2019 annual guidance for consolidated Cash Costs, AISC and silver and gold production made on August 7, 2019.

                                                               Silver Production                       Gold Production                             Cash Costs                                    AISC
                                                                  (million ounces)                     (thousand ounces)                         ($ per     ounce)(1)                   ($ per ounce)(1)
  Silver Segment (Jan 1 – Dec 31)
     La Colorada                                                                  8.0 - 8.2                             4.1 - 4.8                           2.50 - 3.50                            3.50 - 4.50
     Dolores                                                                      5.2 - 5.5                        114.5 - 120.0                            2.80 - 3.40                          15.00 - 17.00
     Huaron                                                                       3.6 - 3.7                                   0.5                           6.00 - 7.00                            7.50 - 9.25
     Morococha (92.3%)(2)                                                         2.5 - 2.6                             1.2 - 1.5                           3.10 - 4.00                            7.00 - 9.00
     San Vicente (95.0%)(3)                                                       3.5 - 3.7                                   0.3                         10.60 - 11.50                          12.25 - 13.50
     Manantial Espejo/COSE/Joaquin                                                2.4 - 2.5                          20.0 - 25.0                          21.70 - 22.60                          22.00 - 24.00
  Total(4)                                                                      25.2 - 26.2                        140.5 - 152.5                            6.50 - 7.50                           9.75 - 11.25
  Gold Segment (Feb 22 – Dec 31)
     Shahuindo                                                                          0.1                        137.0 - 165.0                             550 - 625                             875 - 1,000
     La Arena                                                                            —                         117.5 - 122.5                             800 - 850                           1,275 - 1,325
     Timmins(5)                                                                          —                         155.0 - 160.0                             890 - 940                           1,025 - 1,075
  Total(4)                                                                              0.1                        409.5 - 447.5                             740 - 810                           1,025 - 1,125
  Total Production(6)                                                           25.3 - 26.3                        550.0 - 600.0                                     —                                      —
  Consolidated Silver Basis                                                              —                                    —                         (3.30) – (1.80)                            7.00 – 9.00
  (1)   Cash Costs and AISC are non-GAAP measures. Please refer to the section “Alternative Performance (Non-GAAP) Measures” of the MD&A for the period ended June 30, 2019, for a detailed description of these
        measures and where appropriate a reconciliation of the measure to the Q2 2019 Financial Statements. The Cash Costs and AISC forecasts assume realized metal prices for H1 2019 and the following metal
        prices for the remainder of 2019 of $15.00/oz for silver, $2,400/tonne ($1.09/lb) for zinc, $1,950/tonne ($0.88/lb) for lead, $6,000/tonne ($2.72/lb) for copper, and $1,375/oz for gold; and average annual
        exchange rates relative to 1 USD of 19.50 for the Mexican peso ("MXN"), 3.33 of the Peruvian sol ("PEN"), 41.80 for the Argentine peso ("ARS"), 6.91 for the Bolivian boliviano ("BOL"), and $1.30 for the
        Canadian dollar ("CAD").
  (2)   Morococha data represents Pan American’s 92.3% interest in the mine's production.
  (3)   San Vicente data represents Pan American’s 95.0% interest in the mine's production.
  (4)   As shown in the detailed quantification of consolidated AISC, included in the “Alternative Performance (Non-GAAP) Measures” section of the MD&A for the period ended June 30, 2019, corporate general and
        administrative expense, and exploration and project development expense are included in Consolidated Silver Basis AISC, though are not allocated amongst the operations and thus are not included in either
        the silver or gold segment totals.
  (5)   The Timmins mines are classified as assets held for sale in the Company's Q2 2019 Financial Statements, as described in Note 4 of the Company's Q2 2019 Financial Statements, and in the "Acquisition of
        Tahoe" section of the MD&A for the period ended June 30, 2019. The gold production from the Timmins mines is included in the consolidated guidance, pending resolution from the sale process.
  (6)   Totals may not add due to rounding.

27                                                                                        September 2019
Silver Market
2018 Supply & Demand (million ounces)
2018 Fundamentals
• Silver price averaged $15.71, down ~8% from 2017. Total Supply 1,004.3
• Demand greater than supply, resulting in physical deficit of
Demand 1,033.5
29.2M oz in 2018.
• Trade dispute between China and U.S. negatively impacted silver Jewelry 212.5
prices by strengthening the USD and weighing down metal
Coins & Bars 181.2
prices.
Silverware 61.1
Outlook for 2019 Industrial 578.6
• Supply demand balance tight, silver/gold ratio at historic heights.
Electronics 248.5
• Investment demand will drive silver prices.
• Increasing importance for exposure to precious metals including Brazing Alloys & Solders 58.0
silver in investment portfolio to hedge against potential
Photography 39.3
downturn in equity markets.
• Pan American is a leading investment for exposure to silver. Photovoltaic 80.5
Other Industrial 152.3
ETP & Exchange Inventory Build 50.9
Net Deficit -80.1
Source: The Silver Institute, World Silver Survey 2019
published April 2019
28 September 2019Silver: Metal of the Future
Supply 2018: Mine supply 856 Moz Demand 2018: Industrial 579 Moz
Scrap supply 155 Moz Jewelry 213 Moz
TOTAL ~ 1.0 Boz Bullion 181 Moz
Silverware 61 Moz
TOTAL ~ 1.03 Boz
Source: The Silver Institute, World Silver Survey 2019 published April 2019
29 September 2019La Colorada
Pan American’s Largest Silver Producing Mine with Significant Growth Potential
• La Colorada is an underground mine located in Zacatecas,
Mexico
• 100% owned and operated by Pan American
• Epithermal silver deposit, with transition at depth to a base
metal predominant system
• Currently producing silver-gold doré bars from a conventional La Colorada
cyanide leach plant for the oxide ore, and silver-rich lead
and zinc concentrates from a flotation plant treating
sulphide ore
• Successful exploration drilling at La Colorada has discovered
wide zones of mineralization below current production levels
• Potential to substantially expand mineral resources, mine life Mexico
and ultimately production capacity
Production1 (Moz Ag) Reserves & Resources2 (as at June 30, 2019)
Grade Contained Metal
Tonnes Ag Au Pb Zn Ag Au Pb Zn
(Mt) (g/t) (g/t) (%) (%) (Moz) (koz) (kt) (kt)
P&P Reserves 9.4 333 0.29 1.51 2.73 100.4 86 141 256
M&I Resources 2.1 196 0.17 0.58 1.16 13.4 12 12 25
Inferred
8.1 133 0.12 2.03 4.01 34.5 32 163 324
Resources
(1) Guidance as reported on Q2 Management, Discussion and Analysis dated August 7, 2019.
(2) See presentation Appendix for more detailed information on the Company's reserves and resources.
30 September 2019Dolores
Large Silver/Gold Mine
• The Dolores mine is 100% owned and operated by
Pan American
• Low sulphidation epithermal deposit with strong
structural control. Silver and gold mineralization is
hosted in hydrothermal breccias and sheeted vein
zones Dolores
• Mining at Dolores is by open pit and underground
methods. The mine uses conventional cyanide heap
leaching to produce gold and silver doré
• Expansion completed in 2017 featuring a pulp
agglomeration plant to process high-grade ore from
a new underground mine, together with the high-
grade portion of the ore from the open-pit mine Mexico
• Average throughput capacity of 20,000 tpd
Production1 (Moz Ag) Reserves & Resources2 (as at June 30, 2019)
Grade Contained Metal
Tonnes Ag Au Ag Au
(Mt) (g/t) (g/t) (Moz) (koz)
P&P Reserves 43.7 26 0.84 36.7 1178
M&I Resources 3.5 24 0.44 2.7 49
Inferred
4.0 47 1.22 6.0 156
Resources
(1) Guidance as reported on Q2 Management, Discussion and Analysis dated August 7, 2019.
(2) See presentation Appendix for more detailed information on the Company's reserves and resources.
31 September 2019Huaron
Polymetallic Silver Mine
• The Huaron underground mine is 100% owned and
operated by Pan American
• Huaron is a hydrothermal polymetallic deposit of silver,
lead, zinc, and copper occurring in veins, mantos and
disseminated volcanic intrusions
Peru
• The mine operates at 2,500 tpd using flotation
technology to produce silver in copper, lead, and zinc
concentrates
• Mechanization of mining methods at Huaron has
improved efficiency and reduced operating costs Huaron
• Upgrades to the flotation circuit have resulted in
improved mill recoveries
Production1 (Moz Ag) Reserves & Resources2 (as at June 30, 2019)
Grade Contained Metal
Tonnes Ag Cu Pb Zn Ag Cu Pb Zn
(Mt) (g/t) (%) (%) (%) (Moz) (kt) (kt) (kt)
P&P Reserves 9.9 168 0.56 1.48 3.01 53.7 55 147 298
M&I Resources 4.6 156 0.60 1.57 2.92 23.0 27 72 134
Inferred
6.2 155 0.41 1.45 2.77 30.8 25 90 171
Resources
(1) Guidance as reported on Q2 Management, Discussion and Analysis dated August 7, 2019.
(2) See presentation Appendix for more detailed information on the Company's reserves and resources.
32 September 2019Morococha
Polymetallic Mine
• The Morococha underground mine is 92.3% owned
and operated by Pan American
• Polymetallic mineralization comprising silver, lead,
zinc, and copper
• Mineralization includes epithermal veins, bedded
silver-base metal replacements or mantos and Peru
intrusive-sediment contact skarns.
• Morococha operates at 2,000 tpd using standard
flotation technology to produce silver in zinc, lead,
and copper concentrates
• Mechanization of mining methods at Morococha has Morococha
improved efficiency and reduced operating costs
• Current activities focus on opportunities to enhance
productivities and efficiencies while designing for the
eventual mill relocation
Production1 (Moz Ag) Reserves & Resources2 (as at June 30, 2019)
Grade Contained Metal
Tonnes Ag Cu Pb Zn Ag Cu Pb Zn
(Mt) (g/t) (%) (%) (%) (Moz) (kt) (kt) (kt)
P&P Reserves 6.3 156 0.35 1.32 3.76 31.9 22 84 239
M&I Resources 0.6 141 0.24 0.84 2.11 2.8 1 5 13
Inferred
4.5 138 0.37 1.02 3.26 19.9 17 45 146
Resources
(1) Guidance as reported on Q2 Management, Discussion and Analysis dated August 7, 2019.
(2) See presentation Appendix for more detailed information on the Company's reserves and resources.
33 September 2019San Vicente
Polymetallic Silver-Zinc Mine
• The San Vicente underground mine is 95% owned
and operated by Pan American
• Hydrothermal polymetallic deposit consisting of
replacement veins in pre-existing faults,
replacements in conglomerates, and mineralization
in dacitic dykes
• The San Vicente plant has an average throughput of
950 tpd and utilizes a standard flotation process to
produce silver-zinc and silver-lead concentrates
• Lower production costs resulting from productivity
enhancements associated with mechanization San Vicente
efforts, enhanced mine dilution controls and
improvements in site infrastructure
Production1 (Moz Ag) Reserves & Resources2 (as at June 30, 2019)
Grade Contained Metal
Tonnes Ag Cu Pb Zn Ag Cu Pb Zn
(Mt) (g/t) (%) (%) (%) (Moz) (kt) (kt) (kt)
P&P Reserves 1.9 395 0.40 0.37 2.96 24.6 8 7 57
M&I Resources 1.1 160 0.23 0.20 2.14 5.8 3 2 24
Inferred
3.0 289 0.24 0.38 3.32 27.9 7 11 100
Resources
(1) Guidance as reported on Q2 Management, Discussion and Analysis dated August 7, 2019.
(2) See presentation Appendix for more detailed information on the Company's reserves and resources.
34 September 2019Manantial Espejo
Providing Support to the Development of the Joaquin and COSE Projects
• The Manantial Espejo underground mine is 100% owned and
operated by Pan American
• Low sulphidation, silver-gold epithermal deposit
• Ore is treated by gravity concentration, agitation leaching and
Merril Crowe processing to produce silver-gold doré
• Underground mining at the nearby COSE and Joaquin
properties will generate further value from the Manantial
Espejo plant
• Combined production from the Joaquin, COSE and Manantial
Espejo mines is expected to add 21 million silver ounces over
the 2018 to 2021 period
Manantial Espejo
• Extending the life of the Manantial Espejo plant allows
continued exploration activities and potential to add other
high grade deposits
Production1 (Moz Ag) Proven & Probable Reserves2 (as at June 30, 2019)
Grade Contained Metal
Tonnes Ag Au Ag Au
(Mt) (g/t) (g/t) (Moz) (koz)
Manantial
1.0 175 1.67 5.5 52
Espejo
Joaquin 0.5 721 0.41 11.0 6
COSE 0.1 918 17.70 2.2 43
(1) Guidance as reported on Q2 Management, Discussion and Analysis dated August 7, 2019.
(2) See presentation Appendix for more detailed information on the Company's reserves and resources.
35 September 2019Shahuindo
Sizeable Gold Mine with Significant Growth Potential
• 100% owned open pit gold mine located in northern Peru
producing silver by-products from doré
• Heap leach processing
• Commercial production began in 2016 with current
estimated mine life until 2028
• Significant exploration opportunity and ability to extend
mine life
• Full ramp-up of recent expansion to 36 ktpd expected to be
achieved during the first half of 2019 Shahuindo
Production1 (koz Au) Reserves & Resources2 (as at June 30, 2019)
Grade Contained Metal
Tonnes Au Ag Au Ag
(Mt) (g/t) (g/t) (koz) (Moz)
137 - 165
P&P Reserves 112.6 0.49 6.2 1763 22.3
79 90
M&I Resources 12.1 0.48 6.0 187 2.3
30.7
Inferred
2017A 2018A 2019 Guidance 3 107.3 0.71 13.5 2464 46.7
Resources
(1) Guidance as reported on Q2 Management, Discussion and Analysis dated August 7, 2019.
(2) See presentation Appendix for more detailed information on the Company's reserves and resources.
(3) Shaded region represents 30.7koz of gold production in 2019 prior to Pan American Silver acquiring ownership as of February 22, 2019.
36 September 2019La Arena
Producing Gold Mine with Sulphide Expansion Potential
• 100% owned open pit gold mine located in Peru producing
doré
• Run-of-mine heap leach currently processing 36 ktpd
• Commercial production began in 2011 with estimated mine
life until 2021
• PEA released in February 2018 on sulphide expansion (“La
Arena II”)
• Highlights from the PEA include:
− 21 year mine life
− Average annual production of 149 koz gold and 94 kt of
copper
− US$824M after-tax NPV8% La Arena
− Mineral resources that are not mineral reserves do not have
demonstrated economic viability. This PEA is preliminary in
nature and includes inferred mineral resources that are
considered too speculative geologically to be categorized as
mineral reserves and there is no certainty that the PEA will be
realized.
Reserves & Resources2 (as at June 30, 2019)
Production1 (koz Au)
La Arena
Grade Contained Metal
Tonnes Au Au
(Mt) (g/t) (koz)
P&P Reserves 36.8 0.35 410
M&I Resources 3.0 0.39 38
Inferred Resources 1.1 0.30 11
196 117.5 -
162 122.5 La Arena II
Grade Contained Metal
Tonnes Au Cu Au Cu
32.8 (Mt) (g/t) (%) (koz) (kt)
2017A 2018A 2019 Guidance3 M&I Resources 742.4 0.24 0.35 5637 2626
Inferred Resources 91.6 0.23 0.17 683 156
(1) Guidance as reported on Q2 Management, Discussion and Analysis dated August 7, 2019.
37 (2) See presentation Appendix for more detailed information on the Company's reserves and resources.
(3) Shaded region represents 32.8koz of gold production in 2019 prior to Pan American Silver acquiring ownership as of February 22, 2019.Timmins Mines
Two Producing Mines in Prolific Canadian Mining Camp
• The Timmins mines are comprised of the 100% owned
Timmins West and Bell Creek mines, both of which are
located near Timmins, Ontario
• Underground gold operation with an estimated mine
reserve life until 2024, producing doré
• Leach / CIL-CIP / EW processing at Bell Creek, which has
capacity of 4 ktpd
• Shaft upgrade to 1,080 metres depth in commission,
which will greatly reduce bottlenecks at Bell Creek Bell Creek
Timmins West
• Significant land position in the Timmins Camp with
potential for exploration upside
• The Timmins Mines are located near several other high
quality gold operations including Goldcorp’s Porcupine
mine and Detour’s Detour Lake mine
Production1 (koz Au) Reserves & Resources2 (as at June 30, 2019)
Grade Contained Metal
Tonnes Au Au
(Mt) (g/t) (koz)
155 - 160
P&P Reserves 9.9 3.09 988
167 152
M&I Resources 7.1 3.52 800
37.3
Inferred Resources 3.7 3.74 444
2017A 2018A 2019 Guidance3
(1) Guidance as reported on Q2 Management, Discussion and Analysis dated August 7, 2019.
(2) See presentation Appendix for more detailed information on the Company's reserves and resources.
(3) Shaded region represents 37.3koz of gold production in 2019 prior to Pan American Silver acquiring ownership as of February 22, 2019.
38 September 2019Pan American Silver Proven and Probable Reserves1,2
Property Location Classification Tonnes Ag Contained Au Contained Cu (%) Contained Pb (%) Contained Zn (%) Contained
(Mt) (g/t) Ag (Moz) (g/t) Au (koz) Cu (kt) Pb (kt) Zn (kt)
Silver Segment
Huaron Peru Proven 6.2 168 33.5 - - 0.69 43.0 1.44 89.5 3.02 188.1
Probable 3.7 170 20.1 - - 0.33 12.3 1.55 57.1 3.00 110.2
Morococha (92.3%) (3) Peru Proven 4.1 147 19.5 - - 0.38 15.5 1.38 57.1 4.03 166.7
Probable 2.2 173 12.3 - - 0.31 6.9 1.20 26.5 3.26 72.2
La Colorada Mexico Proven 4.0 395 50.8 0.33 42.0 - - 1.72 68.9 3.11 124.4
Probable 5.4 287 49.6 0.26 44.4 - - 1.35 72.4 2.44 131.4
Dolores Mexico Proven 35.9 26 29.8 0.84 967.4 - - - - - -
Probable 7.8 28 6.9 0.84 210.7 - - - - - -
Manantial Espejo Argentina Proven 0.8 170 4.6 1.35 36.2 - - - - - -
Probable 0.1 204 0.9 3.64 16.0 - - - - - -
San Vicente (95%) (3) Bolivia Proven 1.4 414 18.6 - - 0.43 6.0 0.35 4.9 3.06 42.9
Probable 0.5 345 6.0 - - 0.32 1.7 0.42 2.3 2.71 14.5
Joaquin Argentina Probable 0.5 721 11.0 0.41 6.2 - - - - - -
COSE Argentina Probable 0.1 918 2.2 17.7 43.3 - - - - - -
Escobal Guatemala Proven 2.5 486 39.5 0.42 34.2 - - 1.02 25.7 1.75 44.4
Probable 22.1 316 225.0 0.34 243.8 - - 0.77 169.9 1.25 275.7
Total Silver
Segment(4) 97.5 169 530.4 0.64 1,644.1 0.47 85.4 1.10 574.1 2.24 1,170.6
Gold Segment
La Arena Peru Proven 27.4 - - 0.36 319.4 - - - - - -
Probable 9.5 - - 0.30 90.9 - - - - - -
Shahuindo Peru Proven 69.8 6 14.4 0.51 1,133.2 - - - - - -
Probable 42.8 6 7.8 0.46 629.9 - - - - - -
Timmins Canada Proven 2.7 - - 3.06 269.1 - - - - - -
Probable 7.2 - - 3.10 718.6 - - - - - -
La Bolsa Mexico Proven 9.5 10 3.1 0.67 202.9 - - - - - -
Probable 6.2 7 1.4 0.57 113.1 - - - - - -
Total Gold
Segment(4) 175.0 6 26.8 0.62 3,476.9 - - - - - -
Total Gold and Silver Proven +
Segments (4) Probable 272.5 77 557.2 0.63 5,121.1 0.47 85.4 1.10 574.1 2.24 1,170.6
(1) See table below entitled “Metal price assumptions used to estimate mineral reserves and resources as at June 30, 2019”.
(2) Mineral reserve estimates were prepared under the supervision of, or were reviewed by, Christopher Emerson, FAusIMM, Vice President Business Development and Geology and Martin G.
Wafforn, P.Eng., Senior Vice President Technical Services and Process Optimization, each of whom are Qualified Persons as that term is defined in National Instrument 43-101 (“NI 43-101).
(3) This information represents the portion of mineral reserves attributable to Pan American based on its ownership interest in the operating entity as indicated.
(4) Totals may not add up due to rounding. Total average grades of each element are with respect to those mines that produce the element.
Pan American Silver Mineral Reserve and Mineral Resource Information as at June 30, 2019Pan American Silver Measured and Indicated Resources1,2
Property Location Classification Tonnes (Mt) Ag (g/t) Contained Ag Au (g/t) Contained Au (koz) Cu (%) Pb (%) Zn (%)
(Moz)
Silver Segment
Huaron Peru Measured 2.2 157 11.0 - - 0.59 1.50 2.80
Indicated 2.4 155 12.0 - - 0.61 1.64 3.03
Morococha (92.3%) (3) Peru Measured 0.3 138 1.2 - - 0.29 0.86 2.14
Indicated 0.3 143 1.6 - - 0.20 0.83 2.09
La Colorada Mexico Measured 0.5 229 3.8 0.24 4.0 - 0.65 1.16
Indicated 1.6 185 9.6 0.15 7.8 - 0.56 1.16
Dolores Mexico Measured 2.0 21 1.3 0.35 22.0 - - -
Indicated 1.5 28 1.4 0.56 27.1 - - -
Manantial Espejo Argentina Measured 0.1 164 0.7 1.65 7.1 - - -
Indicated 0.2 241 1.4 2.86 16.5 - - -
San Vicente (95%) (3) Bolivia Measured 0.9 161 4.4 - - 0.22 0.20 2.27
Indicated 0.3 158 1.4 - - 0.27 0.21 1.73
Navidad Argentina Measured 15.4 137 67.8 - - 0.10 1.44 -
Indicated 139.8 126 564.5 - - 0.04 0.79 -
Joaquin Argentina Indicated 0.1 385 0.7 0.58 1.1 - - -
Escobal Guatemala Measured 2.3 251 18.6 0.23 16.7 - 0.31 0.59
Indicated 14.2 201 91.6 0.20 93.0 - 0.38 0.66
Total Silver Segment(4) 184.0 134 792.9 0.27 195.3 0.06 0.82 1.21
Gold Segment
La Bolsa Mexico Measured 1.4 11 0.5 0.90 39.9 - - -
Indicated 4.5 9 1.3 0.50 71.2 - - -
Pico Machay Peru Measured 4.7 - - 0.91 137.5 - - -
Indicated 5.9 - - 0.67 127.1 - - -
La Arena Peru Measured 1.3 - - 0.41 17.5 - - -
Indicated 1.7 - - 0.38 20.6 - - -
Shahuindo Peru Measured 3.7 7 0.8 0.53 63.2 - - -
Indicated 8.4 5 1.5 0.46 123.6 - - -
Timmins Canada Measured 1.7 - - 3.89 212.4 - - -
Indicated 5.4 - - 3.41 587.8 - - -
La Arena II Peru Measured 155.7 - - 0.25 1,265.2 0.37 - -
Indicated 586.7 - - 0.23 4,371.9 0.35 - -
Fenn-Gib Canada Indicated 40.8 - - 0.99 1,298.6 - - -
Whitney Canada Measured 1.0 - - 7.02 218.1 - - -
Indicated 2.3 - - 6.77 490.5 - - -
Gold River Canada Indicated 0.7 - - 5.29 117.4 - - -
Juby Canada Indicated 26.6 - - 1.28 1,094.7 - - -
Marlhill Canada Indicated 0.4 - - 4.52 57.4 - - -
Vogel Canada Indicated 2.2 - - 1.75 125.0 - - -
Total Gold Segment(4) 854.9 7 4.1 0.38 10,439.6 0.35 - -
Total Gold and Silver Segments (4) Measured + Indicated
1,038.8 122.8 797.0 0.38 10,634.9 0.30 0.82 1.21
(1) See table below entitled “Metal price assumptions used to estimate mineral reserves and resources as at June 30, 2019”.
(2) Mineral reserve estimates were prepared under the supervision of, or were reviewed by, Christopher Emerson, FAusIMM, Vice President Business Development and Geology and Martin G.
Wafforn, P.Eng., Senior Vice President Technical Services and Process Optimization, each of whom are Qualified Persons as that term is defined in National Instrument 43-101 (“NI 43-101).
(3) This information represents the portion of mineral reserves attributable to Pan American based on its ownership interest in the operating entity as indicated.
(4) Totals may not add up due to rounding. Total average grades of each element are with respect to those mines that produce the element.
Pan American Silver Mineral Reserve and Mineral Resource Information as at June 30, 2019Pan American Silver Inferred Resources1,2
Property Location Classification Tonnes (Mt) Ag (g/t) Contained Ag Au (g/t) Contained Au Cu (%) Pb (%) Zn (%)
(Moz) (koz)
Silver Segment
Huaron Peru Inferred 6.2 155 30.8 - - 0.41 1.45 2.77
Morococha (92.3%) (3) Peru Inferred 4.5 138 19.9 - - 0.37 1.02 3.26
La Colorada Mexico Inferred 8.1 133 34.5 0.12 31.6 - 2.03 4.01
Dolores Mexico Inferred 4.0 47 6.0 1.22 156.3 - - -
Manantial Espejo Argentina Inferred 0.5 194 3.0 2.71 41.4 - - -
San Vicente (95%) (3) Bolivia Inferred 3.0 289 27.9 - - 0.24 0.38 3.32
Navidad Argentina Inferred 45.9 81 119.4 - - 0.02 0.57 -
Joaquin Argentina Inferred 0.01 389 0.1 1.29 0.2 - - -
COSE Argentina Inferred 0.03 382 0.3 7.10 6.3 - - -
Escobal Guatemala Inferred 1.9 180 10.7 0.90 53.7 - 0.22 0.42
Total Silver Segment(4) 74.0 106 252.5 0.62 289.5 0.10 0.83 3.17
Gold Segment
La Bolsa Mexico Inferred 13.7 8 3.3 0.51 224.6 - - -
Pico Machay Peru Inferred 23.9 - - 0.58 445.7 - - -
La Arena Peru Inferred 1.1 - - 0.30 10.7 - - -
Shahuindo Peru Inferred 10.0 5 1.6 0.44 140.6 - - -
Shahuindo Sulphide Peru Inferred 97.4 14 45.1 0.74 2,323.3 - - -
Timmins Canada Inferred 3.7 - - 3.74 443.8 - - -
La Arena II Canada Inferred 91.6 - 0.23 683.1 0.17 - -
Fenn-Gib Canada Inferred 24.5 - 0.95 750.0 - - -
Whitney Canada Inferred 1.0 - 5.34 170.7 - - -
Gold River Canada Inferred 5.3 - 6.06 1,027.4 - - -
Juby Canada Inferred 96.2 - 0.94 2,908.8 - - -
Vogel Canada Inferred 1.5 - 3.60 168.8 - - -
Total Gold Segment(4) 369.8 13 50.0 0.78 9,297.6 0.17 - -
Total Gold and Silver Inferred
Segments (4) 443.8 48 302.5 0.78 9,587.1 0.14 0.83 3.17
(1) See table below entitled “Metal price assumptions used to estimate mineral reserves and resources as at June 30, 2019”.
(2) Mineral reserve estimates were prepared under the supervision of, or were reviewed by, Christopher Emerson, FAusIMM, Vice President Business Development and Geology and Martin G.
Wafforn, P.Eng., Senior Vice President Technical Services and Process Optimization, each of whom are Qualified Persons as that term is defined in National Instrument 43-101 (“NI 43-101).
(3) This information represents the portion of mineral reserves attributable to Pan American based on its ownership interest in the operating entity as indicated.
(4) Totals may not add up due to rounding. Total average grades of each element are with respect to those mines that produce the element.
Pan American Silver Mineral Reserve and Mineral Resource Information as at June 30, 2019You can also read