HOW TO HARNESS NEW GROWTH IN CPG DURING 2021 - Discovering Pockets of Demand December 14, 2020
←
→
Page content transcription
If your browser does not render page correctly, please read the page content below

Discovering Pockets of Demand

HOW TO HARNESS
NEW GROWTH IN CPG
DURING 2021

December 14, 2020
TODAY’S
                            PRESENTERS

 Krishnakumar (KK) Davey                        Nik Modi
President, Strategic Analytics    Managing Director – Beverages, Tobacco
             IRI                      and Household Personal Care
                                           RBC Capital Markets

                                           © 2020 Information Resources Inc. (IRI). Confidential and Proprietary.   2
SECTION 1
Level Setting –
Where We Are Now

                   © 2020 Information Resources Inc. (IRI). Confidential and Proprietary.   3
The U.S. is Experiencing Either Growing Case Counts
or Extremely High Numbers of New Cases

   Where New Cases Are
                                      WA
  Lower and Staying Low
                                                                                                                                                     ME
                                                      MT        ND
                                                                                                                                              VT
   Where New Cases Are           OR                                            MN                                                               NH
                                                                                          WI                                             NY
    Lower but Going Up                     ID                   SD                                                                              MA
                                                                                                           MI                                  CT         RI
                                                      WY

   Where New Cases Are                                                          IA                                              PA               NJ
                                                                 NE
  Higher but Decelerating             NV                                                                         OH
                                                                                               IL       IN                                      DE
                                                 UT                                                                       WV                   MD
                                                           CO                                                                       VA
                            CA
                                                                     KS             MO
   Where New Cases Are                                                                                          KY
  Higher and Staying High                                                                                                       NC
                                                                                                          TN
                                                AZ
                                                                          OK        AR
                                                       NM                                                                   SC

                                                                                               MS         AL         GA

                                                                 TX                  LA

                                                                                                                               FL

                                                                                                                          Source: New York Times, RBC Capital Markets
                                                                                                    © 2020 Information Resources Inc. (IRI). Confidential and Proprietary.   4
Most States Seem Determined to Avoid Reverting to Full Lockdowns, but Given the
Severity of Spread, Several States Are Bringing Back Various Forms of Restrictions
 Reopened / Reopening
                                  WA
                                                                                                                                                    ME
                                                            ND
       Pausing                                    MT
                                                                                                                                          VT
                             OR                                             MN                                                                 NH
                                       ID                                                  WI                                        NY
                                                            SD                                                                               MA
                                                                                                                                                         RI
      Re-Closing                                  WY                                                  MI                                    CT

                                                                                                                            PA
                                                                                 IA                                                                 NJ
                                                             NE
                                  NV                                                                          OH
                                                                                                IL   IN                                        DE
                                             UT                                                                       WV
                                                       CO                                                                       VA             MD
                        CA
                                                                  KS              MO
                                                                                                           KY

                                                                                                                            NC
                                                                                                      TN
                                            AZ
                                                                       OK             AR
                                                   NM                                                                   SC

                                                                                                MS    AL         GA

                                                                 TX                   LA

                                                                                                                           FL

                                                                                                                                     Source: New York Times, RBC Capital Markets
                                                                                                           © 2020 Information Resources Inc. (IRI). Confidential and Proprietary.   5
Unlike Past Recessions, the Current Market
Reflects An Unequal, K-Shaped Recovery Curve
                   Job Growth / Loss Since Recession Start
  1990 Recession      2001 Recession       2008 Recession                   2020 Coronavirus Crisis

 % chg. in Consumer Spending since COVID start         In the 2020 COVID-19 pandemic,
                                                       workers from hardest hit industries,
                                                       (e.g., travel, hospitality, foodservice,
                                                       entertainment), were among both
                                                       the lowest-earning households and
                                                       are also the most likely to have lost
                                                       jobs due to the pandemic.
                                                       Since the 2020 COVID-19
                                                       pandemic, the lowest earners
                                                       returned to pre-COVID-19
                                                       spending levels while higher
                                                       income reduced spending.

                                            Source: Washington Post “The COVID-19 recession is the most unequal in modern U.S. history” based on Labor Department via UIPUS.
                                                            Tracktherecovery.org based on consumer credit and debit card spending from Affinity Solutions. Updated as of 12/3/20.
                                                                                                              © 2020 Information Resources Inc. (IRI). Confidential and Proprietary.   6
Households Are Still Spending More On At-Home
Food While Other Expenses Are Reduced
U.S. HH Consumption Expenditures by Major Type of Product / Avg. Annualized $ per HH vs. YA
                                                 PRE-COVID-19                              MARCH - MAY 2020                               JUNE - AUGUST 2020                                  SEPT.-OCT. 2020
                                             Chg. vs. YA         % Chg. vs. YA                           Chg. vs. YA      % Chg. vs. YA                 Chg. vs. YA      % Chg. vs. YA                  Chg. vs. YA         % Chg. vs. YA

                                  Health         1,200                5%                              -3,612                -15%                        -605                   -3%                        -39                      0%
                Housing, utilities & fuels        833                 4%                                          795        4%                                  817           4%                                  768             4%
                              Recreation            552               6%                            1,840                   -19%                          487                  -5%                         111                     -1%
         Financial services & insurance              437              5%                                       147           2%                                  232           3%                                  198             2%
                          Food services              269              4%                         2,154                      -33%                        931                   -14%                        606                      -9%
Food and bev. purchased for off-premise               214             3%                                    1,242            16%                                 877           11%                                 873            11%
HH furnishings, equipment maintenance                 192             4%                            150                      -3%                                  406          9%                                     487         10%
                          Transportation              173             2%                   3,203                            -31%                     1,474                    -14%                      1,002                     -10%
                               Education              94              4%                     151                             -6%                       181                     -7%                        233                     -10%
                                 Clothing              73             2%                1,128                               -35%                      307                      -9%                           82                    -3%
                        Communication                  42             2%                    54                               -2%                          3                    0%                                 24               1%
                       Accommodations                  39             3%                816                                 -67%                    730                       -60%                      652                       -54%
                                 All other                 354        5%          1,445                                     -21%                  899                         -12%                     747                        -10%
                        Total HH spend                     4,471                 -12,370                                                       -3,287                                              -1,121

 Total HH spend % chg. vs. YA                4.1%                                                  -9.6%                                                -2.7%                                                     -0.7%

                                                             Source: BEA, based on seasonally adjusted annualized monthly figures through Oct 2020. Assumes constant number of households in US (128.58M). IRI analysis.
                                                                                                                                                      © 2020 Information Resources Inc. (IRI). Confidential and Proprietary.         7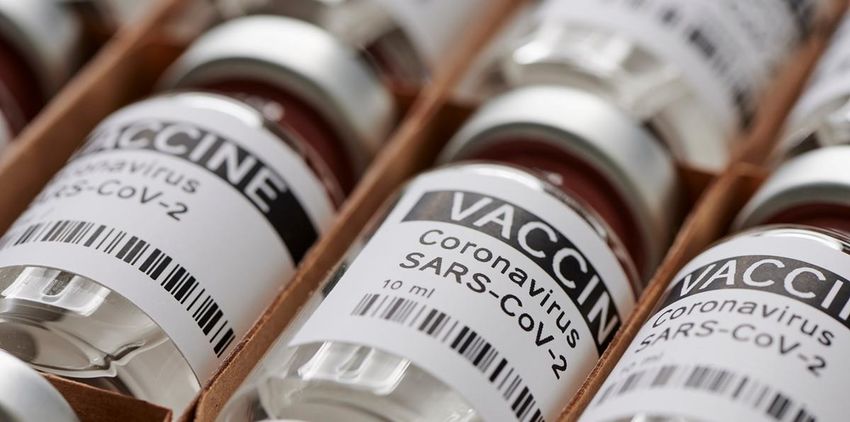
Restaurant Industry Performance is Reverting
Downwards in Recent Months, With More Stores Closed
IRI Restaurant Dollar Sales % Change vs. YA                                                      Total US Casual & Upscale Restaurants                         Casual            Upscale

      % Chg vs 2019      10
                          0
                         -10                                                                                                                                     Steadily declining weekly
                         -20                                 Post-COVID open restaurants peaked in                                                               performance since
                                                             June at 75%, dropping to 66% in November,                                                           beginning of October
                         -30
                                                             with many permanently closing
                         -40
                         -50
                         -60
                         -70                                                                                                   Limited service restaurant sales
                                                                                                                               grew 3.6% in August –October
                         -80
                                                                                                                               while Full service declined2
                         -90
                        -100
                               Jan   Feb   Mar    Apr              May                Jun                 Jul                Aug                  Sep                 Oct                Nov

Total U.S. Food at Home (FAH) vs. Food Away From Home (FAFH) Sales Index 1
Away From Home % of
          Total Food
                               51%   52%   40%     34%            39%                 45%                45%                 46%                 46%                  n/a                n/a
                                                 Index to Prior Year Monthly Average
Food Away From Home             94    95    76      50           68           81                           85                88                    85                 n/a                n/a
       Food At Home             98    95   119      104          112         107                          111                109                  104                 n/a                n/a
                Total           96    95    97      76           89           94                           98                98                    94                 n/a                n/a

                                                                    1. FAFH vs. FAH based on USDA Monthly Sales of Food with taxes & tips; Includes food sales across store types.
                                                         2. BEA Personal Consumption Expenditures. Source: IRI On-Premise Tracking Model, based on dollars per benchmark venue.
                                                                                                                © 2020 Information Resources Inc. (IRI). Confidential and Proprietary.         8
61% of Restaurants and Several Businesses
Marked Closed on Yelp That Were Open March
10% to 20% of Restaurants Are Expected to Close Permanently in 2020

 32,109 Total Closures      30,374
  61%                        58%
  Permanent Closures                                  16,585

                                                        42%
                                                                                       6,451                             6,024

                             42%                        58%                               54%                               43%
  39%
  Temporary Closures
                                                                                          46%                               57%

         Restaurants            Shopping & Retail        Beauty & Spas               Bars & Nightlife                          Fitness

                                                                                                       Source: Yelp, Technomic, RBC
                                                                  © 2020 Information Resources Inc. (IRI). Confidential and Proprietary.   9
The Food Industry Will Effectively Orphan ~$70B of Annualized
Spending on a Go-Forward Basis, Just From Closures
Estimates 2020 Restaurant Industry Sales and Orphaned Spending
(Annualized Due to Restaurant Closures)

       $578
                         $47B
                       Orphaned
                       Spending
                                          $68B
                                        Orphaned
                        $531            Spending
                                                           $95B
                                          $510           Orphaned
                                                         Spending

                                                           $483

   2019 Restaurant     2020E Best       2020E Best       2020E Worst
    Industry Sales     Case Sales       Case Sales        Case Sales
                        Scenario         Scenario          Scenario
                     (10% Closures)   (15% Closures)   (20% Closures)

                                                                                                   Source: Technomic, RBC Capital Markets
                                                                        © 2020 Information Resources Inc. (IRI). Confidential and Proprietary.   10
In the Near-Term, RBC Estimates $35B of Orphaned
Restaurant Spend is Up for Grabs for Grocers
Estimated Benefit to Grocery Sales and Surviving Restaurants ($B)
6.4% of Total Grocery
Product Sales in 2019
$34 $34
Restaurants Grocery
Source: RBC Capital Markets
© 2020 Information Resources Inc. (IRI). Confidential and Proprietary. 11Some Retailers Are Likely to Benefit More
From Restaurant Closures Than Others
% of Stores in the Top 15 Hardest-Hit States for Business Closures
80%
66%
48% 47%
44%
39%
28%
Source: Yelp
© 2020 Information Resources Inc. (IRI). Confidential and Proprietary. 12CPG Sales Growth Remains Elevated
F&B and Non-Edible % Change vs. Year Ago Dollar Sales Volume Sales1
Total Omnichannel (MULO + C + Costco + eCom)
8 w/e 4 w/e 4 w/e 4 w/e 4 w/e 4 w/e 4 w/e 4 w/e 4 w/e 4 w/e 4 w/e
2.23.20 3.22.20 4.19.20 5.17.20 6.14.20 7.12.20 8.9.20 9.6.20 10.4.20 11.1.20 11.29.20
31 30 more promo
22
17 16 15 15 14
13 12 12 12 12 9
8 7 7 6 7 7
F&B 2 1
29
25 slight re-stockpiling in paper products
18
11 14 13 12 11 13 11
9 8 7 6 9 8 7
5 6 4 6
Nonedible 2
1. Estimated average omnichannel volume change across categories based on price/mix trends in MULO+C.
Source: IRI data ending 11/29/20. Omnichannel based on IRI MULO+C POS, IRI eMarket Insights and IRI Consumer Panel for Costco.
© 2020 Information Resources Inc. (IRI). Confidential and Proprietary. 132020 Has Seen Unprecedented Growth
80%
and Volatility in Many Categories
% of Categories by Difference in L24W $ Growth vs. YA vs.
2017-19 CAGR / Total IRI Omnichannel, % Change vs. YA of Categories
24 Are Experiencing
Growth of
18
15 More than
+5
14 14
10
5 percentage
points vs.
Typical Growth
25 ppts.
SAMPLE CATEGORIES
Cold / Cough Pet Food Salty Snacks Beer Coffee Vitamins Pet Supplies
Gum Baby Food Yogurt CSD Natural Paper Soap
Snack Bars Candy Milk Cheese Towels Household
Energy Toilet Paper Hand Lotion Cleaner
Drinks Shampoo
Note: Omnichannel defined as MULO + Convenience + Costco + eCommerce. Source: IRI POS, eMarket Insights and Consumer Panel, data ending 11/1/20.
© 2020 Information Resources Inc. (IRI). Confidential and Proprietary. 14SECTION 2
Where We Stand
On a Vaccine
© 2020 Information Resources Inc. (IRI). Confidential and Proprietary. 15Vaccine Development Headlines Have Been Positive, With
Multiple Vaccine Candidates Reporting High Efficacy Results
Source: Nature, New York Times, Fierce BioTech
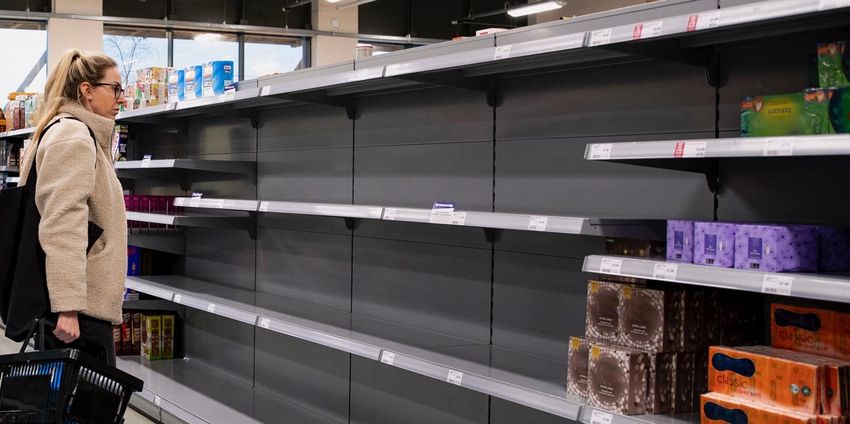
© 2020 Information Resources Inc. (IRI). Confidential and Proprietary. 16But Challenges Remain, Particularly Around Manufacturing,
Storage, Logistics, Distribution, and Administration
Source: Science News, Fierce Pharma, Reuters, NPR, Freight Waves, Vox
© 2020 Information Resources Inc. (IRI). Confidential and Proprietary. 17The CDC’s Vaccine Distribution Playbook Warns of Shortages and
Limited Availability for the Vaccine in the Early Months of Distribution
The COVID-19 Vaccination Program Will Require a Phased Approach
*Planning should consider
that there may be initial age
restrictions for vaccine
products.
**See Section 4: Critical
Populations for information
on Phase 1 subset and other
critical population groups.
Source: US Centers for Disease Control
© 2020 Information Resources Inc. (IRI). Confidential and Proprietary. 18Despite Rising Cases of COVID-19, More than Half the Population
Remains Unsure or Not Interested in a Vaccine (as of Mid-November)
Males, Older, High Income and Urban Consumers Are Far More Interested in Getting
the Vaccine as Soon as it is Available
Q: Do you plan to get a COVID-19
vaccine once it is available?
9.3%
Yes, but I will likely wait at least 6 months
after it is available to me before I get it
17.9% 24.2%
Yes, but I will likely wait a Not planning to get it
few months after it is
available before I get it
20.5% 28.1%
Yes, I plan to get it as soon Not sure yet
as it is available to me
Source: IRI Survey fielded 11/13-15 among National Consumer Panel representing Total US Primary Grocery Shoppers; base 991
© 2020 Information Resources Inc. (IRI). Confidential and Proprietary. 19SECTION 3
Looking Ahead
© 2020 Information Resources Inc. (IRI). Confidential and Proprietary. 20Here’s Our Best Guess at How the Next 8 – 12 Months Will Play Out…
Potential Vaccine Adoption Timeline Potential Mobility Scenarios
MAR – APR 2021 JUL – SEP 2021
Case counts begin to decline Case counts decline 10 ACTUAL FORECAST
Phase 2 vaccine distribution Some of the population is not
0
(high-risk persons, early vaccinated
education, food & agriculture,
sanitation, public works, etc.) Need ~75% for herd immunity -10
-20
-30
DEC’20 – FEB’21 MAY – JUN 2021 SEP 2021+
Case counts continue to rise. Vaccine becomes available Several months for the side -40
for everyone effects to manifest. Optimistic Scenario
Some form of stimulus likely Conservative Scenario
-50
Adoption curve? Herd immunity begins.
Phase 1 vaccine distribution
(front-line workers) Cases continue to decline Consumers begin to resume to -60
6/8/2020
10/8/2020
11/8/2020
12/8/2020
2/8/2021
10/8/2021
11/8/2021
12/8/2021
5/8/2022
3/8/2020
4/8/2020
5/8/2020
7/8/2020
8/8/2020
9/8/2020
1/8/2021
3/8/2021
4/8/2021
5/8/2021
6/8/2021
7/8/2021
8/8/2021
9/8/2021
1/8/2022
2/8/2022
3/8/2022
4/8/2022
6/8/2022
some sense of normalcy, though
certain habits are changed at
least through the near-term
Source: RBC Capital Markets; Google Workplace Mobility, Mobility forecasts represent IRI Strategic Analytics POV.
© 2020 Information Resources Inc. (IRI). Confidential and Proprietary. 21IRI 2021 Forecasts Based Quantifying Demand Drivers for
Frozen
Hundreds of Categories Across the Store
General Food Nonedible Dairy, Eggs & Cheese Dairy / Eggs / Cheese
• Salty Snacks • Toilet Tissue • Milk
• Bottled Water • Vitamins • Natural Cheese Beverage
• Candy • Laundry Care • Creamer Alcohol
• Coffee • Paper Products • Butter / Blends Refrigerated
• Soup • Food Storage • Yogurt
• Cookies & • Household • Non-Dairy
Crackers Cleaners Alternatives
• Condiments • Personal Care Bakery Deli / Prepared
• Spices / • Cosmetics • Fresh
Seasonings Bread
• Snacks / Granola Frozen & Rolls
Bars • Dinners / • Pastry /
• Pasta Entrées Donuts Meat
• Rice • Ice Cream /
• Beans Novelties Meat
• Baking Needs • Seafood • Breakfast Meat
• Canned Goods • Pizza Bakery
• Luncheon Meat
• Meat • Plant-based Meat
Refrigerated • Poultry
• Juice / Drinks • Potatoes Beverage Alcohol
• Dough • Vegetables Produce
• Wine
• RFG Condiments • Fruit • Liquor
• Side Dishes • Beer
DEMAND FORECASTING WITH 100S OF CAUSAL CONTROLLABLE General Food
DRIVERS (E.G., ASSORTMENT, PRICING) AND UNCONTROLLABLE
DRIVERS (E.G., MACRO ECONOMIC, COVID-19 MOBILITY)
© 2020 Information Resources Inc. (IRI). Confidential and Proprietary. 22Highly impacted by
consumer mobility, 2021
CPG performance will vary
Anticipate Moderate Growth for in 2021 with COVID-19 vaccine
availability to general
Total CPG Omnichannel Dollar Sales Growth Optimistic Scenario population, with earlier
Forecast / % Change vs. YA / Median Forecast Conservative Scenario distribution increasing
mobility and driving
EDIBLE more consumption away-
from-home.
15.6 20
12.4
10.1 Slowing economic
10
3.0 recovery
0 and smaller stimulus will
impact growth and could
-2.8
-4.8 -10 potentially lead to
shopping more for value.
NONEDIBLE
15.4
13.2 14.3 20 CPG pricing is likely to
3.5 moderate due to more
10
promotions, better
2019 2020 0
-1.0 availability and more
vs. 2018 vs. 2019 -1.9 -10 intense competition.
2021 (Median 2021 (Median
Forecast vs. 2020) Forecast) vs. 2019
Forecast error range +/- 2%
Note: Omnichannel includes MULO + C + Costco + E-comm. 2020 = data ending 11/8/20, forecast for remainder of year,. E-commerce includes Click and Collect and Pure Play
Source: IRI POS, eMarket Insights and Consumer Panel IRI Strategic Analytics, Proprietary forecasting methodology
© 2020 Information Resources Inc. (IRI). Confidential and Proprietary. 23Many Categories Will Decline in 2021,
Lapping Spikes in 2020 2019 vs. 2018:
65% of categories
grew 20%
2021 (F) vs. 2020:
65% 68% 65% 75% 65% of categories
45 will decline
39
36 2021 (F) vs. 2019:
29 29 75% of categories
19 25 will grow >5%
23
17 23
16
13 12 12 Categories minimally or
6 6 7 4 5 negatively impacted by
8 4
3 3 1 1 3 3 2 3 4 reduced consumer
1 1
mobility (e.g., candy,
2019 2020 2021 (Median 2021 (Median cosmetics) will likely
vs. 2018 vs. 2019 Forecast Forecast) see growth in 2021.
vs. 2020) vs. 2019
Forecast error range +/- 2%
Note: Omnichannel includes MULO + C + Costco + E-comm. 2020 based on data ending 11/8/20 and forecast for remainder of year. 2021 forecast
based on June 2021 COVID-19 vaccine assumption. Source: IRI Strategic Analytics, Proprietary forecasting methodology.
© 2020 Information Resources Inc. (IRI). Confidential and Proprietary. 24With COVID-19, Category Demand Is Determined by
Uncontrolled External Drivers, Reversing Prior Year Trends
% of Category Dollar Growth vs. YA Explained by Variable Type
External drivers are accounting Distribution is more important
for ~70% of sales growth. than price among controllable drivers.
Other
External 7.3%
External 27.4%
Macro 20.1% COVID-19/
Consumer
56.4% 55.7% Mobility
70.0% 66.5%
Distribution 44.2%
4.3% 5.2%
Controllable 72.6% 5.5%
9.3%
18.4% 23.5%
30.0% 33.5%
Price 28.4%
11.6% 10.0%
2015-19 2020 2021* 2015-19 2020 2021*
Source: IRI Strategic Analytics, Proprietary forecasting methodology / *2021 assumes access to vaccination by mid to late 2021
© 2020 Information Resources Inc. (IRI). Confidential and Proprietary. 25In Contrast to Other Channels, E-Commerce Will Continue to
Grow Regardless of the Vaccine Availability Scenarios in 2021
Total CPG % Change vs. YA Optimistic Scenario
Conservative Scenario
2019 2020 2021 (Median 2021 (Median
vs. 2018 vs. 2019 Forecast vs. 2020) Forecast vs. 2019)
Total -3.7 11.0
3.2 15.5 -2.1
Omnichannel 13.1
MULO -7.7 3.2
1.3 11.5 -10.3
Brick & Mortar 0.3
Grocery -11.0 3.5
1.0 16.3
Brick & Mortar -12.7 1.5
11.9 92.0
E-Commerce1 22.0 58.6
31.5 125.5
1.1 3.3
Convenience 3.4 2.9
0.3 4.1
Forecast error range +/- 2%
Note: Omnichannel includes MULO + C + Costco + E-comm. 2020 = data ending 11/8/20, forecast for remainder of year. Source: IRI POS, eMarket Insights and Consumer Panel IRI Strategic Analytics, Proprietary forecasting methodology
1. E-commerce data includes eCommerce of MULO and Grocery as well as pure plays
© 2020 Information Resources Inc. (IRI). Confidential and Proprietary. 26E-Commerce Will Continue to Gain Share in 2021 A large proportion of e-
as Investments in This Channel Accelerate commerce spending
(buyers and baskets) will
E-Commerce Dollar Share of Omnichannel Optimistic Scenario
stick for many as
Conservative Scenario
purchase habits take
hold.
Edible Nonedible
National players
(e.g., Amazon, Walmart,
25.3- Instacart, Target, national
25.1 24.1 29.2
grocery, specialty pet and
22.5 22.9
19.7 beauty retailers) will
15.9 continue to invest more
8.0- in infrastructure
9.2 improvements
7.4 6.7 6.9 6.5 (e.g., technology, staffing,
5.0
4.1 fulfillment space) and
engage consumers in
subscription models,
2019 Q1 Q2 Q3 Q4TD 2020 2021 2019 Q1 Q2 Q3 Q4TD 2020 2021
2020 2020 2020 2020 Median Median 2020 2020 2020 2020 Median Median driving further growth.
Forecast Forecast ForecastForecast
Source: IRI POS, eMarket Insights and Consumer Panel , MULO + C+ Ecommerce+ Costco ending 11/01/20.
E-Commerce share of Omnichannel based on 204 IRI tracked CPG categories, estimates for untracked CPG categories, channels. E-Commerce includes MULO and Pure Play, IRI analysis.
© 2020 Information Resources Inc. (IRI). Confidential and Proprietary. 27Mobility Changes the Impact of Millennials’ and
Higher Income Households’ CPG Spend Most
Consumer Cohorts Most Impacted by Consumer Mobility
% Change in Total CPG Dollar Growth Associated with 10% Decrease in Mobility 1,2
Cohort differences driven by at-home vs. away-from-home
6.7
consumption: High income and younger cohorts shift more spend
to/from away-from-home consumption as mobility factors change
6.4
6.1 6.1
5.9 5.9
5.8
5.5 5.6 Ø 5.7
5.5
5.3
5.1
5.0
5.0 4.9
Generation Gen Z Millennials Gen X Boomers Seniors
Income Low Middle High Low Middle High Low Middle High Low Middle High Low Middle High
1. Based on linear relationship, excluding other factors.
Sources: IRI Strategic Analytics, Proprietary methodology for mobility elasticity. Based on IRI Shopper Loyalty data for 6.5M static households regularly shopping Grocery channel.
© 2020 Information Resources Inc. (IRI). Confidential and Proprietary. 28Looking Ahead, CPG Players Will Need to Find
2021 Growth Opportunities
Attractive Pockets of Demand to Drive Growth
• Nimbleness is critical as we face economic
and continued COVID-19- related uncertainty in
Lifestyle / Consumption Shifts 2021.
New consumer needs across in-home consumption • Seize new in-store vaccination opportunities
occasions (e.g., prepared meals, new flavors / variety)
in H1’21 by tailoring offers
Economic Bifurcation • Strategically leverage assortment, pricing
Both premium / super premium and value and promotion by channel to enhance growth.
opportunities growing in the K-shaped economic recovery
• Deliver solutions and assortments that will retain
Valuable Cohorts Millennial and high-income households that
Different behavioral patterns across cohorts are most likely to increase away-from-home
(e.g., upper income, Millennials, Gen X) spending as mobility restrictions ease.
Special Occasions • Work to be part of the limited consideration set of
Holiday and celebration patterns shift Boomers and Seniors who are most likely to
retain restricted shopping behaviors.
Channel Shifting • Focus on strong distribution in winning
Online, grocery, club and dollar channels gain share of wallet channels and ensure products are physically
available where shoppers are.
Shopping Behavioral Shifts
Shoppers buy larger baskets, spend less time in store • Commit to personalization at scale; use
and assortments shrink targeted marketing to drive new usage occasions.
© 2020 Information Resources Inc. (IRI). Confidential and Proprietary. 29SECTION 4
Thinking Out Loud
© 2020 Information Resources Inc. (IRI). Confidential and Proprietary. 30© 2020 Information Resources Inc. (IRI). Confidential and Proprietary. 31
On Average, it Takes 66 Days to Form a Habit;
in an Extreme Case it Could Take Up to 254 Days

         HOW LONG DOES IT TAKE TO FORM A HABIT?

             18 • 66 • 254
              minimum        average             maximum

                                                                        Source: Healthline; RBC Capital Markets
                                             © 2020 Information Resources Inc. (IRI). Confidential and Proprietary.   32
Many Companies Instituted a
Work-from-Home Policy as of March
Which means as of today, we have been
working and spending more time in home for:
254 Days
© 2020 Information Resources Inc. (IRI). Confidential and Proprietary. 33254 Days + Counting at Home:
Two Resulting Consequences
Even More A More
Reluctance to Hybridized
Go Out Work Schedule
Source: Google Images, RBC Capital Markets
© 2020 Information Resources Inc. (IRI). Confidential and Proprietary. 34Keep in Mind, Consumers Have Invested in Their Homes /
Backyards, So They Increasingly Will Want to Spend Time There
HD Organic Sales Growth Y/Y
30%
HD Organic Sales Growth
25% 2-Year Average
20%
15%
10%
5%
0%
Dec-17
Dec-18
Dec-19
Sep-16
Sep-17
Sep-18
Sep-19
Sep-20
Mar-16
Mar-16
Mar-17
Mar-18
Mar-19
Mar-20
Jun-16
Jun-17
Jun-18
Jun-19
Jun-20
Source: Company Filings, RBC Capital Markets
© 2020 Information Resources Inc. (IRI). Confidential and Proprietary. 35Many Young Adults Are Also Moving Back in
With Their Parents Due to COVID-19 Disruptions
According to Pew Research Center, the Percentage of Young Adults Living
With Their Parents Has Risen to Levels Last Seen in The Great Depression
% of 18- to 29-year-olds in U.S. living with a parent 52
July
2020
48
42 43 44
41 40
36 38 47 Feb.
35
31 32 2020
29
1900 1910 1920 1930 1940 1950 1960 1970 1980 1990 2000 2010 2020
Decennial Census Annual Averages
Source: Pew Research Center
© 2020 Information Resources Inc. (IRI). Confidential and Proprietary. 36© 2020 Information Resources Inc. (IRI). Confidential and Proprietary. 37
© 2020 Information Resources Inc. (IRI). Confidential and Proprietary. 38
How many people do you
think attended this virtual
Travis Scott concert?

                                                                           Source: Google Images
                              © 2020 Information Resources Inc. (IRI). Confidential and Proprietary.   39
Something You Never Heard of Had 12.3M Live Attendees –
More Than Half as Much Viewership as the 2019 NBA Finals
Capacity / Attendance / Viewership
2019 Superbowl Viewership 100,700,000
Mayweather/McGregor Viewership 50,000,000
2016 Olympics U.S. Viewership 26,500,000
Thanksgiving Day Parade Viewership 23,700,000
2019 NBA Finals Viewership 20,500,000
Travis Scott Virtual Concert Attendance 12,300,000
The Last Dance Viewership 6,100,000
Boston Marathon Viewership 1,200,000
Woodstock Attendance 400,000
MetLife Stadium Capacity 82,500
MSG Capacity 20,789
Source: Wikipedia, MobileMarketer, RBC Capital Markets
© 2020 Information Resources Inc. (IRI). Confidential and Proprietary. 40© 2020 Information Resources Inc. (IRI). Confidential and Proprietary. 41
Consumer’s Desire for Unique and Relevant Products
Will Only Increase in the Future
CPGs Need to Rethink Resource Allocation, Perhaps Outsourcing More of Their Production and Distribution and Migrating
Those Dollars Toward Creating Truly New-to-the-World Products and Technologies.

                           Percentage of Global Research and Development Spend by Industry (2018)
              Computer and Electronics                                                                             22.5%

                            Healthcare                                                                         21.7%

                                  Auto                                             16.0%

                  Software and Internet                                            15.7%

                             Industrials                             10.6%

                 Chemicals and Energy                   4.1%

                            Consumer                   3.2%
              Aerospace and Defenses               2.8%

                                 Other

                              Telecom           1.5%

                                           0%           5%     10%           15%                20%                      25%

                                                                                                                   Source: Statista, RBC Capital Markets
                                                                                     © 2020 Information Resources Inc. (IRI). Confidential and Proprietary.   42
© 2020 Information Resources Inc. (IRI). Confidential and Proprietary. 43
© 2020 Information Resources Inc. (IRI). Confidential and Proprietary. 44
Predictive Reaction and Levers We Can Influence

              Let’s go back.                             We have to change…

                                              35%
              The facts.                                                 The feels.
     • Focused on facts.                65%           • Focused on experiences.
     • Decide on rational factors                     • Decide on sensory, emotional
       (time, convenience,                              factors (5 senses, pleasure).
       functional performance).                       • More worried about the
     • More worried about the virus.                    economy // culture.
     • Inclined to revert to previous                 • Inclined to embrace new
       behaviors & routines.                            behaviors & routines.

                                                                                                      Source: Thriveplan
                                                    © 2020 Information Resources Inc. (IRI). Confidential and Proprietary.   45
Source: Thriveplan © 2020 Information Resources Inc. (IRI). Confidential and Proprietary. 46
Facts vs. Experiences
“We recently started buying a lot more soup…”

               Let’s go back.                              We have to change…

                                                35%
                                        65%
             “It’s a quick,                                          “I’ve actually
           simple way to get                                       enjoyed making
              something                                               meals and
            wholesome on                                            learning some
              the table.”                                           new recipes.”

                                                                                                        Source: Thriveplan
                                                      © 2020 Information Resources Inc. (IRI). Confidential and Proprietary.   47
Why E-Commerce
“It seems like I get an Amazon delivery every day…”
Let’s go back. We have to change…
35%
65%
“I like how it
“It’s convenient suggests things
and safe relative based on my
to virus purchase history –
exposure.” and even TV shows
I might like!”
Source: Thriveplan
© 2020 Information Resources Inc. (IRI). Confidential and Proprietary. 48REGISTER
HERE
Psyched Out? Getting a Grip on Consumer Behavior
Please Join RBC Capital Markets, in Partnership with Alpha-Diver (Formerly Thriveplan)
for a Unique Consumer Symposium on Tuesday, December 15th 2:00 – 3:00 PM (EST)
The Panel Will Focus on a Variety Featured Speakers
of Topics and Perspectives: – Paco Underhill, Founder of consulting firm, Envirosell Inc., and
• The current issues we see with how CPG companies author of popular books including Why We Buy: The Science of
Shopping.
are dealing with the existing, challenging environment
– Priscilla McKinney, CEO of Little Bird Marketing, an award-winning
• Viewpoints on the ways brand leaders can be truly
agency specializing in content marketing, lead generation, branding
become “consumer-centric” to leverage today’s state
and design. Priscilla is a popular keynote speaker, industry innovator,
of affairs and host of the podcast Ponderings from the Perch, with over 200
• Understanding of durable, and predictable consumer episodes and thousands of annual downloads.
behaviors in the months ahead, guided by modeling – T. Sigi Hale PhD, Principal Neuroscientist /Director of Research at
from the world of neuropsychology the insights and strategy firm, Alpha-Diver. Sigi is the scientific
• Tangible actions companies can take to thrive during architect of The 9 WHY’s insights model – which reveals & measures
and after the pandemic the subconscious drivers & barriers that explain consumer behavior,
and is applied regularly by Fortune 100 brands to dramatically elevate
effectiveness in marketing strategy & activation
© 2020 Information Resources Inc. (IRI). Confidential and Proprietary. 49Summing Up: Five Layer Framework on Go-Forward CPG Consumption
SOCIETAL
History would suggest that changes in the way we work, live, and play have the single-biggest impact on how we behave and interact with food. Our
study takes a look at the evolution of eating patterns going back to the 1920s to provide some context on how changes occurring due to COVID-19
could impact future behaviors.
EDUCATION
A global survey found that almost half of all respondents chose ready-to-eat meals versus preparing a meal from scratch due to not knowing how to
cook, lack of confidence in cooking skills, or a dislike for cooking—on par with a lack of time. Even schools have substantially scaled back student
access to “home economics” where cooking was a central part of the curriculum. We believe the proliferation of “education centers” for food
preparation (Facebook, Instagram, Google, YouTube, etc.) over the past 10 years has eliminated one of the biggest barriers to cooking at home.
RECESSIONARY EFFECTS
Interestingly, economic downturns of the past have not created a significant surge in demand for package food categories. We believe future recessions
will have a more positive impact on package food consumption. Importantly, we believe the purchasing patterns over the past several weeks have
provided: 1) some transparency into how much it costs to make a meal at home versus eating out; and 2) practice in preparing meals.
UNPRECEDENTED TRIAL
Pantry loading and more at-home consumption have created a trial surge that most observers thought we would never see. Importantly, big brands
have fared very well due to a combination of supply-chain strength, brand recognition and consumers migrating to comfort/things with which they are
familiar. Importantly, many packaged food companies have “leaned into” trial, which should create a decent amount of repeat.
ONLINE MIGRATION
We believe the ramp in online grocery shopping over the past 3 months has created an advantage for “Big Food”. In many instances, the largest
brands tend to dominate on the first page of any eCommerce portal. Importantly, Numerator data suggests consumers that purchase online tend to be
more brand loyal than consumers shopping in a brick-and-mortar environment.
© 2020 Information Resources Inc. (IRI). Confidential and Proprietary. 50© 2020 Information Resources Inc. (IRI). Confidential and Proprietary. 51
CONTACT US
                            for More Information

     Krishnakumar (KK) Davey                                      Nik Modi
         IRI Global Headquarters             RBC Capital Markets | Equity Research
150 N. Clinton St., Chicago, IL 60661-1416   200 Vesey Street | New York, NY 10281
 Krishnakumar.Davey@IRIworldwide.com                 nik.modi@rbccm.com
             +1 732.713.3446                            +1 212.905.5993

                                                    © 2020 Information Resources Inc. (IRI). Confidential and Proprietary.   52
Mark Clouse Stuart Aitken Vivek Sankaran
President and CEO, Campbell Soup Company Chief Merchant & Marketing Officer, The Kroger Co. President & CEO, Albertsons Companies
November 10, 2020 September 3, 2020 August 25, 2020
© 2020 Information Resources Inc. (IRI). Confidential and Proprietary. 53IRI COVID-19 IMPACT ASSESSMENT REPORTS (click to see full report)
COVID-19: THE CHANGING SHAPE OF THE CPG DEMAND CURVE
SPECIAL COVID-19 SERIES: RECESSION PROOF YOUR BUSINESS
COVID-19 EMERGING POINT OF VIEW DISCOVERING POCKETS OF DEMAND
© 2020 Information Resources Inc. (IRI). Confidential and Proprietary. 54CPG Economic Indicators
Access IRI’s industry-standard metrics for consumer product demand and supply
during the pandemic, our CPG inflation tracker and the latest data on category
trends, out-of-stock levels, consumer sentiment and more.
U.S. Demand Channel Shift E-Commerce
Demand Index™
Index™ Forecasts Index™ Demand Index™
Inflation Out-of-Stock Levels U.S. Topics from
Supply Index™
Tracker™ for Subcategories IRI Social Pulse™
The IRI CPG Demand Index™ provides a standard metric for tracking
changes in spending on consumer packaged goods.
U.S. Demand Index™ Forecasts are delivered through a proprietary,
fully automated forecasting solution that anticipates consumer demand.
Channel Shift Index™ provides a standard metric for tracking changes (migration)
in spending on consumer packaged goods across select channels.
The IRI E-Commerce Demand Index™ provides a standard metric for tracking changes
in spending on consumer packaged goods purchased online.
Inflation Tracker™ provides the well-known price per unit metric for tracking changes in pricing of consumer packaged goods.
Supply Index™ provides a standard metric for tracking changes in product availability (i.e., in-stock rates) in stores for consumer packaged goods.
Out-of-Stock Levels for Top-Selling Subcategories by Market Area in the U.S.
Top U.S. Topics from IRI Social Pulse™
© 2020 Information Resources Inc. (IRI). Confidential and Proprietary. 55Want to Be the First to Know?
www.iriworldwide.com/en-US/Insights/Subscribe
Registered Users Get New Thought Leadership
from IRI’s Research, Data & Analytics Experts
© 2020 Information Resources Inc. (IRI). Confidential and Proprietary. 56You can also read