THE IMPACT OF COVID-19 ON THE ARTISANAL MINING SECTOR IN EASTERN DEMOCRATIC REPUBLIC OF THE CONGO - IPIS insights
←
→
Page content transcription
If your browser does not render page correctly, please read the page content below
IPIS insights

THE IMPACT OF COVID-19 ON THE
ARTISANAL MINING SECTOR IN
EASTERN DEMOCRATIC REPUBLIC
OF THE CONGO
The impact of Covid-19 on the artisanal mining sector in eastern Democratic Republic of the
Congo
Antwerp, September 2020
Authors: Ken Matthysen, Lotte Hoex, Thomas Muller, Guillaume de Brier
Researchers: Ken Matthysen, Guillaume de Brier, Zacharie Bulakali, Augustin Djamugisa Bedidjo, Edgar
Kakule Kamaliro, Guillaume Ntangamyampi Alininyu, Jibrown Nabyenda Bengehya, Anyasi Kitoko
Beauvalot, Lavoisier Lukindula Assumani, Prosper Tumba Wangozi, Bertin Nyamuhirwa Muganuza
Data analysis: Thomas Muller
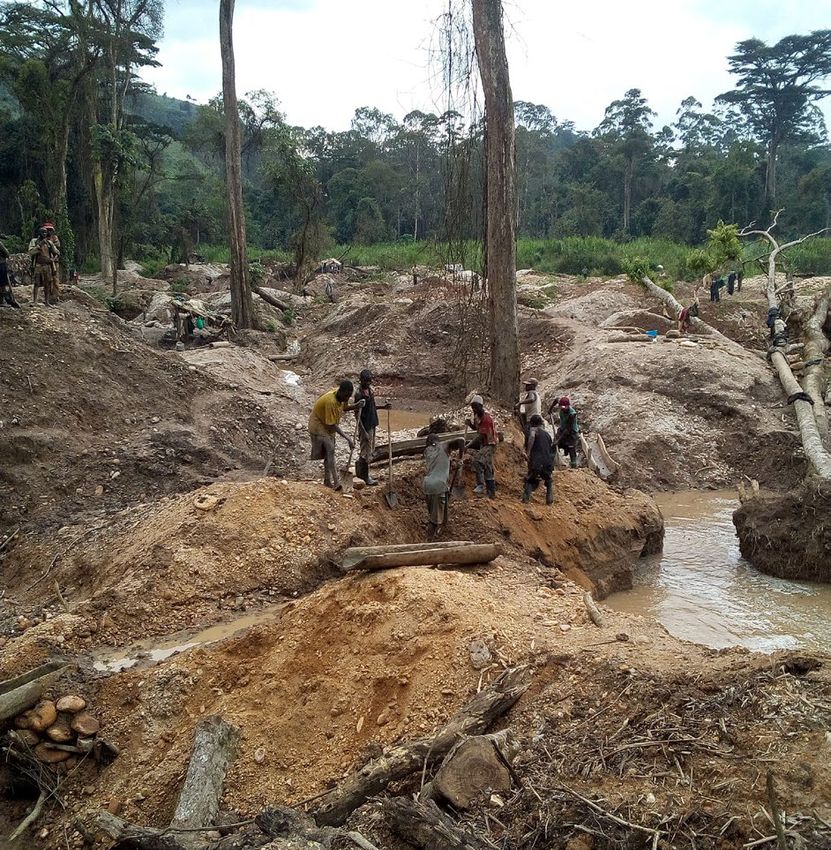
Cover picture: Mining site Lwate, Lubero territory
To quote this report, please use the following reference:
Matthysen, K., Hoex, L., Muller, T., de Brier, G. The impact of Covid-19 on the artisanal mining sector in eastern
Democratic Republic of the Congo, IPIS, September 2020.
D/2020/4320/11
This document has been produced with the financial assistance of the European Union.
The contents of this document are the sole responsibility of the authors and can under
no circumstances be regarded as reflecting the position of the European Union.
2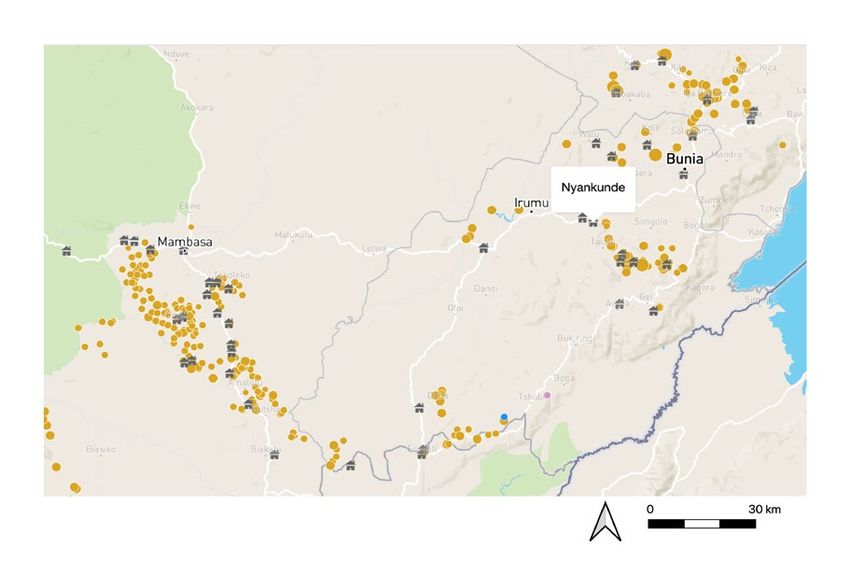
TABLE OF CONTENTS
1. Introduction...................................................................................................................................... 4

2. Covid-19 in eastern DRC................................................................................................................... 5
    2.1. The arrival of Covid-19 in DRC..............................................................................................................................5
    2.2. Sanitary measures.....................................................................................................................................................5
    2.3. Disruption of mineral trade...................................................................................................................................6

3. Methodology.................................................................................................................................... 7

4. Mineral trade.................................................................................................................................... 9
    4.1.      Number of mineral traders....................................................................................................................................9

5. Mineral prices..................................................................................................................................11
    5.1.      Gold.............................................................................................................................................................................11
    5.2. Cassiterite...................................................................................................................................................................14

6. Production...................................................................................................................................... 16
    6.1. Evolution of numbers of mine workers...........................................................................................................16
    6.2. Analysis of impact of Covid-19...........................................................................................................................17
    6.3. Other factors linked to Covid-19 impacting production...........................................................................17
    6.4. Factors unrelated to Covid-19 impacting production ...............................................................................18

7. Fall of the local economy............................................................................................................... 20

8. Security situation at mining sites................................................................................................. 22
    8.1. Mining Police........................................................................................................................................................... 22
    8.2. FARDC........................................................................................................................................................................ 22
    8.3. Armed groups......................................................................................................................................................... 23

9. Conclusion....................................................................................................................................... 24

10. Appendices.................................................................................................................................... 26

                                                                                              3
1. INTRODUCTION
As Covid-19 spreads around the world, artisanal mining communities experience once more how much
their livelihoods depend on the global economy. Since the outbreak of the Covid-19 pandemic, IPIS has
closely monitored its impact on 3T, gold and diamond mining and trade in Tanzania1, the Central African
Republic (CAR)2 and the Democratic Republic of the Congo (DRC).
Information about the number of Covid-19 cases in mining areas is difficult to gather, as testing capacity
is very limited in these zones. That being said, the economic consequences of the Covid-19 crisis on the
artisanal mining sector, and more broadly, on local communities depending on this activity, are tangible.
In this report, we will assess the impact of Covid-19 on artisanal mining and trade of Tin, Tantalum,
Tungsten and Gold (3TG) in eastern DRC, and analyse the consequences for the local economy
and the security situation in mining areas.
IPIS consulted its network of ASM stakeholders in eastern DRC, to collect recent data related to artisanal
mining production levels, mineral supply chains, and the security situation in mining areas.
Mid-July, IPIS published a Briefing discussing the first findings and observations.3 This report discusses
the results in more detail of several rounds of consultations with ASM stakeholders at nearly 90 mining
sites in eastern DRC, conducted between May and June 2020.
1 Mawala E., Hoex L., and Thierens M., The impact of Covid-19 on artisanal mining communities in northern Tanzania, IPIS, August 2020, https://ipisresearch.be/
publication/impact-Covid-19-artisanal-mining-communities-northern-tanzania/
2 Jaillon A., The impact of Covid-19 on gold and diamond artisanal mines in western Central African Republic, IPIS, July 2020, https://ipisresearch.be/publication/
impact-Covid-19-gold-diamond-artisanal-mines-western-central-african-republic/
3 de Brier G., In Focus: Impact of Covid-19 on Artisanal Miners in DR Congo, IPIS, 16 July 2020, https://ipisresearch.be/publication/ipis-briefing-june-2020/
42. COVID-19 IN EASTERN DRC
2.1. THE ARRIVAL OF COVID-19 IN DRC
On 10 March 2020 the first cases of Covid-19 in DRC were detected. 10 days later, the national government
ordered the suspension of flights coming from and transiting through regions at risk. To maintain social
distancing, the government also shut down schools, bars, restaurants and the borders for a period of 4
weeks.
The vast majority of the Covid-19 cases were documented in the capital Kinshasa, but the eastern
provinces were also affected. While in South Kivu the massive return of thousands of compatriots
from neighbouring countries caused an expansion of the Covid-19 in May, the number of confirmed
contaminations has decreased since May 2020 in Ituri and since June 2020 in North Kivu.
Whereas first cases are usually detected in the provincial capital, the first case of Ituri was identified in
Nyakunde, in Irumu territory, not far from the mining areas (See Map 1).
Map 1: Screenshot of IPIS interactive webmap4
The yellow dots represent the gold mining sites visited by IPIS and the grey houses represent the main local mineral
trading hubs
2.2. SANITARY MEASURES
At the time of the survey – between May and early July 2020 – gatherings of more than 20 people were
not allowed in public places. Miners were obliged to keep a social distance from each other, also when
mining in the pits.
4 https://ipisresearch.be/mapping/webmapping/drcongo/v6
5In all provinces, respondents stated that the restrictive measures from the government were not
respected at the level of the mining sites, except for the restriction of movement. Miners explained their
normal modus operandi by the absence of the Covid-19 cases at the mining site.
Respondents also noted that there were no sensitising campaigns targeting the mining community to
familiarise them with the preventive measures, apart from the general radio messages. On several mining
sites, respondents complained that cooperatives did nothing in terms of awareness raising or prevention.
The DELVE database, through its global data gathering exercise5, found that the fear of the spread of
Covid-19 was not immediate: 48% of the respondents considered their own probability of getting infected
“not likely” and 30% “not at all likely”. All respondents answered that they had a certain understanding of
how to prevent becoming sick from Covid-19, however, the majority of the respondents (60%) answered
that they had taken no measures to prevent the infection while working at the ASM site.
In Beni territory, miners seemed to be more aware of the preventive measures and, for example, regularly
washed their hands. Respondents explained this difference by the experience of Ebola in that region,
which has made miners familiar with general preventive measures.
2.3. DISRUPTION OF MINERAL TRADE
When DR Congo and neighbouring countries closed their borders, artisanal and small-scale mining
(ASM) stakeholders seemed to fear the economic collapse as much as the virus. The Covid-19 pandemic
seriously affected the artisanal mining sector in eastern DRC. Anecdotal evidence and research reports
from various observers already described how local mining communities suffered from the socio-
economic crisis.6
IPIS’ July-briefing7 provided a description of the chain of events that led to this crisis, which aggravated
the fragile socio-economic situation of many ASM stakeholders. It began when the DRC borders with
neighbouring countries were closed. All processing houses reported great difficulty to export; all they
could do was to stock their minerals until export would be feasible again.
Due to export difficulties, processing houses did not get any income. Therefore, many ceased to pre-
finance traders. Consequently, traders ran low in cash and many of them stopped visiting mining sites.
The lack of liquidity among local gold traders forced miners to accept significant lower prices for their
mineral production. This report will provide a detailed assessment of the subsequent impact on the local
ASM economy in eastern DR Congo.
5 Delve Platform, https://delvedatabase.org/data/countries/democratic-republic-of-congo
6 Delve Platform, https://delvedatabase.org/data/countries/democratic-republic-of-congo; IMPACT, Covid-19 & ASM: Illicit Traders Cashing In on Vulnerable Miners in
Conflict-Prone Areas, 10 April 2020 (https://impacttransform.org/en/Covid19-illicit-traders-artisanal-miners/); Artisanal Gold Council, Impacts of Covid-19 on ASGM
communities, https://Covid.artisanalgold.org/2020/03/possible-impacts-of-Covid-19-on-asgm-communities/
7 de Brier G., In Focus: Impact of Covid-19 on Artisanal Miners in DR Congo, IPIS, 16 July 2020, https://ipisresearch.be/publication/ipis-briefing-june-2020/
63. METHODOLOGY
Since 2013, IPIS has collected data from over 2,400 mining sites, thereby covering virtually all relevant
mining areas of eastern DRC. The data of these mining sites can be consulted on the IPIS interactive
webmap.8 IPIS’ Congolese researchers have built a network of contacts covering most of these mining
sites. For the purpose of this research, IPIS researchers contacted this network to collect information on
the impact of Covid-19 on a range of selected mining sites.
Over the course of two months, IPIS researchers conducted telephone interviews with representatives of
13 processing houses and 879 3TG mining sites, including mine managers, cooperative leaders, traders,
village chiefs, and mining state agents. For each mining site, respondents were consulted four times, i.e.
once every two weeks.
Table 1: Survey selection of mining sites and processing houses
Province Number of mining sites surveyed Number of processing houses surveyed
Ituri 11 5 (Bunia)
Maniema 35 3 (Kindu)
North Kivu 8 3 (Goma and Butembo)
South Kivu 33 2 (Bukavu)
The mining sites were selected from IPIS’ database based on two criteria:
• Mining sites visited relatively recently by IPIS, i.e. between June 2018 and December 2019
• Mining sites that employed a considerable number of miners – at least 200 for gold sites and at least
100 for 3T sites.
Since all of the 87 selected 3TG mining sites had been visited fairly recently, we considered the data from
2018 and 2019 as being the pre-Covid-19 ‘Baseline data’.
All the selected mining sites have been consulted four times, i.e. four rounds of data collection:
• Round 1 – refers to the period running from 7 May to 19 May, 2020;
• Round 2 – 20 May to 2 June, 2020;
• Round 3 – 4 June to 18 June, 2020;
• Round 4 – 19 June to 4 July, 2020.
It is noteworthy that there are no data for round 3 from Ituri mining sites because the researcher holding
the network of contacts in that area was not available during that period.
To cross-check the correlation of the quantitative data with the reality of the ground, surveyors also used
open-ended questions allowing the respondents to detail their observations (i.e. qualitative data).
The data were analysed using R (version 4.0.2) and GeoDa (1.16) to account for spatial autocorrelation
where needed.
8 https://ipisresearch.be/mapping/webmapping/drcongo/v6/#-3/28/5/4/1/
9 Originally, 96 mining sites were selected. For nine mining sites, however, IPIS did not receive responses regularly. Consequently, this data could not be used in the
statistical analyses of the report. Tables, figures and analysis in the report are therefore based on 87 mining sites.
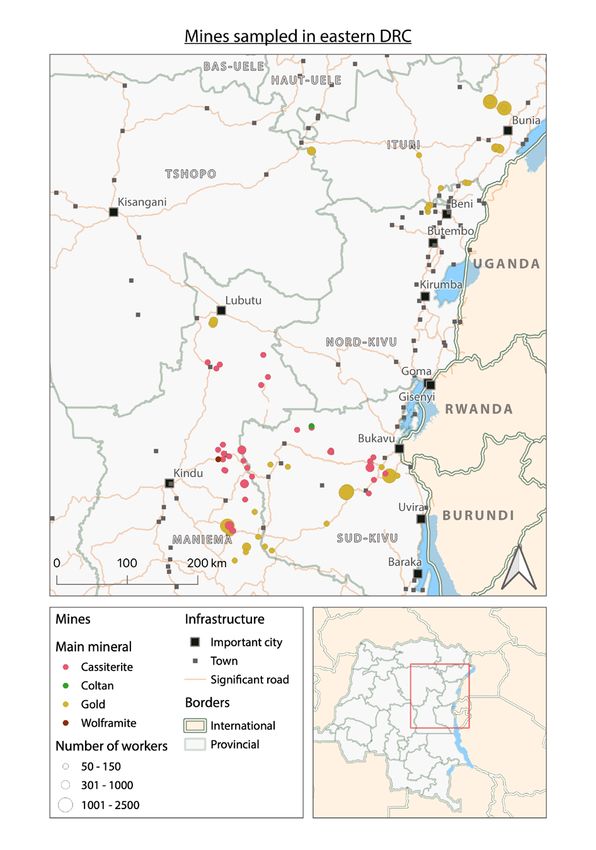
7Map 2: Mining sites included in the survey
84. MINERAL TRADE
4.1. NUMBER OF MINERAL TRADERS
When the DRC borders with neighbouring countries were closed, processing houses (comptoirs)
experienced great difficulty to export. Their mineral warehouses got packed and they did not get any
income. Consequently, many ceased to pre-finance traders, who on their turn ran low in cash. As a result,
many traders stopped visiting mining sites.
At most mining sites, interviewees indeed reported that they experienced serious difficulties to sell their
mineral production after the number of traders had decreased. Early May 2020 in Ituri, not a single gold
trader had visited any of the selected mining sites (12).
The height of the crisis seemed to be around March-April. From May onwards, mineral trade gradually
recovered. Table 2 shows that early May (round 1), numbers of traders were still decreasing at 60% of the
mining sites. By late June (round 4), this trend seems to turn and interviewees reported an increasing
number of traders at 23% of the sites.
Table 2: Trends in number of buyers
(“Compared to the previous week, the number of buyers is less, equal or more?”)
Round 1 Round 2 Round 310 Round 4
Less 60% 41% 27% 21%
Equal 31% 38% 42% 39%
More 5% 9% 15% 23%
Don’t know 5% 11% 16% 17%
The DELVE survey on the impact of Covid-19,11 seems to confirm that trade gradually recovered. Five
rounds of data collection were organized between 1 June and 31 July. While early June, 70% of gold
miners (7 out of 10 miners) reported that it was more difficult to sell gold than before the Covid-19 crisis,
this gradually improved and, by mid-July, no more than 32% (21 out of 65) claimed it was more difficult
than before. By the end of July, all of the 26 respondents claimed that the situation was the same as prior
to the outbreak of Covid-19.
The decrease in number of buyers, however, only partially reflects the slowdown of mineral trade. In South
Kivu, for example, at the important gold mining site Kadumwa (in Luhwindja), more than 100 mineral
traders still visited the mine at the time of the first round of the survey. The number of traders further
decreased to 50 buyers, who continued purchasing gold in their small shops (‘boutiques’). However,
interviewees explained that the 50 traders who remained on site regularly ran out of cash, and were no
longer able to actually buy the same amount of gold as they used to.
This cash flow problem is especially remarkable in the gold sector. The gold trade is typically characterized
by swift transactions, as money is normally readily available. Besides decreasing buying prices (see
section on pricing), the cash flow problems of traders also disturbed the traditional pre-financing by
these traders of miners’ production. At the Umoja gold mine, in Shabunda territory, gold traders even
started buying on credit.
Widespread cash flow issues in eastern DRC also resulted in increasing levels of barter trade, in which
10 Round 3 originally had different values (lower), as less sites have been visited. I’ve took percentages compared to total numbers of mines calculated in that round
11 https://delvedatabase.org/data/countries/democratic-republic-of-congo
9miners offered minerals in exchange for essential goods. A miner could for example trade 1kg of cassiterite
for 1kg of rice (both worth around 3,000 Congolese Franc at the time), the shopkeeper hoping to sell the
cassiterite at a better price later. At the cassiterite mining site of Tunsengosengo, near Itebero – which
is covered by due diligence and traceability initiatives – a PDG explained a farmer sold his Manioc for
cassiterite. These practices create serious concerns for mineral supply chain traceability.
Besides traders running out of cash as a consequence of comptoirs temporarily closing down their
business, several other reasons – not always related to Covid-19 – may explain the variations in numbers
of buyers. At Camp Tembo, for example, traders complained that the transport of 50kg cassiterite bags to
the local support village had increased, from 5,000 FC per bag before the crisis to somewhere between
7,000 and 10,000 FC during the crisis. Consequently, their profit margins were decreasing.
Table 3 shows fluctuations in numbers of traders in North Kivu that is not related to Covid-19. Traders
stopped visiting the North Kivu mines at the time of round 3 (early June) of the data collection. Heavy
rains seriously hampered gold production in the Beni area (where all of the North Kivu mines in our
survey are located), and consequently temporarily stopped gold trade.
Table 3: Number of traders visiting the mining site per week, North Kivu
Data collection round Average per mining site Median
Round 1 (8 mines) 2 2
Round 2 (8 mines) 2 2
Round 3 (8 mines) 0 0
Round 4 (8 mines) 2 2
105. MINERAL PRICES
Besides the difficulty to find traders interested to buy mineral production during the Covid-19 crisis,
miners also had to deal with decreasing mineral prices. Multiple factors can explain this decrease: the
collapse of 3T prices on the world market, the lack of cash which impeded local traders to buy minerals,
and the devaluation of the Congolese Franc.
The cash flow problems in eastern DRC’s mineral trade followed naturally from the halt of mineral exports.
The impact even aggravated in mining communities as local traders stopped visiting the mines. Local
territories in South Kivu, for example, got even more isolated as the province’s capital Bukavu was under
lockdown because of the increasing number of Covid-19 contaminations. Interviewees reported how the
lockdown immediately translated into lower mineral prices on the ground.
The subsections below will only discuss price levels for gold and cassiterite, as the number of mining sites
in our survey is too low for the other minerals, i.e. 5 sites for coltan and 3 sites for wolframite.
5.1. GOLD
Table 4 and Figure 1 perfectly illustrate how gold prices significantly decreased at the beginning of the
Covid-19 outbreak, as (mineral) trade slowed down. At the level of the mine, the average gold price was
29.3 US Dollar per gramme (US$/gr) early May, compared to 32.4 US$/gr at the time of the baseline – i.e.
pre-Covid-19. In the course of May and June, the average gold prices however quickly recovered, and
even surpassed the baseline’s average price of gold.
All of the figures and tables below express the weight of gold in (metric) grammes.
However, in eastern DRC, at the level of the mining sites and local trading hubs, the
‘Kitchele’ is more commonly used as the unit of weight for gold (at about 75% of the
mining sites in our survey). One Kitchele equals about 1.28 metric grammes. In order to
enable comparative analysis, all gold weights have been converted into metric grammes.
Furthermore, all price levels have been converted from Congolese Francs (FC) into US$.
Furthermore, it is noteworthy that the price of gold per gramme reported at the level of
the site does not always perfectly reflect the actual selling price per gramme. At several
mines, traders buy gold through the system called ‘loterie’. They do not use a balance to
weigh the gold but they assess the value just by looking at the production.
Table 4: Gold price at the level of the mining site, US$/gramme
Data collection round Average Median
Baseline (46 mines) 32.4 32.9
Round 1 (47 mines) 29.3 27.7
Round 2 (45 mines) 32.0 31.9
Round 3 (34 mines) 34.8 36.8
Round 4 (45 mines) 39.4 38.3
11Figure 1: Gold price per reference period at the level of the mining site, US$/gramme
Comparing gold prices over times is very challenging, as many other factors also influence price levels.
We will discuss below on the impact of seasons, provincial differences, and world market prices, to assess
to what extent the above observations are still valid.
Table 5: Gold price at the level of the mining site, US$/gramme, per province
Data collection round Average Median Data collection round Average Median
Ituri – 11 mines South Kivu – Baseline and round 2: 15 mines; round1:
16 mines; rounds 3 and 4: 14 mines
Baseline 29.3 29.0
Baseline 35.1 33.9
Round 1 23.4 22.1
Round 1 31.9 29.8
Round 2 30.5 29.8
Round 2 34.3 34.1
Round 3 / /
Round 3 39.1 38.3
Round 4 37.0 36.2
Round 4 42.0 40.5
Maniema – 12 mines (except round 2: 11 mines)
Baseline 33.0 33.9
Round 1 26.8 25.6
Round 2 27.0 25.6
Round 3 27.7 28.7
Round 4 28.9 29.8
12Table A.2 (see appendices) only compares mining sites that have been researched in the same season
for the baseline study and the remote surveys. This comparison shows similar price evolutions for
gold. Similar trends are also observed in the different provinces (see table 5). This illustrates that, when
considering the impact of the seasons and geographic differences, trends are largely unchanged.
Only in Maniema, the gold price in round 4 did not yet surpass that one of the baseline (table 5). Actually,
while the overall data show a significant increase in gold prices between round 1 and round 4, a cluster of
mines shows barely any change. It concerns gold mines in south-east Maniema (south of Pangi territory
and north of Kasongo territory) around the trading hubs of Bikenge and Kampene, as well as a few mines
in the south-west of the neighbouring territory Shabunda (South Kivu). Interviewees reported that
buyers still lacked sufficient cash in the area, and consequently pushed down gold buying prices. The
remoteness of these areas may be an important explanatory factor.
World market prices for gold, however, did have an impact on the trends observed above. Gold prices have
increased considerably since the baseline reference period (2018-2019, Figure 2), which suggest that gold
prices have – relatively to the world market price – decreased even more at the level of the mining sites.
source: https://goldprice.org
Figure 2: World market gold price evolution since June 2018, US$/gr
Figure 3 below shows the percentage of the gold price at the level of the mining site compared to the
world market price. This figure clearly shows that relative prices have decreased much more drastically
than what Figure 1, and Tables 4 and 5 suggest. In addition, while gold prices did recover partially at the
level of the mining sites, compared to the world market price, artisanal miners did not yet get the same
share of the value of the gold compared to the pre-Covid-19 era.
13Figure 3: Price of gold at the level of the mining site compared to world market price (% of world market price)
Despite a spike in gold prices on the world market, gold traders pushed down gold prices locally because
of the cash flow problem. Being penniless, the gold miners were forced to sell off their production at
prices far below world market prices. For example, an artisanal miner from South Kivu explained that he
was selling his gold for 120,000 FC per gramme before Covid-19. Around March 2020, he had to accept
50,000 FC, while the prices on the world market were rising. From May onwards, the selling price at
mining sites and trading houses began to recover gradually.
Observations at individual mining sites confirm that gold prices at the level of the mine have largely
recovered. For example, at Nyamurhale/Lubona, a gold mining site employing a few hundred miners in
Walungu territory (South Kivu), people reported how the price crashed from 90,000 FC/kitchele before
Covid-19, to 35,000 FC/kitchele in March-April. In early May (round 1), the price was already at 60,000 FC,
and by late June (round 4) the price was once again back at 90,000 FC.
5.2. CASSITERITE
The evolution of cassiterite prices is quite similar to the evolution of gold prices. Table 6 shows that average
cassiterite prices at the level of the mine were 24% lower early May, compared to our baseline data from
2018/2019.12 During the surveys in May-early July 2020, prices seem to gradually recovered. Different to
gold, however, late June cassiterite prices were still 12% below the pre-Covid-19 price levels (baseline).
Table 6: Cassiterite price at the level of the mining site, US$/kilogramme
Data collection round Average Median
Baseline (43 mines) 4.5 4.5
Round 1 (40 mines) 3.3 3.3
Round 2 (41 mines) 3.4 3.3
Round 3 (41 mines) 3.8 3.8
Round 4 (41 mines) 3.9 3.8
12 The Wilcoxon signed-rank test (paired samples) confirmed a significant decrease in gold prices and cassiterite prices between the baseline data of 2018-2019 and
the round 1 of the phone surveys of 2020, with p < 0.001 (below our significance level at p < 0.05). The absence of spatial autocorrelation of the data was tested
using Moran’s I to ensure that the results were valid.
14Figure 4: Cassiterite price per reference period at the level of the mining site, US$/kilogramme
While gold already surpassed the pre-Covid-19 price levels by late June, cassiterite on the contrary was
still 12% below the baseline price level. However, when comparing cassiterite and gold price levels to the
evolution on the world market, both only recovered partially
Figure 5: Price of cassiterite at the level of the mining site compared to world market price (% of world market price)
The evolution of cassiterite prices as described above is corroborated by different respondents’
explanations. Mushangi D8 in Walungu territory, is one of the biggest 3T mining sites in our survey.
Almost 600 miners were digging for wolframite and cassiterite in June 2020. At the height of the crisis
in March 2020, cassiterite prices at the level of the mine reportedly collapsed to 2,000 FC/kg. Early May,
prices had already gone up to 6,500 FC, and by June the price further increased to 9,000 FC, which was
allegedly close to the cassiterite price shortly before the crisis.
While the number of coltan mining sites in our survey is too low for statistical analysis, the same trend
seems to apply for these sites.
156. PRODUCTION
6.1. EVOLUTION OF NUMBERS OF MINE WORKERS
As mineral trade and prices collapsed, miners struggled to sell their production at a decent price. Reactions
to these deteriorating market conditions varied. On some mining sites, mine workers continued mining
at the same level, but they were forced to stock their mineral production. However, on most mining
sites, production levels went down and the numbers of miners decreased significantly compared to our
baseline data13.
Table 7 and figure 6 clearly illustrate this decrease during the Covid-19 period, compared to our baseline
data from 2018-2019. The baseline data show that before the pandemic, the 87 selected mining sites
employed more than 31,000 artisanal miners. At the time of round 1 (early May) of the data collection, the
very same mines employed less than 20,000 miners, which represents a 36% decrease. However, as ASM
is characterised, in general, by important fluctuations in miners’ numbers, absolute figures should be
interpreted with caution – a few mining sites losing a large number of workers can have a strong impact
on the total number of workers. The evolution of the median number of miners per round (also table 7
and figure 6) provides stronger statistical evidence of a downward trend. The median number of miners
decreased significantly from 200 in the baseline to 109 during round 1 of data collection (p < 0.001).
Table 7: Number of miners estimated per reference period
Data collection round Total number of mine workers Average per site Median
Baseline (87mines) 31,294 360 200
Round 1 (87 mines) 19,982 230 109
Round 2 (87 mines) 23,901 275 100
Round 3 (76 mines) 22,299 293 120
Round 4 (87 mines) 26,425 304 115
Figure 6: Number of miners per reference period (logarithmic scale)
13 Wilcoxon signed-rank test (paired samples) and significance level at p < 0.05 after validation using Moran’s.
16Although not statistically significant (p > 0.1), the slight increase in median number of miners between round
1 and round 4 (from 109 miners in May to 115 miners in July) could reflect the beginning of the recovery
of the mining sector. Moreover, by early July (round 4), the total number of miners reached 26,425, i.e. 84%
of the pre-Covid 19 level. However, it is noteworthy that this latter estimate is under the strong influence
of a few sites that experienced a surge in number of miners between May and June 2020. This estimate is
therefore not representative of the whole study area. As a result, we find no clear statistical evidence to
conclude that the number of miners had started to recover by the end of our surveys.
6.2. ANALYSIS OF IMPACT OF COVID-19
The decrease in number of miners was confirmed by qualitative data from open-questions to interviewees.
As mineral trade collapsed and miners struggled to sell their production, many simply abandoned the
artisanal mining sector, returning to their place of origin, or moved to agricultural activities in the area.
Based on interviewees’ feedback, it seems that cassiterite production has been hit harder than gold,
especially at the peak of the crisis in March-April 2020. However, the data collected by IPIS does not
provide clear statistical evidence to support this finding.
At the mining site of Chaminyago (Walungu territory), for example, both gold and cassiterite are being
exploited. Early May, the PDG explained that miners had left all the pits that solely contained cassiterite,
and they focussed on pits containing gold, or mixed gold-cassiterite. After processing and separating
gold from cassiterite, miners reportedly preferred to sell the gold – in order to make a living – and
stock cassiterite production, waiting for prices to recover as they were only at 2,000 FC at that time.
Nevertheless, it was also difficult to find buyers for gold in the nearby trading hub of Nzibira, as many
‘managers’ (local mineral traders) ran out of cash. On cassiterite mines Colline 6 and Misheke G18 (also
in Walungu territory), many miners had left during the crisis, due to low cassiterite prices. Most of them
allegedly moved to Shabunda territory, to exploit the gold mines around Kigulube.
DELVE’s survey on the impact of Covid-19, also seems to confirm that: (1) both gold and cassiterite
production and trade have been affected by the pandemic; and (2) the cassiterite supply chain seems to
have been hit hardest. Indeed, 58% of gold miners (25 of 43 respondents) reported it was more difficult to
sell gold for the period of 13-26 June, compared to the time before Covid-19; 79% of the miners reported
that they also sold less (34 of 43 respondents) than before the beginning of the pandemic. For cassiterite,
these percentages were even higher: 96% (23 of 24 respondents) reported it was more difficult to sell
their production, compared to the time before Covid-19.
6.3. OTHER FACTORS LINKED TO COVID-19 IMPACTING PRODUCTION
Besides the difficulty to sell mineral production and the consequent decreasing number of miners, some
other factors related to Covid-19 decreased production levels. For example, the government prohibited
the gathering of more than 20 people, which limited the maximum number of people per mining pit.
At some mining sites, miners respected this measure, leading to a lower number of miners. This has for
example been reported in the Misela and Kashwa cassiterite mining sites in Mwenga territory. At the
latter, the number of miners went down from 200 to 130.
Due to the general impact of Covid-19 on the economy, and the slowdown of trade, prices of commodity
goods have strongly increased. This has a negative impact on the cost of living in isolated mining
communities (see section ‘Fall of the local economy’), but also on the investment costs for the mineral
exploitations. Several mining sites, for example, ran out of fuel due to (international) slowdown of trade
and exaggerated prices following Covid-19. Without fuel, miners could not use motor pumps – to drain
the mining pits that they want to exploit – or stone crushers.
Moreover, the price of production equipment increased sharply. At Mbginguni (south of Pangi territory,
Maniema), the price of a spade rose from 6,000 FC before Covid-19, to 10,000FC in May 2020; and at Camp
17Tembo (north of Pangi territory), the price of a crowbar went up from 20,000 FC to 45,000 FC over the
same period.
Even though the figures and reports above illustrate how the number of miners seems to have decreased,
the data suggest that Covid-19 did not completely stop artisanal exploitation of minerals. Interestingly, early
May (first round of data collection), 45% of mining sites reported that new mine workers arrived at the site
to start digging. Among these newcomers, we find miners who left their jobs further away, to start digging
closer to their home community during the crisis. Furthermore, other newcomers lost their job due to the
pandemic and saw artisanal mining as an alternative livelihood. For example, at the important mining site
Kadumwa (South Kivu, employing several thousands of people) teachers and, ironically, newly unemployed
staff of the industrial mining company Banro (“congé technique”) were observed.
Children were also reported among the newcomers at many mining sites. Child labour during the holiday
periods is a well-known phenomenon. The emergence of children at mining sites was most probably
linked to school closures, one of the government measures taken against Covid-19.
6.4. FACTORS UNRELATED TO COVID-19 IMPACTING PRODUCTION
Covid-19 was not the only factor influencing artisanal mining. Besides the impact of seasons and world
market prices (see section ‘Mineral prices’), we observe various more localised problems, one of the most
important being the security situation in eastern DRC.
Table A.1 (Appendices) for examples shows a decreasing number of miners in North Kivu between
early May (round 1) and late June (round 4). We have already discussed that all of the North
Kivu mines in our sample are located in Beni territory, which was affected by heavy rains during
the survey period. (See section ‘Number of mineral traders’, table 3). On top of that the area
was affected by fighting between FARDC and ADF at the time of the surveys. (See text box below.)
The gold mining site Mukondi/Atonja, Beni territory
The situation at the mining site Mukondi/Atonja illustrates well the impact of the security situation
on the number of miners around Beni. At the time of the first telephone survey (early May), the
site was still under control of the ADF, and counted 150 miners. In the course of the month May,
the Congolese army (FARDC) took control of the mining site. ADF, however, continued to attack
and pillage the mining site. This unstable situation made many miners decide to leave, and by
the end of May (round 2), the number of miners at the site went down to 75. Fighting continued,
and on 8 June ADF recovered Mukondi/Atonja. At that time, it was hard to access the site, and the
number of miners further decreased to merely 9 by the first half of June.
The text box on the next page explains the positive impact of the demobilisation of Raïa Mutomboki
group in Walungu territory.
The mining site of ‘Cinquantenaire 3’ (Maniema province) provides yet another example of the many possible
events that influence local production. ‘Cinquantenaire 3’ witnessed a strong increase in mine workers,
from 0 to 500 in just a few weeks (from end of May to end of June 2020). In April 2020, the provincial Mining
Division had suspended exploitation at the site due to a conflict over leadership of the miners’ cooperative.
On 12 June, the suspension had been lifted, and production immediately started again.
18Luntukulu: Covid-19 interfering with other factors on mineral production
The example of some mines around Luntukulu (Walungu territory, South Kivu) offers a good
illustration of how different factors interact with each other to impact the evolution of miners
numbers. These factors often include seasonality, security situation, productivity, etc.
At the cassiterite mining site of Colline 6, close to Luntukulu, the number of mine workers
gradually rose from 85 early May (round 1) to 130 late June (round 4). Without any doubt the
main drivers for this increase was local trade that revived, and cassiterite prices that rose
from 6,000 to 10,000 FC/kg over the same period. Interviewees, however, explained that even
though some miners had left due to Covid-19 (mostly to Shabunda to dig for gold), production
never entirely collapsed because the local security situation was stable lately - the local Raïa
Mutomboki of chief Maheshe are no longer very active and ready to disarm.
The mining site Misheke G18, located in the same area, observed, however, a gradual
production decrease. While it profited from the same mineral prices, and the same stable
security situation, it saw its number of mine workers decreasing from 60 to 40 over the same
period. Interviewees explained that miners left because the site’s pits were flooded and there
were no motor pumps.
At Mushangi D8, located between the trading hubs of Nzibira and Luntukulu, interviewees also
reported a strong increase in number of miners, from around 150 early May to almost 600 by
the end of June. The main reason seemed to be the return of a large number of managers
(small mineral traders) to buy at the mining site, from 4 early May to 25 late June. Undoubtedly
this increase was also linked to the surrender of Maheshe in the second half of May, which
relieved the miners (and local community at large) from the rebellion group’s illegal tax levies.
Interviewees reportedly even observed several rebels of Maheshe’s Raïa Mutomboki among
the new miners. They were looking for a new source of income as Maheshe was preparing for
demobilisation.
197. FALL OF THE LOCAL ECONOMY
The hit of Covid-19 on the mineral trade was a hard reminder of the dependency of many local communities
on the artisanal mining sector. The trade in minerals is often the most important activity that creates new
influx of cash, and boosts local trade. When the borders were closed and the official export of minerals
stopped, cash flow ceased which led to a serious collapse of the economy and created a catch 22: mineral
buyers had no cash to buy minerals. At the same time, in the broader local economy, the prices of food
and essential goods started to increase dramatically.
According to the local population, in most mining sites the price of essential goods greatly increased.
Diggers complained about the increase in food prices, sometimes up to two or three times the price of
the pre-Covid-19 period.
Besides the closure of the international borders, the inflation rate was also amplified by internal restrictions
of movement and hence, limited transportation of goods. For example, when the governor of South Kivu
announced that movements were limited, food and imported manufactured goods from Bukavu were
no longer reaching villages, raising the prices.
Finally, the devaluation of the Congolese Franc to the US dollar also contributed to the overall increase
of food- and essential goods prices. Before the announcement of the Covid-19 restrictions, 1 US$ was
changed at 1,600-1,700 FC; in May 2020 the exchange rate was 1 US$ for 1,900 FC.
As illustrated by examples on some mining sites (table 8), food prices increased in South Kivu. On some
mining sites, the word “famine” was used to qualify the situation. Along with miners, small businesses
left the mining areas since they had less clients and they experienced difficulty to find products to sell.
Table 8: Example of food prices on a sample of mining sites in South Kivu (in FC)
Sugar Oil Flour Goat 1 kg of Meat
Price pre-Covid-19 500 500 300 100,000 10,000
Price in May 2020 800 1,200 750 200,000 15,000
Increase + 60% + 140% + 150% + 100% + 50%
In Maniema, prices also increased due to the scarcity of products on the market. One miner complained
that “you can see food at the market, but we lack money to buy it, yet we are hungry”. Also work
equipment became more expensive. For example, the price of a shovel doubled, as well as the price of
oil and manioc flour.
Interestingly, only mining sites in Maniema experienced a rapid increase in prices and, a few weeks later,
a rapid decrease. Interviewees explained this trend by the overall shortage of money. As no one could
afford to pay more, shopkeepers were forced to sell food at lower price to find customers.
In North Kivu, miners complained that work equipment became more expensive. Since this is normally
imported from Kampala or other foreign countries, the supply was cut. The same was true for other
essential goods imported from outside the DRC.
The price of imported products increased also dramatically in Ituri. This led to more bushmeat
consumption, which is directly available in the region. Local farmers were said to do good business,
having a higher demand for their local production.
The increase in consumer goods prices fell hard on local mining communities and mine workers as income
levels decreased already considerably with the drop in mineral prices (see section ‘Mineral prices’) and
the devaluation of the Congolese Franc. The example of a miner from South Kivu (at the Zolazola mining
20site) illustrates this well. In January 2020, before Covid-19, he was making 5 US$ for every kilo of cassiterite,
as the mineral was sold at 8,000 FC, at a rate of 1 US$ for 1,600 FC. In May, the same cassiterite was sold for
5,000 FC (decrease of the world market price), at a rate of 1 US$ for 1,900 FC (devaluation of the Congolese
Franc), hence leaving the miner with 2.63 US$. Within 4 months, the value of his production had therefore
depreciated by 47%.
218. SECURITY SITUATION AT MINING SITES
Security-wise, the first semester of 2020 has been particularly violent in eastern DRC.14 There is however
no clear correlation between changes in the level of violence and the Covid-19 outbreak.
In the period before Covid-19, there was an armed presence (including armed groups, FARDC and Mining
Police) at 50% of the selected mining sites. In May and June 2020, this situation has not changed and it
seems that the national army still controls most of the mining sites. Except for Beni, we did not receive
reports of attempts by non-state armed groups to control mining sites within our sample.
We will however refrain from comparing the baseline data with the data collected in May-June 2020 for
each separate armed group because changes in the presence can be explained by many different factors
and cannot be (solely) attributed to Covid-19.
8.1. MINING POLICE
That being said, one element did change significantly and which is, at least to a certain extent, directly
linked to Covid-19: the presence of the mining police (table 9). There was an increasing presence of mining
police, as they were verifying whether the preventive measures against the Coronavirus were respected
on the mining sites.
On several mining sites, the mining police fined miners (between 5,000 to 25,000 FC) for not wearing
a mask and hence, not complying with the Covid-19 protective measures. In Shabunda, an increase in
harassment, including illegal taxation, of mining police and other law enforcement officers was reported
since the outbreak of Covid-19.
Table 9: Mining police presence at the mining sites
Number (and %) of mines with Mining Police presence Number (and %) of mines with Mining Police presence
during Covid-19 before Covid-19
Round 1 26 (30%)
Round 2 24 (28%) Baseline 13 (15%)
Round 3 16 (21%)
Round 4 13 (15%)
8.2. FARDC
With regards to presence of the FARDC at mining sites, there have not been any changes compared to
the baseline data. As was the case in the period before Covid-19, illegal taxation remained the main form
of interference.
For example, in Ituri, FARDC are present on 4 of the 12 mining sites of our survey, and on all of them
they demanded ½ gram of gold per month from each pit owner as a contribution to the ‘war effort’. In
South Kivu, FARDC is present on 10 of the 33 mining sites reviewed in June. On 5 of them, pit owners
were requested to pay 1 gram of gold. FARDC based in Lulingu reportedly asked the equivalent of two
kilograms of cassiterite per mining site, also as a contribution to the ‘war effort’.
14 The IPIS incident reporting system “Kufatilia” (https://ipisresearch-dashboard.shinyapps.io/kufatilia_app/) has reported at least 281 incidents that included violence
in and around a mining site; Confidential reports of International NGOs.
228.3. ARMED GROUPS
Armed group activity has been reported on several of the selected mining sites. This report will however
not give a detailed analysis of these incursions because there is no direct link to Covid-19, the subject of
this research.
Some incidents were reported in Ituri, where the armed group Codeco is active in Djugu territory and
made incursions on two mining sites during the reporting period.15 In Shabunda territory (South Kivu),
armed group activity persisted. In the south of the territory, Mai Mai Malaika extorted diggers on several
mining sites, and near Lulingu (north Shabunda), security incidents were reported between FARDC
elements and Raïa Mutomboki on some sites.
As was the case before the outbreak of the pandemic, Beni territory (North Kivu) kept high levels of armed
group presence in May and June 2020. Just after the announcement of Covid-19 preventive measures,
armed groups had reportedly stopped fighting for two weeks. However, after two weeks, new attacks
were reported. In the west of Beni territory, multiple attacks by armed groups were reported.
15 For background reading on security situation in Ituri: IPIS Briefing August 2020 – Persistent violence in gold-rich Ituri Province, DR Congo : root causes and impact on
local population, https://ipisresearch.be/weekly-briefing/ipis-briefing-august-2020-persistent-violence-gold-rich-ituri-province-dr-congo-root-causes-impact-local-
population/
239. CONCLUSION
Although a major health crisis has been avoided so far in the mining areas, the economic impact of
Covid-19 on ASM communities is severe. As soon as the borders with neighbouring countries were
closed, exporting facilities experienced great difficulty to export and many ceased to pre-finance traders.
Consequently, mineral traders ran low in cash and were no longer able to buy the same volumes as
before.
The lack of liquidity among local traders forced miners to accept significant lower prices for their mineral
production. Prices hit rock-bottom in March-April 2020. Some miners explained they received 35,000 FC/
kitchele of gold, and 2,000 FC/kg cassiterite, while the prices were reportedly around 90,000 FC and 9,000
FC, respectively, prior to Covid-19.
The survey results reveal that price levels for both cassiterite and gold slowly recovered since May 2020.
In May, the median gold price was still 16% below the baseline price level in 2018-2019 (27.68 US$/gr
compared to 32.89 US$/gr); by late June 2020, the median gold price even surpassed the baseline level.
For cassiterite, the prices were 27% lower in May 2020 compared to the baseline (3.27 US$/kg compared
to 4.5 US$/kg).
The fragile situation of artisanal miners in eastern DRC is clearly highlighted when considering the price
evolutions relatively to the international market. While the median gold price at the level of the mine was
82% of the world market price during the baseline period, it fell to 49% early May 2020. The prices slowly
recovered over the next few months to 68% late June 2020, but remain 14% under the pre-Covid-2019
share. The same evolution can be observed for cassiterite: from 27% in the baseline, to 21% early May
2020, and 23% late June 2020.
Trade slowed down, pre-financing dried up, and mineral prices decreased. All of these factors also
seemed to have a negative impact on mineral production. At the selected mining sites of our survey, we
have observed a serious decrease in numbers of miners due to Covid-19. The median number of miners
per site decreased from 200 at the time of the baseline, to 109 early May 2020.
Many mine workers simply abandoned the artisanal mining sector, returning home, or moved to
agricultural activities in the area. Others switched from cassiterite to gold mining as the prices were a bit
higher. At some mining sites, interviewees explained that mineral production continued, but miners only
sold the bare minimum in order to survive and stock the rest of their production to await better prices.
Paradoxically, the pandemic also pushed some people into ASM. Some people who lost their job saw
artisanal mining as an alternative livelihood, e.g. teachers, unemployed staff of the industrial mining
company Banro, as well as children as schools closed down.
Decreasing mineral prices, lower revenues and a slowdown of local trade, hit local mining communities
hard, especially as it went hand in hand with increasing prices for consumer goods. The report provides
examples illustrating that some food prices have even increased 150% compared to the pre-Covid-19
period. Consequently, food security in many mining communities has become a concern.
The on-going Covid-19 pandemic revealed once more the fragile situation of ASM mining communities,
because of the direct dependency on mineral trade and pre-financing. Once local traders ran out of cash,
the entire local economy was disrupted. At the same time, the ASM sector also showed its resilience, as
it already seemed to recover to some extent after international borders reopened. It provided even an
alternative income for some people during the peak of the crisis.
Furthermore, the pandemic has also highlighted inequalities in mineral supply chains, in particular the
fragile situation of miners. Mining communities greatly suffered while illicit actors had the best profit
margins in long time. While the entire global economy slowed down, miners were forced to accept
mineral buying price reductions which by far surpassed the decline on the world market.
24Covid-19 also seriously challenged responsible mineral sourcing efforts, i.e. due diligence. The pandemic
presents an opportunity for some people, although most probably in the short-term only. Miners
desperate to sell, and the growing margins, created opportunities for illicit traders, and potentially
conflict actors, to engage in the sector. Widespread cash flow issues in eastern DRC resulted in increasing
levels of barter trade, in which miners offered minerals in exchange for essential goods. These practices
create serious concerns for mineral supply chain traceability.
IPIS will continue to monitor the impact of the Covid-19 pandemic on the selected mining sites in the
coming months to analyse the medium-term effects on the ASM sector in eastern DRC.
2510. APPENDICES
Table A.1: Number of miners per reference period, per province
Data collection round Total number of mine workers Average per site Median
Ituri – 11 mines
Baseline 8,338 758 350
Round 1 2,535 230 140
Round 2 2,873 261 150
Round 3 / / /
Round 4 3,305 300 100
Maniema – 34 mines
Baseline 8,961 256 165
Round 1 5,146 147 97
Round 2 9,426 269 92
Round 3 9,759 279 150
Round 4 7,346 210 126
Nord Kivu – 8 mines
Baseline 904 113 101
Round 1 974 122 60
Round 2 438 55 55
Round 3 192 24 24
Round 4 253 32 28
Sud Kivu – 33 mines
Baseline 13,091 397 200
Round 1 11,327 343 130
Round 2 14,972 454 110
Round 3 15,498 470 120
Round 4 15,521 470 130
Table A.2: Gold price at the level of the mining site, US$/gramme (only including mines that have been
visited in the same season for the baseline study and the telephone surveys)
Data collection round Average Median
Baseline (31 mines) 33.3 33.9
Round 1 (31 mines) 28.6 28.5
Round 2 (30 mines) 32.0 30.2
Round 3 (19 mines) 36.0 38.3
Round 4 (29 mines) 37.8 38.3
26Telephone surveys were conducted between 7 May and 4 July 2020. For most of the mining sites in this
study, i.e. those in Maniema and South Kivu, it was the ‘dry season’. In the Beni area (North Kivu), and Ituri,
on the other hand, it was the rainy season.
For table A.2., we only considered mining sites that were visited originally (Baseline ‘data collection
round’) during the period May to October 1st. These sites were roughly visited during the same season
(dry or wet season) as the telephone surveys in 2020, allowing direct comparison with 2020 data.
Table A.3: Cassiterite price at the level of the mining site, US$/kilogramme, per province
Data collection round Average Median
Maniema
Baseline (24 mines) 4.4 4.5
Round 1 (23 mines) 3.0 3.3
Round 2 (23 mines) 3.1 3.3
Round 3 (23 mines) 3.3 3.3
Round 4 (23 mines) 3.5 3.8
South Kivu
Baseline (19 mines) 4.6 4.5
Round 1 (17 mines) 3.8 3.3
Round 2 (18 mines) 3.9 3.5
Round 3 (18 mines) 4.4 4.4
Round 4 (18 mines) 4.5 4.4
27V.U. Filip Reyniers, Directeur, IPIS, Italiëlei 98A, 2000 Antwerpen I Layout: SAKADO I D/2020/4320/11
You can also read