INVESTOR PRESENTATION AUG 2016 - Manappuram Finance Ltd @ 2015

Page created by Keith Maxwell
 
CONTINUE READING
INVESTOR PRESENTATION AUG 2016 - Manappuram Finance Ltd @ 2015
INVESTOR PRESENTATION
                                       AUG 2016

Manappuram Finance Ltd @ 2015                           1
INVESTOR PRESENTATION AUG 2016 - Manappuram Finance Ltd @ 2015
GOLD LOAN
        (LOAN AGAINST                                 MICROFINANCE
            GOLD)

                                MORTGAGE &
                                 HOUSING
                                 FINANCE

                                             MANAPPURAM FINANCE LIMITED
                                                  INVESTOR PRESENTATION
                                                               AUG 2016
                                                                     1
Manappuram Finance Ltd @ 2015                                            2
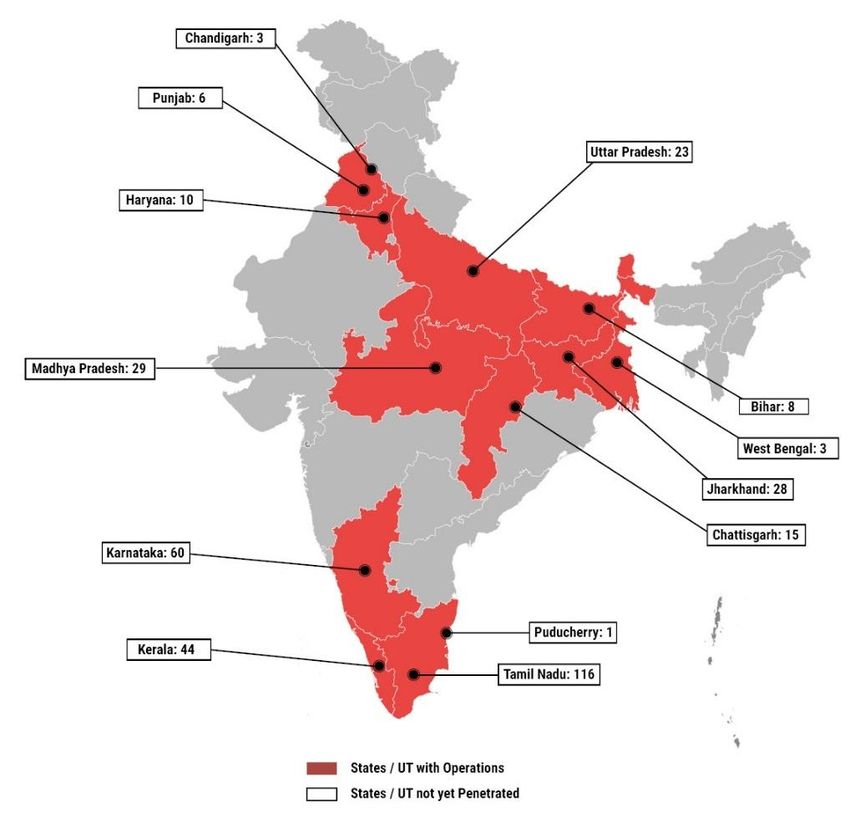
INVESTOR PRESENTATION AUG 2016 - Manappuram Finance Ltd @ 2015
DISCUSSION SUMMARY

   QUARTERLY UPDATE

   ABOUT US – COMPANY OVERVIEW

   UNDERSTANDING OUR EVOLUTION

   BUSINESS STRATEGY INITIATIVES

   INDUSTRY OVERVIEW

   ANNEXURE

Manappuram Finance Ltd @ 2016       3
INVESTOR PRESENTATION AUG 2016 - Manappuram Finance Ltd @ 2015
DISCUSSION SUMMARY

   QUARTERLY UPDATE

   ABOUT US – COMPANY OVERVIEW

   UNDERSTANDING OUR EVOLUTION

   BUSINESS STRATEGY INITIATIVES

   INDUSTRY OVERVIEW

   ANNEXURE

Manappuram Finance Ltd @ 2016       4
INVESTOR PRESENTATION AUG 2016 - Manappuram Finance Ltd @ 2015
QUARTERLY UPDATE:
 Q1 FY17 - KEY RESULT HIGHLIGHTS

          • Closing AUM at Rs 130 bn up 13.8% q-q

          • Net profit up by 22.7 % q-q at Rs 1,603.4 mn

          • ROA at 4.69% and Spread at 15.91%

          • EPS of Rs 7.6 per share, NAV per share Rs 34.7

          • High capital adequacy of 22.3% (Tier 1 – 21.8%)

          • Long term rating upgraded to AA- by CRISIL and ICRA

          • Moved to 90 days NPA recognition. Standard Assets provision at 0.4

Manappuram Finance Ltd @ 2016                                                    5
INVESTOR PRESENTATION AUG 2016 - Manappuram Finance Ltd @ 2015
FINANCIAL DETAILS:
 CONSOLIDATED PROFIT & LOSS STATEMENT

   Particulars (In Rs Mn)         Q1FY17    Q1FY16    YOY %    Q4FY16    QOQ %     FY16
   Closing AUM (Rs in bn)           130       101      28.8%     114      13.8%      114
   Interest income                7,433.4   5,376.1    38.3%   6,503.2    14.3%     23,490
    Other Operating Income          27.9      14.3     95.0%     21.5     29.5%     112.7
   Income from Operations         7,461.3   5,390.4    38.4%   6,524.7    14.4%    23,602.3
   Finance expenses               2,649.5   2,360.6    12.2%   2,357.8    12.4%    9,473.9
   Net interest income            4,811.8   3,029.8    58.8%   4,166.9    15.5%    14,128.4
   Employee expenses              1,206.5   1,019.9    18.3%   1,115.0    8.2%     4,326.8
   Other operating expenses        988.5     986.7     0.2%     965.4     2.4%     4,030.4
   Pre provision profit           2,616.8   1,023.2   155.7%   2,086.5    25.4%    5,771.2
   Provisions/Bad debts            159.0     123.6     28.7%    127.5     24.6%     423.4
   Other Income                     46.6      19.2    143.2%     30.8     51.6%     135.9
   Profit before Tax              2,504.5    918.8    172.6%   1,989.7    25.9%    5,483.8
   Tax                             891.2     320.7    177.9%    684.0     30.3%    1,932.3
   PAT before Minority Interest   1,613.3    598.1    169.7%   1,305.8    23.5%    3,551.5
   Minority Interest                9.9       5.1      91.6%    (1.2)    -934.7%     17.9
   PAT                            1,603.4    593.0    170.4%   1,307.0    22.7%    3,533.6

Manappuram Finance Ltd @ 2016                                                                 6
INVESTOR PRESENTATION AUG 2016 - Manappuram Finance Ltd @ 2015
FINANCIAL DETAILS:
 CONSOLIDATED BALANCE SHEET

    Particulars (In Rs Mn)                            Q1FY17      Q1FY16      YOY %     Q4FY16     QOQ %

    Cash & Bank Balances                             7,696.5     8,489.0     -9.3%     6,044.8    27.3%

    Investments                                       50.6        535.2     -90.5%      490.6     -89.7%

    Loans & Advances                                129,638.1   101,320.1   27.9%     113,853.0   13.9%

    Fixed Assets                                     1,921.3     1,760.9     9.1%      1,947.7     -1.4%

    Other Assets                                     5,568.5     7,169.7    -22.3%     6,055.5     -8.0%

    Total Assets                                    144,874.9   119,275.1   21.5%     128,391.5   12.8%

    Share Capital                                    1,682.7     1,682.4     0.0%      1,682.4     0.0%

    Reserves & Surplus                              27,499.6    24,784.3    11.0%     25,898.0     6.2%

    Borrowings                                      110,783.7   89,052.9    24.4%     96,379.3    14.9%

    Other Liabilities & Provisions                   4,687.0     3,549.9    32.0%      4,219.9    11.1%

    Minority Interest                                 221.9       155.6     42.6%       212.0      4.6%

    Preference Share Capital of Minority Interest      0.0        50.0      -100.0%      0.0      -100.0%

    Total Liabilities                               144,874.9   119,275.1   21.5%     128,391.5   12.8%

Manappuram Finance Ltd @ 2016                                                                               7
INVESTOR PRESENTATION AUG 2016 - Manappuram Finance Ltd @ 2015
RESULT ANALYSIS:
 AUM UPDATE
                          Consolidated AUM                                               AUM Break-up Product Wise
                                                                                                                               100,806           113,451
                                                      130,139137,552   95,924          95,239               96,392
                                               114,725                                                                                 9,998                12,368
                102,203                  114,330
    101,047                   105,790
                                     94,104                                                                          6,983                                    487
           84,087       82,573                                                               5,388                                                           1,684
                                                                             4,183                                                          1,298
                                                                                                                        895
                                                                                                      115                                                   1,705
                                                                                37                                      414
                                                                                                                                          442                 445

                                                                          Q1FY16           Q2FY16              Q3FY16               Q4FY16            Q1FY17
                                                                         LAP (Rs mn)                                         Home Loan (Rs mn)
       Q1FY16      Q2FY16      Q3FY16        Q4FY16        Q1FY17
                                                                         Commercial Vehicle (Rs mn)                          Other Loan (Hypo,Against NCD) (Rs mn)
                     AUM (Rs mn)     Disbursements (Rs mn)               Micro Finance (Rs mn)                               Gold Loan (Rs mn)

                AUM Break-up Asset Region Wise                                       AUM Break-up Asset Region Wise

        7%           8%           8%           8%           8%
       14%          14%          14%          15%          15%         Key Highlights :
       11%          11%          12%          12%          12%
                                                                       • Our Total AUM is at Rs 130,139 mn, increase of
                                                                           13.8% QoQ.
       68%          67%          66%          65%          65%         • Share of new business at 11.0% of consolidated
                                                                           AUM.
      Q1FY16      Q2FY16       Q3FY16    Q4FY16          Q1FY17
                     South     North West East

Manappuram Finance Ltd @ 2016                                                                                                                                        8
INVESTOR PRESENTATION AUG 2016 - Manappuram Finance Ltd @ 2015
RESULT ANALYSIS:
 PROFITABILITY ANALYSIS
                     Yields & Spread Analysis                                      Cost of Funds & Profitability Analysis
                                23.8%         24.2%         24.6%                                                             1,603
     22.3%        21.8%
                                                                                                                 1,308
                                                                                                     1,003

                                              15.5%         15.9%                       630
     12.2%                      14.5%                                    593
                  12.0%
                                                                               11.6%
                                                                                           11.1%         10.6%        10.5%       10.4%
    Q1FY16       Q2FY16         Q3FY16        Q4FY16       Q1FY17
                                                                        Q1FY16         Q2FY16       Q3FY16      Q4FY16        Q1FY17
                   Net Yields       NIM (%)                                                        PAT     COF (%)

                 Return Ratios & Capital Adequacy                                        Highlights For the Quarter

                                              24.0%         22.3%    Key Highlights :
                                25.4%
     25.0%        25.3%                                              • Cost of funds declined further 10 bps q-q to 10.3%
                                                            22.0%
                                                                         due to raising of lower cost funds from banks and
                                              19.0%                      mutual funds.
                                14.8%
      9.0%         9.5%                                              • Capital Adequacy is healthy at 22.3% (Tier 1 - 21.9%)
                                                             4.7%        compared to the minimum 15.0% stipulated by RBI
         2.0%      2.1%         3.4%           4.2%
                                                                         for gold loan companies.
     Q1FY16       Q2FY16        Q3FY16        Q4FY16        Q1FY17
                ROA (%)           ROE (%)              CAR (%)

Manappuram Finance Ltd @ 2016                                                                                                             9
INVESTOR PRESENTATION AUG 2016 - Manappuram Finance Ltd @ 2015
RESULT ANALYSIS:
 OPERATIONAL ANALYSIS

                         Productivity (Rs mn)                                                    Opex to AUM (%)

       3293         3293           3293           3293          3293
                                                                            8.4%          8.2%         8.4%
                                                                35.4                                                7.7%
                                                                                                                             7.3%
                                 30.0             31.3
       29.4       29.2

     Q1FY16     Q2FY16      Q3FY16              Q4FY16      Q1FY17         Q1FY16     Q2FY16          Q3FY16       Q4FY16   Q1FY17
              Average AUM per Branch            No of Branches

        Gold Loan Customer Base (mn) & Avg. Ticket Size                                    Highlights For the Quarter
                                                              34,439
                                              32,463
    31,040       30,763         31,129                         2.06    Key Highlights :
                                                 1.93
      1.81        1.85           1.87                                      Number of live gold loan customers is 2.06 million –
                                                                            up by 6.7% q-q
                                                                           Total number of gold loan branches stable at 3,293
                                                                           Average AUM/branch increased to Rs 35.4 mn.
     Q1FY16     Q2FY16         Q3FY16          Q4FY16         Q1FY17
              No Of Customers           Average Ticket Size in Rs.

Manappuram Finance Ltd @ 2016                                                                                                        10
RESULT ANALYSIS:
 ASSET QUALITY UPDATE

             Gross NPA & Net NPA – Gold Loan (Rs mn)                                     Gross & Net NPA %

                                                                    1.2%
    1,149                                                                                     1.1%
                              1,075                                        1.0%   1.0%                      1.0%
            970   986                       978         951                                          0.9%
                                      881                                            0.8%                             0.8%
                        813                       759                                                          0.7%
                                                              742
                                                                                                                             0.6%

     Q1FY16       Q2FY16      Q3FY16        Q4FY16      Q1FY17      Q1FY16        Q2FY16       Q3FY16       Q4FY16    Q1FY17

                        Highlights For the Quarter

    Key Highlights :
     Gross NPAs falls below 1.0% of AUM in Q1 FY16 despite shift to recognition at 90 days instead of 120 days as per RBI
        norms.
     NPAs on account of theft, spurious collateral etc. are only 0.10% of AUM.

Manappuram Finance Ltd @ 2016                                                                                                       11
SEGMENT WISE UPDATE:
 GOLD BUSINESS - AUM GROWTH ANALYSIS

                Gold Business - AUM & Disbursements                                                     Net Growth
                                                                   132,008
                                                                                                                                       13,014
                                                             113,451                                                                        12,645
                                                       108,688
  95,924        95,239            96,392     100,806
                                        90,453                                  9,224
           81,881        79,814                                                             7,353                      6,435
                                                                                                         5,053                 4,587
                                                                                    3,684
                                                                                                               1,153

                                                                                                 -685
    Q1FY16          Q2FY16     Q3FY16      Q4FY16       Q1FY17                  Q1FY16       Q2FY16       Q3FY16        Q4FY16          Q1FY17
                     AUM (Rs mn)    Disbursements (Rs mn)                                   New Book (Rs mn)       Net Growth (Rs mn)
                          Gold Holding (tonnes)                                                 Highlights For the Quarter

                                                                 63.3
                                     58.5         59.6                       Key Highlights :
      56.1           57.3
                                                                              Disbursements in Q1 FY17 is Rs 132,008 mn
                                                                              Gold Loan AUM of Rs 113,451 mn
                                                                              Gold holdings at 63 .3 tonnes – an increase of 6.7% q-
                                                                                 o-q and 13.8% y-y indicating that growth is driven by
                                                                                 volume increase
    Q1FY16          Q2FY16         Q3FY16       Q4FY16         Q1FY17
Manappuram Finance Ltd @ 2016                                                                                                                        12
QUARTERLY UPDATE:
 LIABILITY MIX

                        Borrowings as on June 30, 2016                            Sources of Funds                    Amount (Rs Mn)
                           SubordinatedOthers
                               Bond     0.2%                                      NCD                                    10,853
                               1.4%
                                       NCD                                        Bank Finance                           81,729
                                      9.8%
                        Commercial
                          Paper                                                   Commercial Paper                       16,429
                          14.8%
                                                                                  Subordinated Bond                      1,578

                                                                                  Others                                  195

                                                                                  Total                                 110,784

                                      Bank Finance
                                         73.8%                                                        Credit Rating
                                                                                    Credit rating history of 20 years (has investment
                                                                                    grade rating since 1995)

                                                         Long-term Debt Programme
     CRISIL,CARE,ICRA                                                                        AA- (Stable)
                                                     Short-term Debt Raising Programme
     CRISIL,ICRA                                                                             A1+

Manappuram Finance Ltd @ 2016                                                                                                           13
SUBSIDIARY INFORMATION:
                            ASHIRWAD MICROFINANCE – Q1 FY17 RESULT HIGHLIGHTS
                                  AUM                                                         Yields & Spread Analysis
                                                                                           25.2%       25.3%                24.0%
                                                                12,368           23.6%                             23.6%
                                                9,988

                5,388           6,983                                    4,540
4,183                                                   4,697                    15.2%     15.0%       15.6%       14.1%    14.0%
                                        2,849
        1,716           2,141

  Q1FY16          Q2FY16      Q3FY16        Q4FY16        Q1FY17                 Q1FY16    Q2FY16      Q3FY16      Q4FY16   Q1FY17
                    AUM (Rs mn)     Disbursements (Rs mn)                                   Net Yields     NIM (%)

                        Gross & Net NPA %                                                     Highlights For the Quarter

                 0.46%

                        0.32%
                                0.28%                                            Key Highlights :
                                        0.20%                                     Disbursements in Q1 FY16 is Rs 4,540 mn
                                                 0.11%           0.10%            Microfinance AUM of Rs 12,368 mn
                                                     0.08%
0.05%0.04%                                                           0.05%

  Q1FY16           Q2FY16         Q3FY16           Q4FY16          Q1FY17
                            Gross NPA      Net NPA

                                                                                                                                     14
SUBSIDIARY INFORMATION:
                           ASHIRWAD MICROFINANCE – Q1 FY17 RESULT HIGHLIGHTS

Particulars (In Rs Mn)                  Q1FY17        Q1FY16          YOY %            Q4FY16            QOQ %             FY16
Income from Operations                  659.20         225.10          192.8%          513.40             28.4%            1,560.9
Finance expenses                         286.60        50.80           464.2%           241.90            18.5%             675.0
Net interest income                     372.60         174.30          113.8%          271.50             37.2%             885.9
Employee expenses                        119.50        39.00           206.4%           85.30             40.1%             265.3
Other operating expenses                 62.40         22.90           172.5%           56.90              9.7%             257.9
Pre provision profit                    151.90         55.00           176.2%          120.10             26.5%             362.7
Provisions/Bad debts                     23.00         12.20           88.5%            39.20             -41.3%            123.1
PAT                                     128.90         42.80           201.2%           80.90             59.3%             239.6

Particulars (In Rs Mn)        Q1 FY17      Q1 FY16   YOY%        Q4 FY16       QOQ %       Particulars                      Q1FY17

Closing AUM                 12,368.00    4,183.00    195.7%     9,988.00      23.8%        Capital Adequacy (%)             20.0%

Borrowings                  9,352.00     3,393.67    175.6%     7,674.00      21.9%        ROA (%)                           4.5%

Net Worth                   2,429.00     1,145.56    112.0%     2,300.00       5.6%        ROE (%)                          21.2%
                                                                                           Average Ticket Size (Rs Lacs)     0.2
                                                                                           No. of Customers (Lacs)           6.2

                                                                                                                                     15
DISCUSSION SUMMARY

   QUARTERLY UPDATE

   ABOUT US – COMPANY OVERVIEW

   UNDERSTANDING OUR EVOLUTION

   BUSINESS STRATEGY INITIATIVES

   INDUSTRY OVERVIEW

   ANNEXURE

Manappuram Finance Ltd @ 2016       16
COMPANY OVERVIEW:
 BRIEF OVERVIEW

                          Incorporated in 1992, the company has been one of India’s leading gold loans NBFCs.
         STRONG
        PEDIGREE          Promoted by Mr. V.P. Nandakumar (current MD & CEO) whose family has been involved in gold loans since
                           1949.

                          One of the largest listed players in the gold loan business with an AUM of Rs 1,13,451 mn as of June 2016.
                          Established pan-India presence, with a strong distribution network of 3,588 branches spread across 23 states and 4
    BUSINESS OVERVIEW      union territories, with a live customer base of ~2.06 million.
                          Plans to utilise surplus capital to build or acquire new lending products relevant to the existing retail customer base.
                          Addition of new synergistic product segments – Microfinance, Commercial vehicles, Mortgage & Housing Finance.

                            Total AUM has grown from Rs 75,491 mn in FY11 to Rs 1,30,139 mn in Q1FY17.
                            Disbursements have grown from Rs 84,087 mn in Q1FY16 to Rs 1,37,552 mn in Q1FY17.
                            Capital Adequacy Ratio in Q1FY17 stood at 22.3%.
        FINANCIAL
      PERFORMANCE           Asset Quality: Gross NPA’s – 0.8% & Net NPA’s –0.6% in Q1FY17.
                            Total Income from Operations, Net Interest Income and PAT in Q1FY17 are Rs 7,461 mn, Rs 4,812 mn & Rs 1,603 mn
                             respectively. Return ratios: ROA – 4.7% in Q1FY17, ROE – 21.98% in Q1FY17.

                          Consistent dividends to shareholders – Paid dividend of Rs 1,514 mn in FY16, dividend payout of 44.9% of PAT.
     HIGH CORPORATE       Reputed auditors such as KPMG as internal auditors and SR Batliboi & Associates as statutory auditors to ensure accurate
       GOVERGANCE          financial reporting & transparency.
        STANDARDS
                          Strong external professional representation on the Board with 6 of the 10 directors being independent. Board is chaired
                           by Mr. Jagdish Capoor – Ex-Deputy Governer of RBI, Ex-Chairman of HDFC Bank, BSE & UTI.

Manappuram Finance Ltd @ 2016                                                                                                                         17
COMPANY OVERVIEW:
 PAN INDIA PRESENCE & DISTRIBUTION NETWORK

                                                                                  Extensive Pan India presence through 3,293 branches spread
                                                                                   across 23 States and 4 Union territories in India.
                                                                                  Strong Presence in Rural & Semi Urban markets as more than
                                                                                   60% of the Gold is held in Rural India.
                                                                                  Focus on diversified presence across India, South Region
                                                                                   now constitutes 68% of the branch network as compared
                                                                                   76% in FY11.
                                                                                  Widespread branch network has enabled AUM diversification
                                                                                   with South now contributing 65% of the total AUM as
                                                                                   compared to 87% in FY11.

     AUM Break-up Evolving Into A More Pan India Player                Region Wise Branch Network                      Rural Urban Mix
                FY12                          Q1 FY17
            5% 4%                                                           6%        11%                                 16%
                                              12%                                                                                 22%
      8%
                                         8%
                                                                                15%
                                                                                                                       32%
                                        15%                                                   68%                                 30%
                                                     65%
                     83%

    South     West     North   East   South   West      East   North       South      North   East   West      Rural   Urban    Semi Urban    Metro

Manappuram Finance Ltd @ 2016                                                                                                                    18
COMPANY OVERVIEW:
 SHAREHOLDING SUMMARY

                             Share Price Performance                      Market Data                             As on 05.08.2016
   100
                                                                          Market Capitalization (Rs mn)             72,564.84
    80                                                                    Price (Rs)                                  86.25
    60                                                                    No. of Shares Outstanding (mn)              841.3
                                                                          Face Value (Rs)                              2.0
    40
                                                                          Avg. Trading Volume (Rs mn)                 367.67
    20                                                                    Avg. Trading Volume (mn shares)              5.85
     0                                                                    52 Week High-Low (Rs)                     87.85-19.8
     Apr-16           May-16         Jun-16           Jul-16   Aug-16
                                                                        Source – BSE

                         % Shareholding – June 2016                      Key Institutional Investors at June 16      % Holding
                                                                         Baring India Private Equity Fund            12.57%
                                                                         Goldman Sachs (Singapore)                    1.03%
                                                                         WF Asian Reconnaissance Fund Ltd             4.53%
                                Public,
                                                                         Ashish Dhawan                                2.91%
                                19.59%
                                          Promoter,                      DSP Blackrock Microcap Fund                  3.06%
                DII, 9.25%                 34.36%
                                                                         Morgan Stanley Asia (Singapore)              1.97%
                                                                         Meryll Lynch Capital Markets                 1.21%
                                FII, 36.80%                              BRIC II Mauritius Trading                    1.54%
                                                                         Mousseganesh Ltd                             1.32%

   Source – Company                                                     Source – BSE, Bloomberg

Manappuram Finance Ltd @ 2016                                                                                                    19
COMPANY OVERVIEW:
 EXPERIENCED MANAGEMENT TEAM

  Mr. V. P. Nandakumar            Mr. B.N. Raveendra Babu          Mr. Kapil Krishan
  Managing Director & CEO         Executive Director               Group Chief Financial Officer
                                                                    24 years experience with
   Chief Promoter of              Director since July 1992
                                                                     organizations such as
    Manappuram Group               Worked in a senior role
                                                                     CRISIL, HSBC, Standard
   Certified Associate of          with Blue Marine
                                                                     Chartered, Hewitt
    Indian Institute of Bankers     International in U.A.E
                                                                     Associates, India Infoline

  Mr. Aloke Ghosal                Mr. Mohan Vizhakat               Mr. Romin Farooq
  CEO – Housing Finance           Group Chief Technology officer   CEO – Insurance
   Over 23 years experience       Associated with the Indian      Over 20 years experience
    with organizations such as      Government and leading           in Business Administration,
    Muthoot Housing Fin,IDBI        companies of India and           Business Development,
    Home Fin, Tata Home Fin         Middle East in Information       Claims and Key
    etc.                            Technology                       Management

  Mr. Raja Vaidhyanathan          Mr. K Senthil Kumar               Mr. M.A. Marshal Suresh
  Managing Director – MFI         Head – Commercial Vehicle         SVP – HR
   Erstwhile Promoter of          Over 19 years experience         Over 30 years experience
    Asirvad Microfinance            with organizations such as        in HR and Operations. He
   IIT IIM Alumni with over 33     Fullerton India Credit,ABF        has worked in VGN Group,
    years of experience across      Business, Indiabulls              Good Ocean Maritime, DP
    industries                      Financial Services etc.           World, Polaris Software etc

Manappuram Finance Ltd @ 2016                                                                       20
COMPANY OVERVIEW:
 CORPORATE GOVERNANCE – STRONG BOARD OF DIRECTORS

                             Former Chairman of HDFC Bank, former Deputy Governor of Reserve Bank of India, former Chairman of
        Mr Jagdish Capoor     UTI and BSE Ltd
    CHAIRMAN, INDEPENDENT &  Currently, he is on the Board of Indian Hotels Company Limited, Assets Care Enterprise Limited, Indian
     NON-EXECUTIVE DIRECTOR   Institute of Management, LIC Pension Fund Limited and is the Chairman of Quantum Trustee Company
                              Private Limited.

                                  Bachelor of Technology in mechanical engineering from IIT Mumbai, MSc in Operations Research from
                                   Case Western Reserve University and PhD degree in Operation Research and Human Letters from
       Mr. Shailesh J Mehta        California State University and in Computer Science and Operations Research from Case Western Reserve
         INDEPENDENT &             University.
     NON-EXECUTIVE DIRECTOR       Over 38 years of experience, was President of Granite Hill Capital Ventures, Chairman and CEO of
                                   Providian Financial Corporation, operating general partner of West Bridge Capital, President and COO of
                                   Capital Holding and Executive Vice President of Key Corp

                                  He is a Fellow of the Institute of Chartered Accountants in England & Wales
        Mr. E. A. Kshirsagar
                                  He was associated with the Management Consultancy division of A F Ferguson for over three decades
        NOMINEE DIRECTOR
                                   and retired in 2004 as the Senior Partner

                                  He is a Fellow of the Institute of Financial Services, London and Masters in Management Sciences, from
                                   University of Bombay.
        Mr Pradeep Saxena
                                  He has worked in Senior Management Positions of various International Banks.
        NOMINEE DIRECTOR
                                  At present he is engaged in the areas of Financial Services, Heavy Industry , Information Technology and
                                   Education

Manappuram Finance Ltd @ 2016                                                                                                                 21
COMPANY OVERVIEW:
 CORPORATE GOVERNANCE – STRONG BOARD OF DIRECTORS

       Mr P. Manomohanan         Bachelor of Commerce from Kerala University, Diploma in Industrial finance from Indian Institute of Bankers
         INDEPENDENT &            and also a Certified Associate of the Indian Institute of Bankers
     NON-EXECUTIVE DIRECTOR      Has over 38 years of work experience in the RBI and in the regulatory aspects of NBFCs

          Mr. Rajiven V. R.      He holds a Bachelor of Science degree and has completed his LLB from Govt. Law College, Trivandrum
         INDEPENDENT &           Shri Rajiven brings to the Board a wealth of experience in areas like Leadership and Staff management,
     NON-EXECUTIVE DIRECTOR       Strategic Management, Financial Control / Budgeting, Team Development etc.

                                 Bachelor of Science from Mumbai University, Masters in Biochemistry from GS Medical College, Mumbai.
        Dr. Amla Samanta
                                 She is Managing Director of Samanta Organics Pvt Ltd, Tarapur & Ashish Rang Udyog Pvt Ltd.
         INDEPENDENT &
                                 She has served on the boards of HDFC Bank & HDFC Securities. Prior to this she was consultant bio-chemist
     NON-EXECUTIVE DIRECTOR
                                  at Lilavati Hospital

       Mr V. R. Ramchandran      He holds a Bachelor of Science from the Calicut University and a Bachelor degree in law from the Kerala
         INDEPENDENT &            University.
     NON-EXECUTIVE DIRECTOR      He has over 32 years of work experience and is a civil lawyer enrolled with the Thrissur Bar Association.

Manappuram Finance Ltd @ 2016                                                                                                                   22
COMPANY OVERVIEW:
 DIVIDEND HISTORY – CONSISTENT DIVIDEND PAYOUT

                          Dividend Per Share & Dividend Pay Out as % of PAT over the last decade

                                                                                      60.5%    66.9%
                                                                                                       55.9%
                                                                                                               44.9%

        19.8%    19.5%    18.6%                                             21.2%
                                   10.4%    11.7%     13.9%
                                                                  7.9%
                                                                                               1.80    1.80    1.80

                                                                             1.50      1.50

                                                                  0.60

                           0.09     0.10     0.13
         0.03     0.04                                 0.03

        FY05     FY06      FY07    FY08     FY09       FY10       FY11       FY12      FY13    FY14    FY15    FY16
                                       Dividend per share (Rs )          Dividend payout (%)

                                            Consistent Dividend Paying Record

Manappuram Finance Ltd @ 2016                                                                                          23
COMPANY OVERVIEW:
 STRONG BRAND RECALL

      Strong Brand Equity built over the years. Have gained mileage from
       our celebrity endorsements in terms of enhanced visibility and
       growing business.
      Brand Manappuram is endorsed by well recognized film industry
       icons from all major regions of India.
      Our brand ambassadors - Venkatesh, Mohan Lal, Puneeth
       Rajkumar, Vikram, Akshay Kumar, Mithun Chakraborty, Sachin
       Khedekar And Uttam Mohanty.

Manappuram Finance Ltd @ 2016                                               24
COMPANY OVERVIEW:
 STRONG SYSTEMS AND INTERNAL PROCESSES
                    In-house IT Infrastructure
      Availability of accurate and real-time information
       aids in faster decision making and reduced
       turnaround time resulting in improved loan                                Asset Evaluation & Appraisal Risk
       disbursement facility                                              Decades of experience provide a competitive
      Significant automation at front end reducing human                  advantage in terms of ability to evaluate the
       intervention                                                        gold
      Centralized technology for offsite surveillance of                 Only household used jewellery encouraged as
       all branches (efficient monitoring and                              security (emotional factor is key)
       controlling)                                                       Employees are regularly trained in gold
      Scalability enables rapid branch roll-out                           appraisal methods
      State of art Disaster Recovery Centre                              Several tests for checking spurious gold
        Strong Internal Controls / Audit                                   including touchstone test, nitric acid test,
       Stringent collateral approval process                              sound test and checking for hallmark
       Pledges frequently checked by an                                  Three level appraisal of gold
        internal audit team at 45 day to
        confirm quality and quantity of gold,
        KYC and other documents                             Gold Security & Custodial Risk
                                                              Post verification gold transferred to highly secured Vaults
                      Prevention of Fraud                      which have RCC structures or Burglary proof safes of
            Strict KYC compliance                             reputed brands
            Employee profiling, Employee tracking            Gold stored under joint custody (Dual Custody)
             and regular rotation of staff across             Premises located above ground floor, with 24x7 CCTV
             departments and branches                          camera and burglar alarm system
                                                              Insurance of gold against burglary

Manappuram Finance Ltd @ 2016                                                                                                25
COMPANY OVERVIEW:
 TECHNOLOGY INNOVATIONS STRENGTHENS BUSINESS PROCESSES & SCALABILITY
     Company has set up the Manappuram Centre of Excellence and Innovation (MaCE Inn) at Bengaluru. Recently felicitated as the winner of KMA
                                                 NASSCOM IT Innovations award for 2014-15.
   Network enabled eLocker systems
                              Developed a network-enabled keyless eLocker system for the storage of gold.
                              These can be operated remotely in an automated mode by centrally managed software applications.
                              The automated operation will include opening, closing, auditing and remote monitoring of such lockers and gold
                               assets.
                              Key Impact –
                                      Enhanced Security
                                      Reduces the size of existing branches to small gold loan kiosks with built-in eLockers and manned by just two
                                       employees. Significant reduction in operating expenses.
   Technology enabled new offerings such as gold depository & on-line gold loan services

                           Customers who have availed the gold depository services will automatically become eligible for gold loan, up to the LTV
                            limits.
    ON-LINE GOLD
                           Customers can apply for the Loan from anywhere online. Loan within permissible limits of LTV can be disbursed to a
    LOAN SERVICES           customer’s bank account or eWallet card online, almost instantly, 24/7.
                           Substantial reduction in Transactional and Operational cost.

        GOLD               The depository centres will allow the customers to handover the custody of their gold assets primarily for safekeeping.
     DEPOSITORY            The highly secured gold depository centres will be built around an array of keyless eLockers within a strong room.
      SERVICES             Customers can view their assets online through remote IR cameras, placed inside eLockers.

Manappuram Finance Ltd @ 2016                                                                                                                         26
DISCUSSION SUMMARY

   QUARTERLY UPDATE

   ABOUT US – COMPANY OVERVIEW

   UNDERSTANDING OUR EVOLUTION

   BUSINESS STRATEGY INITIATIVES

   INDUSTRY OVERVIEW

   ANNEXURE

Manappuram Finance Ltd @ 2016       27
UNDERSTANDING OUR EVOLUTION
 PHASE 1 – FY08- FY12
                                                     Strong Growth Witnessed….                                                                                                                            Higher Loan To Value (LTV) up to 85%
                                                                                                                                                                  2908                                    Lower Cost of Funds due to Eligibility under
 150                                                                                                                                                                                            3000       Priority Sector Lending
                                                                                                                              2064                                        116
                                                                                                                                                                                                2250      Supported by Buoyant Economic Growth
 100
                                                                                                                                  75                                                                      Long Tenure Products supported by Rising Gold
                                                                                           1005                                                                                                 1500
                                                                                                                                                                                                           Prices
  50                                                     645
                     436                                                                                                                                                                        750
                                                                                                  26                                                                                                      Strong Competitive Positioning - Better LTV,
                              8                               12
                                                                                                                                                                                                           Lower interest rate compared to Moneylenders,
    0                                                                                                                                                                                           0
                   FY 08                               FY 09       FY 10                                              FY 11                                       FY 12
                                                                                                                                                                                                           Prompt Disbursement, Convenience of
                                                         AUM (Rs. Bn)                                           No of Branches                                                                             Place/time
                                            Supported by Rising Gold Prices….
 1900                                                         Gold Price (US Dollars)
             GOLD PRICES US$                                                                                                                                                                           Company witnessed a CAGR of ~95% in AUM
 1400                                                                                                                                                                                                               over FY08-12.
                                                                                                                                                                                                        Branch Network grew by 7x over FY08-12.
  900

  400                                                                                                                                                                                                      Strong Execution Capabilities and well
        Jan-07

                          Jul-07

                                            Jan-08

                                                              Jul-08

                                                                                Jan-09

                                                                                                  Jul-09

                                                                                                                    Jan-10

                                                                                                                                      Jul-10

                                                                                                                                                        Jan-11

                                                                                                                                                                          Jul-11

                                                                                                                                                                                            Jan-12
                                                     Apr-08

                                                                                                                                                                 Apr-11
                 Apr-07

                                                                                         Apr-09

                                                                                                                             Apr-10
                                   Oct-07

                                                                       Oct-08

                                                                                                           Oct-09

                                                                                                                                               Oct-10

                                                                                                                                                                                   Oct-11

                                                                                                                                                                                                              defined Systems and processes.
Source - Bloomberg

Manappuram Finance Ltd @ 2016                                                                                                                                                                                                                              28
UNDERSTANDING OUR EVOLUTION
 PHASE 2 – FY12- FY14

                          Regulatory Overhang Impact….                Regulatory Changes by RBI-

     150                                                                 Mar - 2012 : Removal of Priority Sector
                                  116                                     Lending Status – led to Higher Borrowing
                                                   100                    Cost.
     100                                                     82
                   75                                                    Mar - 2012 : Cap on LTV to not exceed more
                                                                          than 60% -
      50
                                                                                 Weakened the Competitive
                                                                                  positioning vis-à-vis Banks and
       0
                                                                                  Moneylenders.
                  FY 11            FY 12            FY13     FY14
                                       AUM (Rs. Bn)                              Higher LTV Focused customers moved
                                                                                  to Moneylenders whereas Interest
                          Along with Falling Gold Prices….
                                                                                  Rate sensitive customers moved to
     1900    GOLD PRICE (US $)                                                    Banks.
     1600                                                                Cap on Maximum Borrowing upto Rs. 2.5 mn.
                                                                      Fall in Gold Prices –
     1300
                                                                         Peak LTV was 85% for FY12 and Long Tenure
     1000
                                                                          portfolio.
      700                                                             Negative Operating Leverage resulted into fall in
        04/12 08/12 12/12 04/13 08/13 12/13 04/14 08/14 12/14 04/15   Return Ratios and Profitability.
  Source - Bloomberg

Manappuram Finance Ltd @ 2016                                                                                             29
UNDERSTANDING OUR EVOLUTION
 PHASE 3 – FY15 ONWARDS

                             On a Revival Path…..
                                                                                            Sept – 2013 : Regulatory Changes by RBI-
      150                                 AUM (Rs Bn)
                   116                                                                         Increased the loan-to-value (LTV) ratio for gold
                               100                                            106
                                                                96                              loans to 75 per cent -
      100                                      82
                                                                                                       Resulting into Level Playing Field for NBFCs
                                                                                                        vis-a-vis the commercial banks .
       50
                                                                                            Jan-2014 : Reaching out to the Customers
        0                                                                                              Through enhanced Marketing and Branch
                 FY12         FY13             FY14             FY15          FY16                      Activation Initiatives
                                                                                            June – 2014 : De-Linking to Gold Prices –
                         Witnessing the Growth Back…
                                                                                               Shift from Long Tenure products to short Tenure
                                                                        27,970                  products (3 to 9 Months)
                                                      23,018
                                                                                               Recalibrated loan to value (LTV) ratio to link it to
                                                           11,138                   8,650
                             4,941                                                              the tenure of the loan.
                                                                                                       Maximum permissible LTV of 75% to be
        -2,849                                                                                          available on loans of shorter tenure rather
                                                                                                        than one year.
              -15,862                -17,906
                                                                                            Positive Operating Leverage to kick in which would
            FY13                FY14                     FY15                  FY16         result into better Return Ratios and Profitability.
                       New Book (In Rs mn)            Net Growth (In Rs mn)
  Note - * Net Growth = New Book - Auction

Manappuram Finance Ltd @ 2016                                                                                                                          30
DISCUSSION SUMMARY

   QUARTERLY UPDATE

   ABOUT US – COMPANY OVERVIEW

   UNDERSTANDING OUR EVOLUTION

   BUSINESS STRATEGY INITIATIVES

   INDUSTRY OVERVIEW

   ANNEXURE

Manappuram Finance Ltd @ 2016       31
BUSINESS STRATEGY – KEY HIGHLIGHTS

                                           CURRENT BUSINESS STRATEGY

                       STRENGTHEN THE CORE                    ADDITION OF SYNERGISTIC NEW
                            BUSINESS –                                  BUSINESS
                        GOLD LOAN BUSINESS                             SEGMENTS

                    De-Linking the Gold Business from Gold
                     Prices                                      Leveraging the Strong Brand Equity &
                                                                  Existing Retail Customer Base
                    Focus on Branch Activations through
                     increased Incentives & Performance          Addition of new synergistic Product
                     Scorecard                                    segments – Microfinance, Mortgage &
                                                                  Housing Finance, CV Lending
                    Enhanced Marketing Initiatives

Manappuram Finance Ltd @ 2016                                                                            32
BUSINESS STRATEGY:
 GOLD LOAN BUSINESS – DE-LINKED FROM GOLD PRICES
                                                                                                                               Additional 2 month for
   Earlier Scenario - 12 month Long Tenure Product                   12 months – Single Product Offering
                                                                                                                                      Auction

  Gold value                              100
                                                                                                                              If the Customer does not
  LTV                                     75%
                                                                                                                                pay or close the Loan,
  Gold Loan                                75
                                                                                                                             then there is likely loss of
  Interest Rate                           24%
                                                                                                                                 interest for 2 months
  Interest Cost*                           21
                                                                                                                                    during Auction
  Total Principal + Interest*              96
                                Recalibrated the product structure to de-Link from gold price fluctuation.
                                Loan to value (LTV) ratio is now linked to the tenure of the loan. Therefore, the maximum permissible LTV of 75%
                                 would be available on loans of shorter tenure rather than one year as was the standard practice earlier.
     Current Revised Scenario - 3 to 6 month Short                                                                             Additional 2 month for
                                                            3 months       6 months         9 months         12 months
                   Tenure Products                                                                                                    Auction
                                                            3 Month         6 Month          9 Month          12 Month
                                                                                                                              If the Customer does not
                                                            Scenario        Scenario         Scenario          Scenario
                                                                                                                                pay or close the Loan,
  Gold value                                                  100             100              100               100
                                                                                                                             there is a ample margin of
  LTV                                                         75%             70%              65%               60%
                                                                                                                             safety to recover Principal
  Gold Loan                                                    75              70               65                60
                                                                                                                               as well as Interest. Also,
  Interest Rate                                               24%             24%              24%               24%
                                                                                                                               Linkage to Gold prices is
  Interest cost*                                               7.5            11.2             14.3              16.8
                                                                                                                                      Negligible.
  Total Principal + Interest*                                 82.5            81.2             79.3              76.8
                                                                                           *#Includes interest outgo during 2 months of auctioning period
    *Product Allocation is a dynamic process and varies depending upon market conditions

Manappuram Finance Ltd @ 2016                                                                                                                               33
BUSINESS STRATEGY:
 GOLD LOAN BUSINESS – REACHING OUT TO THE CUSTOMER
        Strategic initiatives to drive business performance -
           Increased marketing initiatives across branches and key markets.
           Significantly enhanced our marketing spend with growing BTL and ATL activities.
           Increased incentives and branch activations.
           Initiative to track branch level performance scorecard.

Manappuram Finance Ltd @ 2016                                                                 34
BUSINESS STRATEGY:
 INTRODUCING NEW SYNERGISTIC PRODUCT SEGMENTS

          CAPITAL AVAILABILITY
                                                             STRONG BRAND EQUITY                                ADDITION ON NEW
        Current Capital Adequacy at                                                                          SYNERGISTIC PRODUCT
                                                          EXISTING RETAIL CUSTOMER
         22.3% compared to the
                                                                    BASE                                          SEGMENTS –
         minimum 15% as stipulated by
         the RBI.                                           PAN INDIA DISTRIBUTION
                                                                                                              MICROFINANCE
                                                                   PRESENCE
        Gearing levels at ~3.8x                                                                              MORTGAGE & HOUSING
         leaving ample scope for                              RELATIONSHIPS WITH                              COMMERCIAL VEHICLES
         increase in leverage.                                      LENDERS

   RATIONALE FOR STARTEGY TO DIVERSIFY INTO SYNERGISTIC PRODUCT SEGMENTS -

       Strategy to Utilise surplus capital to build or acquire new lending products relevant to the existing retail customer base.

       To leverage the strong retail customer base, retail branch network and the strong Manappuram Brand Equity build over the
        years.

       To Leverage our operational capability to process large volume, small ticket lending transactions with semi-urban and rural
        customers.

       Focus to enhance the revenue mix and improve structural return on equity (RoE).

Manappuram Finance Ltd @ 2016                                                                                                         35
BUSINESS STRATEGY:
 DIVERSIFY INTO SYNERGISTIC PRODUCT SEGMENTS
                      EACH NEW BUSINESS HAS A DEDICATED BUSINESS HEAD AND A SEPARATE OPERATING TEAM WITH
                                               EXTENSIVE AND RELEVANT INDUSTRY EXPERIENCE.
                      NEW BUSINESSES EXPECTED TO CONTRIBUTE UPTO 20 - 25% OF TOTAL AUM IN THREE YEARS.

                                                                                               COMMERCIAL VEHICLES
     MICROFINANCE SEGMENT                                HOUSING SEGMENT
                                                                                                   SEGMENT
     Acquired a majority stake (85%) in             Started commercial operations in        Launched loans for commercial
      Asirvad Microfinance Private Limited,           January 2015.                            vehicles, selectively in Southern and
      one of the leading microfinance                                                          Western India.
                                                     Current loan portfolio stood at
      institutions in Tamil Nadu in February
                                                      Rs 1,705 mn as on June 30, 2016.        Current loan portfolio stood at
      2015.
                                                                                               Rs 1,684 mn as on June 30, 2016.
                                                     Focus on Affordable Housing for Mid
     Eight-year old NBFC – MFI with
                                                      to Low income Group.                    Focus on Underserved Category of
      operations in Tamil Nadu, Kerala and
                                                                                               Customers who do not have access to
      Karnataka.                                     To open more branches in urban and
                                                                                               Formal Banking system.
                                                      semi-urban locations in South and
     Current Loan Portfolio stood at
                                                      West of India.                          To open more branches in Rural and
      Rs 12,368 mn as on June 30, 2016.
                                                                                               semi-urban locations.
     Credit Rating Improved from BBB- to
      A-.
     Focus on Low Income Borrower.
     To expand into other states
      leveraging Manappuram’s Network.

Manappuram Finance Ltd @ 2016                                                                                                          36
BUSINESS STRATEGY:
 NEW PRODUCT SEGEMENT PROFILE

       Particulars (As of June 2016)                       Microfinance             Housing Finance                   CV
       AUM (Rs mn)                                           12,368                    1,705                        1,684
       Branch Network                                             428                   26                          37 *
       Number of States                                           13                        5                        9
       Average Ticket Size (Rs lacs)                              0.2                  14.41                        5.24
       Average Yield (%)                                     24.0%                     14.5%                       19.0%

       * CV Branches are co-located with the Gold Loan Branches

       Share of New Business in Consolidated AUM expected to increase from 12.0% to ~25% over the next 2-3 years

                                                           New Business Segment AUM (Rs mn)

    Jun-16                                           Rs 16,688 mn

     FY18                                                                                                          Rs 50,000 mn

                                         Microfinance         HFC       CV    Other Loans

Manappuram Finance Ltd @ 2016                                                                                                     37
BUSINESS STRATEGY:
 ASHIRWAD MICROFINANCE – GROPRAPHICAL PRESENCE

                                               Having presence through 428 branches spread across 11
                                                States and 2 Union territories in India.
                                               Branch network has enabled AUM diversification with South
                                                now contributing 73% of the total AUM as compared to 79%
                                                in FY16.

                                                 AUM Break-up Evolving Into A More Pan India Player
                                                         FY16                           Q1 FY17
                                                     5%                                  9%

                                                   16%
                                           0%                                          18%
                                                                                  0%
                                                            79%                                73%

                                           South     West       North   East   South    West      North   East

Manappuram Finance Ltd @ 2016                                                                                    38
DISCUSSION SUMMARY

   QUARTERLY UPDATE

   ABOUT US – COMPANY OVERVIEW

   UNDERSTANDING OUR EVOLUTION

   BUSINESS STRATEGY INITIATIVES

   INDUSTRY OVERVIEW

   ANNEXURE

Manappuram Finance Ltd @ 2016       39
INDUSTRY OVERVIEW:
 INDIA GOLD MARKET

             India possesses over ~20,000 tonnes of gold worth more than US$ 800 bn.
                         Organized gold loan sector penetration is Just 3% !

            India is the largest consumer of gold jewellery in the world - Together with China, it makes up over half the
             global consumer demand for gold.

                    Region wise Share
                                                         •   Southern India has been the largest market accounting for
                                15%
                                          40%
                                                             approximately 40% of the gold demand, followed by the western
                           20%                               region at approximately 25% of India's annual gold demand.

                                  25%
                South        West         East   North
            Further, Rural India is estimated to hold around 65% of total gold stock. For Rural India gold is the virtually the
             bank account of the people - As historically gold has been an good hedge against inflation & since it is fairly
             liquid, a lot of savings are in the form of gold.

                                                                                                                                   40
Source – WGC – World Gold Council, ICRA
INDUSTRY OVERVIEW:
KEY DRIVERS FOR GOLD LOAN MARKET

             Advantage Consumer                              Advantage Lender

   Idle gold can be monetized for productive    Collateral / Security is with the lender – No
    purposes.                                     requirement to reposes.
   Prompt Disbursement - Faster turnaround      No Liquidity Issues – Gold is one of the
    time.                                         most liquid asset class.
   Minimal Documentation - No major             No Asset Liability Mismatch – Loan assets
    documentation requirement.                    are for 3 to 6 months whereas liabilities are
   Flexible repayment options available.         for 1 year and above.
                                                 One of the lowest NPA segment

           LEADING TO A WIN-WIN SITUATION FOR ALL THE STAKEHOLDERS

                                                                                                  41
INDUSTRY OVERVIEW:
COMPETITIVE ADVANTAGE - GOLD LOAN NBFC’S
          Parameter                  Gold loan NBFC's                       Banks                        Moneylenders
 LTV                                    Up to 75%                   Lower LTV than NBFC's               Higher than 75%
                                                                 Processing charges are much
 Processing Fees               No / Minimal Processing Fees                                            No Processing Fees
                                                                  higher compared to NBFC's
                                                                                                  Usually in the range of 36% to
 Interest Charges                     ~18% to 24% p.a                 ~12% to 15% p.a
                                                                                                             60% p.a.
                                                               Not highly penetrated. Selective
 Penetration                         Highly Penetrated                                                 Highly Penetrated
                                                                           Branches
                           Cash/Cheque (Disbursals More than
 Mode of Disbursal                                                         Cheque                             Cash
                                  Rs. 0.1 mn in Cheque)
 Working Hours                Open Beyond Banking Hours            Typical Banking Hours          Open Beyond Banking Hours
 Regulated                           Regulated by RBI                 Regulated by RBI                   Not Regulated
 Fixed Office place for    Proper Branch with dedicated staff                                     No fixed place for conducting
                                                                       Proper Branch
 conducting transactions              for gold loans                                                        business
 Customer Service            High – Gold Loan is a Core Focus             Non Core                         Core Focus
 Documentation Requirement Minimal Documentation, ID Proof         Entire KYC Compliance            Minimal Documentation
                              Flexible Re-Payment Options.
                               Borrowers can pay both the       EMI compulsorily consists of
 Repayment Structure /
                               Interest and Principal at the       interest and principal.                      -
 Flexibility
                                          closure.            Pre-Payment Penalty is Charged.
                                No Pre-Payment Charges.
 Turnaround Time                        10 minutes                        1-2 hours                        10 minutes

                                         NBFC’s RETAIN NICHE POSITIONING
                                                                                                                                   42
DISCUSSION SUMMARY

   QUARTERLY UPDATE

   ABOUT US – COMPANY OVERVIEW

   UNDERSTANDING OUR EVOLUTION

   BUSINESS STRATEGY INITIATIVES

   INDUSTRY OVERVIEW

   ANNEXURE

Manappuram Finance Ltd @ 2016       43
COMPANY OVERVIEW:
  FINANCIAL SUMMARY
                        AUM & Disbursements                                                                  Yields, Cost of Funds & Spread Analysis
                      CAGR: Disbursements – 4.4%
                                                                    375,863                          27.3%
     316,982                                                                                                       21.7%       23.2%        23.0%            23.0%
                                                      246,830
                     205,163         202,925                                                         14.7%                     12.9%
                                                                                                                   13.2%                    12.3%           12.0%
  116,308      99,563                                           114,330
                                               95,935
                               81,631                                                                12.6%
                                                                                                                   8.5%        10.3%        10.7%           11.0%

     FY12            FY13         FY14         FY15                 FY16                             FY12            FY13      FY14          FY15            FY16
                               AUM     Disbursements                                                         Net Yields       COF (%)           Spread (%)
     Return Ratios & Capital Adequacy                                     NII & Profitability Analysis                                  Asset Quality
   23.4%
                                                                18.3%                                                                       1.2%     1.2%
                         27.7% 25.7%                                                   11.3%     12.1%     13.7%                   1.1%
                                            24.0%                           10.4%                                                                              1.0%
   27.5%     22.7%                                              15,229
                                                                                                         14,128                                 1.0% 1.0%
                                                                                                                            0.6%
                                            12.8%                         10,571 10,494 10,908                                           0.7%                        0.7%
             8.6%       9.2%       10.6%
                                                                   5,915
   6.0%                                                                        2,084               2,713     3,534             0.3%
             1.7%                    2.4%      3.0%                                      2,260
                            1.9%

   FY12      FY13       FY14     FY15   FY16                     FY12       FY13       FY14      FY15    FY16               FY12   FY13 FY14         FY15 FY16
           ROA (%)        ROE (%)     CAR (%)                                  NII       PAT        NIM (%)                           GNPA (%)         NNPA (%)

Manappuram Finance Ltd @ 2016                                                                                                                                          44
COMPANY OVERVIEW:
 OPERATIONAL SUMMARY
                         Branch Distribution                                                                     AUM Break-up (Region Wise)
                     CAGR: Branch Addition – 3.2%
      2,064          2,908      3,295      3,293      3,293                                           1,15,551    99,563          81,631         92,693      100,806
        5%            5%         5%         5%        6%                                                   4%         6%            7%             8%            8%
       12%           11%        11%        11%       11%                                                   8%         11%          13%             13%           12%
       10%           14%        14%        14%       15%                                            5%           8%             10%        11%             15%

       73%           70%        70%        70%       68%                                                  83%         75%          70%             68%           65%

       FY12          FY13     FY14         FY15      FY16                                                 FY12        FY13         FY14        FY15              FY16
                        South   North       West    East                                                                South     North     West East
                Operational Efficiency                                   Productivity (Rs mn )                         Customer Base (mn) & Avg. Ticket Size
                                                               CAGR: AUM/employee - 9.2%                                     CAGR: Customer Addition – 11.7%

                                                            32.8     32.6                                             38,582 37,462
                         7.7%     7.6%     8.1%                                                           31.3                                                   32,463
    7.1%                                                                        27.5         27.0                                         31,681    30,446
              6.4%
                                                                                                                                                                 2.6
                                                                                                                       1.6       1.5       1.5       1.8
                                                      4.4          5.9       5.4       5.7          6.2

    FY12      FY13      FY14     FY15      FY16        FY12        FY13    FY14    FY15   FY16                        FY12    FY13    FY14    FY15     FY16
                       Opex to AUM (%)                             Average AUM per Employee                           No Of Customers      Average Ticket Size in Rs.

Manappuram Finance Ltd @ 2016                                                                                                                                             45
FOR FURTHER QUERIES:

                                                   DISCLAIMER :
                                                   This presentation and the contents therein are for information
                                                   purposes only and does not and should not construed to be any
                                                   investment or legal advice. Any action taken or transaction pursued
   Mr. Kapil Krishan                               based on the basis of the information contained herein is at your
   Group Chief Financial Officer                   sole risk and responsibility and Manappuram Finance or its
                                                   employees or directors, associates will not be liable in any manner
   Contact No : +912226674311                      for the consequences of any such reliance placed on the contents
   Email – kapilk@manappuram.com                   of this presentation. We have exercised reasonable care in checking
                                                   the correctness and authenticity of the information contained herein,
                                                   but do not represent that it is true, accurate or complete.
                                                   Manappuram Finance or associates or employees shall not be in
                                                   anyway responsible for any loss or damage that may arise to any
   Mandar Kapse / Nilesh Dalvi                     person from any inadvertent error or omission in the information
   Dickenson Seagull IR                            contained in this presentation. The recipients of this presentation
                                                   should make their own verifications and investigations to check the
   Contact No : +91 9867550004 / + 91 9819289131
                                                   authenticity of the said information if they wish. Manappuram
   Email – mandar.kapse@dickensonir.com            Finance and/or directors, employees or associates may be
           nilesh.dalvi@dickensonir.com            deemed to have interests, financial or otherwise in the equity shares
                                                   of Manappuram Finance.

Manappuram Finance Ltd @ 2016                                                                                         46
You can also read