An evaluation of fyke nets as a sampling tool for the Murray-Darling Basin Fish Survey in turbid northern Basin rivers - Michael Hutchison and ...
←
→
Page content transcription
If your browser does not render page correctly, please read the page content below
An evaluation of fyke nets as a sampling tool for the
Murray-Darling Basin Fish Survey in turbid northern
Basin rivers

Michael Hutchison and Andrew Norris

June 2016
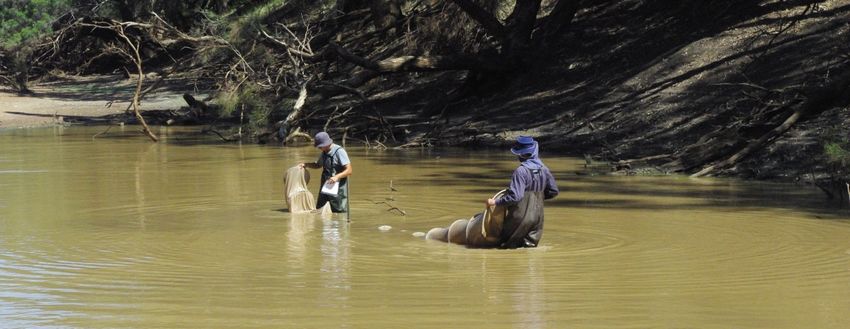
This publication has been compiled by Michael Hutchison and Andrew Norris, Animal Science, Department of Agriculture and
Fisheries.

© State of Queensland, 2016

The Queensland Government supports and encourages the dissemination and exchange of its information. The copyright in
this publication is licensed under a Creative Commons Attribution 3.0 Australia (CC BY) licence.

Under this licence you are free, without having to seek our permission, to use this publication in accordance with the licence
terms.

You must keep intact the copyright notice and attribute the State of Queensland as the source of the publication.

Note: Some content in this publication may have different licence terms as indicated.

For more information on this licence, visit http://creativecommons.org/licenses/by/3.0/au/deed.en

The information contained herein is subject to change without notice. The Queensland Government shall not be liable for
technical or other errors or omissions contained herein. The reader/user accepts all risks and responsibility for losses,
damages, costs and other consequences resulting directly or indirectly from using this information.

Cover photos: Neosilurus hyrtlii captured in a fyke net. A pair of fykes set in the Balonne River. Setting fykes in turbid water in
the Balonne River near St George. Images by David Nixon and Andrew Norris, Department of Agriculture and Fisheries.
Summary
The Murray-Darling Basin (MDB) Fish Survey is currently reliant on electrofishing and un-baited bait
traps to sample fish populations. Water clarity can impact on the efficiency of these methods. Highly
turbid waters are prevalent across much of the Condamine, Warrego and Paroo systems. Therefore,
it was considered some key species or life stages could be missed by electrofishing and bait traps in
these catchments. In response to this, a comparison of fish catches using the current MDB sampling
techniques with fish catches in fine meshed fyke nets (a method perhaps less affected by turbidity)
was carried out to evaluate the extent to which fyke nets could add value to the current survey
techniques in highly turbid northern Basin rivers.

During the 2015/16 MDB Fish Survey use of day-set fykes and overnight-set fykes was trialled at
fixed MDB Fish Survey sites in Queensland sections of the Condamine, Warrego and Paroo River
Valleys. The fixed sites in these river valleys are characterised by highly turbid water; the majority of
sites sampled had Secchi depths of 10 cm or less. Fyke netting was run in conjunction with the
standard MDB Fish Survey techniques of electrofishing and unbaited bait traps. The fyke nets used in
this study were of the same dimensions as those used in the Sustainable Rivers Audit (SRA) pilot
work, but the mesh size used in the current survey was 1 mm square (or 2 mm stretched), in contrast
to the 10 mm mesh used in the SRA pilot. At each site fyke nets were set in three back-to-back pairs
in water less than 1 m deep.

The fine-meshed fykes used in this survey captured species of fish not captured by electrofishing,
whereas bait traps did not capture any additional species to those captured by electrofishing.
Additional species detected by fykes on a site by site basis included Freshwater catfish, Silver perch,
Australian smelt and Hyrtl’s tandan. Overnight set fykes were also very effective at detecting juvenile
Golden perch and large numbers of Carp gudgeons at sites where few or none were detected by
electrofishing or bait traps. Juvenile Golden perch detected by overnight set fykes were too small to
have been stocked fish, and therefore are evidence of natural recruitment. Most size classes of
Golden perch detected by electrofishing would require genetic fingerprinting or calcein tagging of
stocked individuals for reliable conclusions of natural recruitment. Overnight set fykes also detected
significantly more Un-specked hardyhead than electrofishing. Overnight set fykes indicated that
Hyrtl’s tandan was a common species at some sites, yet electrofishing and bait traps failed to detect
any.

Electrofishing was better than overnight set fyke nets at capturing large Golden perch, Bony bream,
Carp, Murray cod and Eastern gambusia. Overnight fyke netting and electrofishing therefore
complement each other well. Day set fykes also detected additional species to electrofishing, but at
fewer sites than overnight set fykes. With the exception of Carp gudgeons, total captures of fish were
usually higher in overnight set fykes than in day set fykes, especially in the case of Hyrtl’s tandan and
juvenile Golden perch.

It is concluded that reliance on electrofishing and bait traps alone in turbid waters provides a biased
estimate of the fish assemblage and population structure. Addition of overnight set fine meshed fykes
to MDB fish surveys in turbid sites may substantially improve estimates of relative abundance of
native fish, native fish biomass and native fish recruitment.

It is recommended that overnight set fine mesh fykes be added to the sampling regime for the three
highly turbid northern Murray-Darling Basin river valleys. Use of overnight fyke nets will increase
sampling time and slightly increase operational costs, but will also significantly improve the detection
of key fish species and life history stages that are essential for evaluating the success of
environmental watering strategies such as those proposed under the Basin Plan.
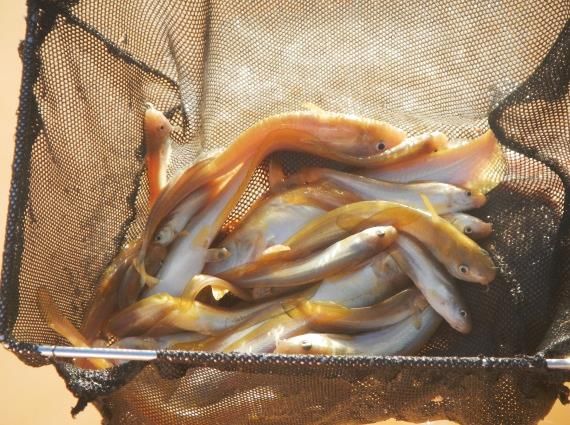
Table of contents
Introduction........................................................................................................................................... 1
Methods ................................................................................................................................................. 2
 Sampling period and sites .................................................................................................................... 3
 Sampling gear and gear operation ....................................................................................................... 3
   Electrofishing ...................................................................................................................................... 4
   Bait traps ............................................................................................................................................ 4
   Fykes .................................................................................................................................................. 4
 Water quality ........................................................................................................................................ 7
 Recording of the fish catch ................................................................................................................... 7
 Data presentation and statistical analyses ........................................................................................... 7
Results .................................................................................................................................................. 8
 Water quality data ................................................................................................................................ 8
 Species detected .................................................................................................................................. 9
 Hyrtl’s tandan N. hyrtlii ....................................................................................................................... 12
 Golden perch M. ambigua .................................................................................................................. 14
 Carp gudgeons Hypseleotris spp. ...................................................................................................... 16
 Spangled perch L. unicolor ................................................................................................................. 19
 Bony bream N. erebi .......................................................................................................................... 20
 Un-specked hardyhead C. s. fulvus ................................................................................................... 22
 Rainbowfish M. s. tatei and M. fluviatilus ........................................................................................... 23
 Carp C. carpio .................................................................................................................................... 25
Discussion .......................................................................................................................................... 26
Conclusions and recommendations................................................................................................. 29
Acknowledgements ............................................................................................................................ 30
References .......................................................................................................................................... 30
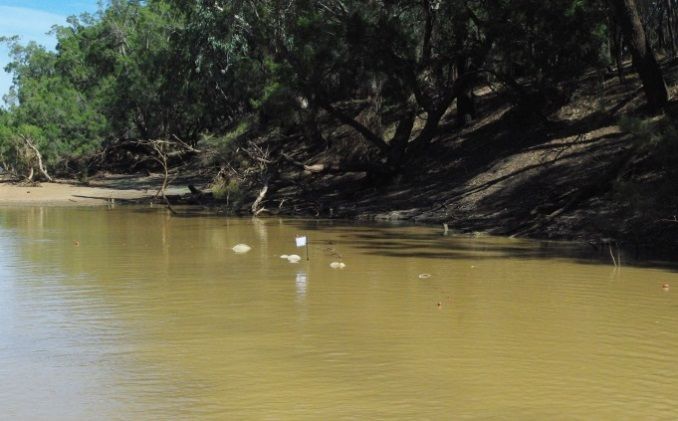
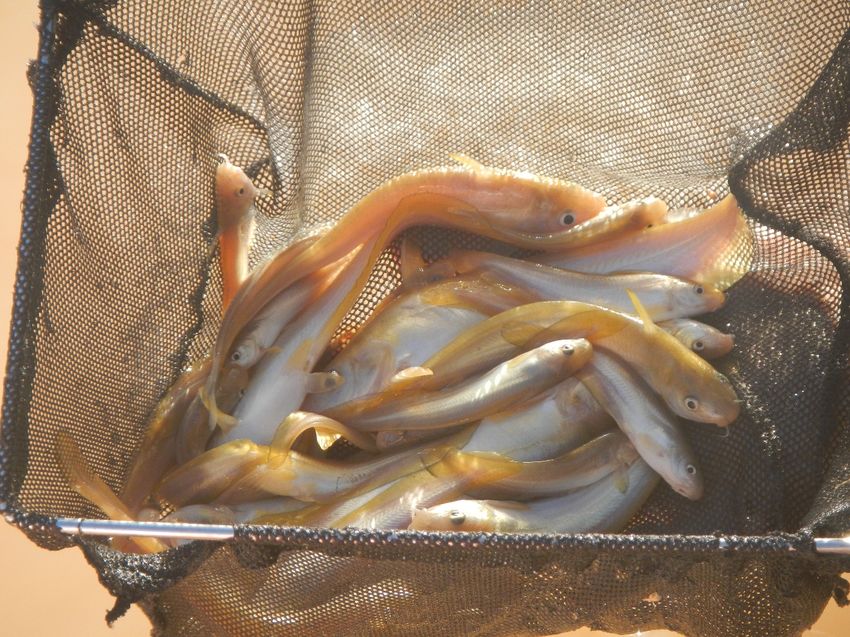
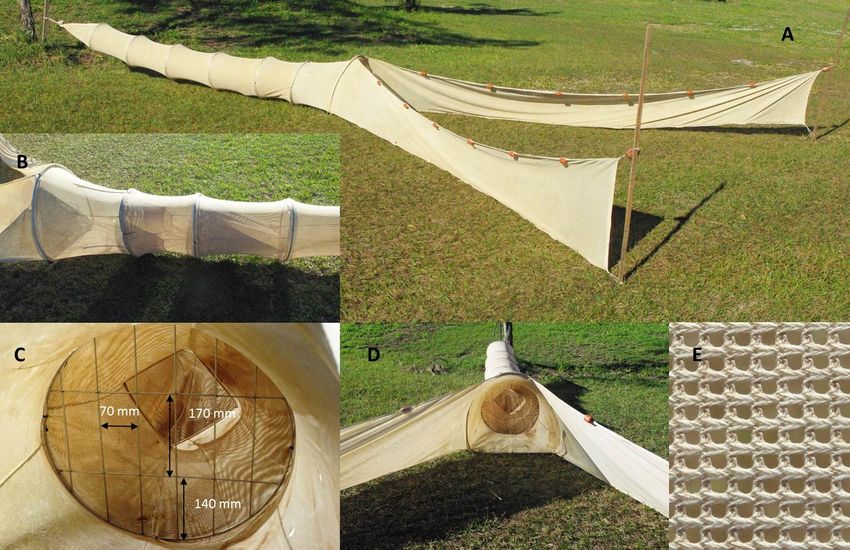
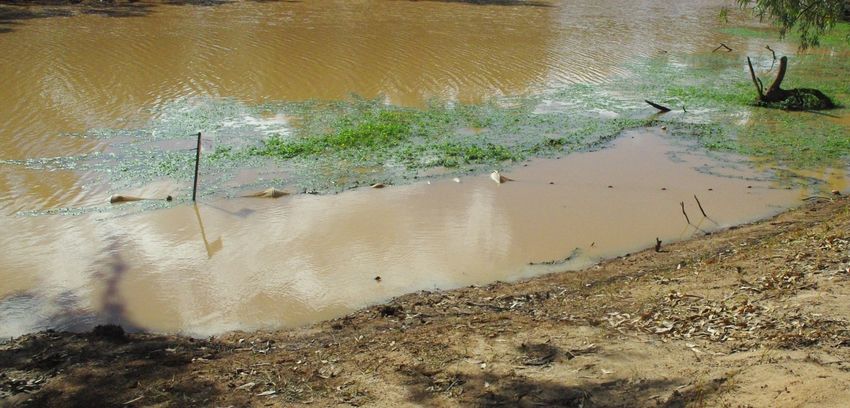
Table of figures
Figure 1- Fyke net showing: A) Fyke with two 5 m wings and cod end. B) Entrance tunnel profile with
two internal cones C) Turtle excluder on the first ring with dimensions of grids labelled. D) 60 cm D-
shaped entrance to fyke. E) Close up of fyke net mesh. Openings between rows of fibre are
approximately 1 mm (2mm on a stretched diagonal). ............................................................................ 6
Figure 2- A pair of fykes set back to back near Eulo in the Paroo River. Note the floats in the cod-ends
providing an air pocket. Also note the highly turbid water. ..................................................................... 6
Figure 3- Length frequency distributions of Hyrtl’s tandan captured by day set and overnight set
fykes. .................................................................................................................................................... 14
Figure 4- Length frequency distributions of Golden perch captured by boat electrofishing, day set
fykes and overnight set fykes. .............................................................................................................. 16
Figure 5- Length frequency distributions of Carp gudgeons captured by boat electrofishing, day set
fykes and overnight set fykes. .............................................................................................................. 18
Figure 6- Length frequency distributions of Spangled perch captured by boat electrofishing, day set
fykes and overnight set fykes. .............................................................................................................. 20
Figure 7- Length frequency distributions of Bony bream captured by boat electrofishing, day set fykes
and overnight set fykes. ....................................................................................................................... 22
Figure 8- Length frequency distributions of Un-specked hardyheads captured by boat electrofishing,
day set fykes and overnight set fykes. ................................................................................................. 23
Figure 9- Length frequency distributions of Murray-Darling rainbowfish captured by boat
electrofishing, day set fykes and overnight set fykes. .......................................................................... 25
Figure 10- Part of a Hyrtl’s tandan catch from a fyke set in the Paroo River. ...................................... 28
Table of tables
Table 1- MDB Fish Survey sites used for assessment of fyke netting in comparison with existing MDB
Fish Survey Techniques. ........................................................................................................................ 3
Table 2- Representative water quality samples from the study sites at the time of survey .................... 9
Table 3- Species of fish captured by valley, site and sampling method ............................................... 10
Table 4- Number of fish species detected at each site by different sampling methods. Numbers in
brackets in the two right hand columns show additional species detected when combining fyke data
with existing MDB Fish survey (electrofishing and bait trap) sampling method data. .......................... 11
Table 5- Mean number of species captured per site by different sampling methods. Means not sharing
a letter in common are significantly different from each other (p
Table 19- Mean number of Bony bream captured per site by different sampling methods. Means not
sharing a letter in common are significantly different to each other (p
Introduction
The Murray-Darling Basin Authority (2015) described the Murray-Darling Basin (MDB) Fish Survey as
a program that monitors Basin-scale fish condition and supports tracking of the high-level fish targets
identified in Schedule 7 of the Basin Plan (Murray-Darling Basin Authority 2012), as well as more
specific targets identified in the basin-wide environmental watering strategy (Murray-Darling Basin
Authority 2014). However, targeted programs are also required to evaluate certain aspects of the
strategy’s outcomes. Data collected by the MDB Fish Survey are used to calculate various metrics
and indicators that provide a measure of the health of the fish assemblage in key river valleys. These
metrics were initially used in the Sustainable Rivers Audit. Metrics include proportion of native fish
abundance, proportion of native species and proportion of native biomass, recruitment by proportion
of taxa, recruitment by proportion of sites and recruitment by proportion of abundance. These metrics
in turn are used to form indices of fish nativeness and fish recruitment. There are also metrics that are
used to calculate an expectedness indicator, based on species actually caught compared to what
would be expected to be caught in a hypothetical pre-European reference condition (Robinson 2012).

The MDB Fish Survey has monitoring sites in all of the major catchments (river valleys) of the Murray-
Darling Basin, including five sites in each of the Paroo, Warrego and Condamine river valleys
respectively. These are the three most northern river catchments in the Murray-Darling Basin. The
three catchments are characterised by intermittent flow and turbid waters. These systems contain a
number of fish species that are uncommon or absent in more southern catchments including Hyrtl’s
tandan Neosilurus hyrtlii and Spangled perch Leiopotherapon unicolor (Lintermans 2009).

Current sampling methods for the MDB fish survey include the use of electrofishing (boat and/or back
pack) and unbaited bait traps (Murray-Darling Basin Authority 2015). Unbaited bait traps caught very
few fish in the Paroo, Warrego and Condamine valleys in the 2014/15 round of sampling for the MDB
Fish Survey. Unbaited traps have apparently been effective at catching small fish at sites in other
catchments (Faragher and Rodgers 1997; Murray-Darling Basin Commission 2004). It is possible that
the highly turbid waters of the northern Murray-Darling Basin rivers may be reducing the effectiveness
of unbaited traps as a sampling tool. Turbidity is also known to reduce the effectiveness of
electrofishing (Reynolds 1983: Lyon et al. 2014). Highly turbid water can make it difficult for netters to
detect stunned fish, especially those that remain below the surface. Secchi depths of less than 10 cm
are common in the northern basin. High turbidity associated with river discharge negatively influenced
the capture probability of four large-bodied species by electrofishing in the southern Murray-Darling
Basin (Lyon et al. 2014). Increasing fish length up to 500 mm increased the detection of Murray cod,
after which detectability decreased (Lyon et al. 2014). Reynolds (1983) suggested a dome-shaped
relationship between turbidity and efficiency of electrofishing capture. In very clear waters fish may
move to deeper water where they are less susceptible to electrofishing or they may be more able to
see the boat and avoid capture. With some turbidity fish may sit shallower or be less likely to see the
boat and avoid capture (Kirkland 1962), whereas at high turbidity levels stunned fish are less visible to
dip netters.
To counter the effects of high turbidity on electrofishing efficiency Hutchison et al. (2008) used
continuous blind sweeps of nets in figure-of-eight movements, alternating between near the surface
and the bottom substrate. This resulted in captures of fish not seen by the netter, thereby increasing
total catch. Fish that were visible to the netter were deliberately targeted between blind sweeps. The
MDB Fish survey does not use blind sweeping during electrofishing and therefore netters only net
what they can see. However, even blind netting is still not effective at detecting certain species of fish
in highly turbid water. Blind netting during electrofishing has been used extensively in the northern

An evaluation of fyke nets, Department of Agriculture and Fisheries, 2016                                 1
Basin during various Queensland Department of Agriculture and Fisheries (DAF) research projects.
Some species, most notably N. hyrtlii and Porochilus rendahli were occasionally caught by
electrofishing in turbid waters, using blind netting, but were more frequently captured in fyke nets DAF
catch data).

In the 2014/15 round of sampling of the MDB Fish Survey, no N. hyrtlii or P. rendahli were captured in
the Paroo, Warrego or Condamine valleys using the existing MDB Fish Survey techniques of
electrofishing (without blind netting) and unbaited traps. The catfish P. rendahli is restricted to the
Condamine Valley in the Murray-Darling Basin, and is quite rare (Lintermans 2007 and DAF catch
records), thus the non-capture of this species is to be expected. However, N. hyrtlii is considered
relatively common in the lowland zone and to a lesser degree in the foothill zone of northern Murray-
Darling Basin catchments (Moffatt and Voller 2002). Therefore, non-capture of this species by the
MDB fish survey could either indicate non-representative sampling or a decline in this species.

The main fish objectives in Schedule 7 of the Basin Plan (Murray-Darling Basin Authority 2012) relate
to no loss or degradation in recruitment up until 2019 and improvements in recruitment beyond 2016.
More specific targets in the Basin-wide environmental watering strategy (Murray-Darling Basin
Authority 2014) include:
•   For short-lived species:
    - Restored distribution and abundance levels recorded pre-2007 (prior to major losses caused
         by extreme drought). This will require annual or biennial recruitment events depending on
         species.
•   For moderate to long-lived species (which includes N. hyrtlii):
    - Improved population structure (i.e. range of size/age classes and stable sex ratios where
         relevant).
    - A 10-15% increase of mature fish (of legal take size) for recreational target species in key
         populations.
    - Annual detection of species and life stages representative of the whole fish community
         through key fish passages.
•   By extending the range of existing populations and establishing additional populations, expanded
    distributions of key species are expected by 2024 including
    - A doubling of current (mostly restricted) distributions of key species in the northern Basin.

Given the apparent difficulty for electrofishing and unbaited traps to detect some key species
(including N. hyrtlii) in turbid northern rivers, it was decided to evaluate the effectiveness of fyke nets
as a supplementary fish sampling technique for northern Basin turbid rivers. If fykes could improve the
detection of some species or life stages, then addition of fyke nets to the sampling protocol may
improve assessment of how well the objectives and targets of the Basin Plan and Basin-wide
environmental watering strategy are being met.
Objectives for this study included

a) Determining if fykes improved detectability of N. hyrtlii
b) Determining if fykes improved detection rates of additional species
c) Determining if fyke nets improved detection of juvenile life stages of some species

Methods
One constraint of using fykes is that they must be set for at least several hours duration. This is
because fykes are a passive sampling method relying on fish to move into them. Traditionally fykes

An evaluation of fyke nets, Department of Agriculture and Fisheries, 2016                                     2
have been set overnight (from late afternoon to early morning). However, from a time management
perspective, it could be useful to set fykes for just a few hours during the day so that they operate
concurrently with electrofishing activities. For this reason it was decided to evaluate both day time
fyke net sets and overnight fyke net sets in this study. Fyke net sampling was carried out concurrently
with electrofishing and bait trap sampling for the MDB Fish survey in the 2015-16 sampling round in
the Paroo, Warrego and Condamine river valleys.
Sampling period and sites
The Condamine Valley was sampled in April 2016 and the Warrego and Paroo Valleys were sampled
in May 2016. Fykes were set at MDB Fish Survey sites only in the Queensland section of the river
valleys because prior Animal Ethics approvals and permits for use of fykes were in place in
Queensland. Given the rapid turn-around time for this project there was insufficient time to organise
Animal Ethics and Fisheries permit approvals for use of fykes in the New South Wales (NSW) sites.
Five sites were sampled by fyke netting, electrofishing and trapping in the Warrego valley, four sites
were sampled in the Condamine valley and two sites in the Paroo valley. The sites are listed in Table
1. MDB Fish survey sites in the NSW parts of the valleys were sampled by electrofishing and bait
traps only, as per the Murray-Darling Fish Survey Protocol (Murray-Darling Basin Authority 2015).
However, the NSW sites are not included in this document.
Table 1- MDB Fish Survey sites used for assessment of fyke netting in comparison with
existing MDB Fish Survey Techniques.
Valley Site name Site code Latitude Longitude
Condamine St George Reserve 66784 -28.07319 148.57560
Condamine Lower Plains 66787 -28.33060 148.38647
Condamine Kings Creek Aides Bridge 66813 -27.92699 151.86162
Condamine Surat Weir 72902 -27.14816 149.06075
Warrego Cunnamulla Weir 70501 -28.11224 145.68675
Warrego Tickleman Gardens 64271 -27.86651 145.66999
Warrego Glenco Waterhole 64285 -28.20121 145.70705
Warrego Bakers Bend 70531 -26.69224 146.12953
Warrego Ward River Waterhole 64304 -26.47991 146.10105
Paroo Caiwarro Waterhole 64332 -28.73724 144.73874
Paroo Eulo Bridge 64346 -28.16109 145.03784
Sampling gear and gear operation
Sampling at each site consisted of a combination of boat electrofishing, bait trapping, day-time fyke
netting and overnight fyke netting. Both electrofishing and bait trapping are outlined in the current
MDB Fish Survey protocol (Murray-Darling Basin Authority 2015), whereas fyke netting does not
currently form part of the protocol. For that reason fyke sampling is described in more detail than
electrofishing and bait trapping.
An evaluation of fyke nets, Department of Agriculture and Fisheries, 2016 3Electrofishing All electrofishing followed the methods outlined in the Murray-Darling Basin Fish Survey Protocol MDB2 (Murray-Darling Basin Authority 2015). At all Queensland MDB Fish Survey sites all habitat types were accessible to electrofishing boats. Therefore back-pack electrofishing was not necessary according to the Fish Survey protocol. Kings Creek was sampled by small electrofishing boat, using a single netter and all other Queensland sites were sampled by a large electrofishing boat using two netters. Twelve ninety-second (accumulated power on time) boat electrofishing shots were used at each site. Netters dip-netted all stunned fish that they could see or detect in the water from cues such as splashing and swirls. These were placed into a 150 L live well for processing at the end of each shot. Bait traps Use of bait traps followed the Murray-Darling Basin Fish Survey protocol (Murray-Darling Basin Authority 2015). At each site 10 bait traps were deployed in water less than 1 m depth. Traps were set in slow flowing or backwater areas independent from electrofishing. Traps were not baited and trap captures were pooled as a single event in each site. Traps were set for the duration of the electrofishing sampling period and were cleared after approximately 2.5 hours. Any captured fish were placed into a 20 L bucket of river water for processing. Traps were cleared before retrieval of day-set fykes. Fykes Fykes rely on fish movements to passively capture fish. Wings are used to guide fish into an entrance and then through a series of funnels into a holding chamber called a cod end. Fyke nets used in this study had a 60 cm D entrance. A stainless steel wire grid fitted to the first ring behind the D in each fyke was used to exclude most turtles, although smaller specimens could still enter. The first ring had a diameter of 55 cm. Vertical grids were spaced 70 mm apart and horizontal grids 170 mm apart (Figure 1). This satisfied Animal Ethics requirements and also prevented large turtles from damaging the net and preying on fish in the fyke net. The grids allowed most size classes of fish to pass into the fyke nets, but would have prevented larger Murray cod and carp from entering. Each fyke had two 5 m wings with a 60 cm drop; the top of each wing was fitted with floats and the bottom of each wing was threaded with a leaded cord. Fyke nets consisted of 1 mm thick knotless mesh with 1 mm spaces between rows (Figure 1). Mesh openings were 1 mm square or 2 mm on a stretched diagonal. The fine mesh allowed adequate water exchange and prevented gilling or meshing of small fish. This design maximises survival of fish in the fyke. Coarser netting tends to mesh some species (including rainbowfish and olive perchlet), while small juveniles and small species like Carp gudgeon can easily escape. Cone entries were fitted to the first two rings after the D entrance, leading into a cod end (Figure 1). The cones minimise the chance of fish escaping from the cod end. A float was placed in the cod-end of each fyke to provide an air pocket for any air breathing animal that may have accidentally entered the fyke (Figure 2). Six fykes were set per site in three back to back pairs in water less than 1 m deep and greater than 40 cm deep at the D (Figure 2). Cod ends were tied to a labelled stake. Back to back pairing meant that fish moving either upstream or downstream could be caught. An evaluation of fyke nets, Department of Agriculture and Fisheries, 2016 4
Fyke wings were set approximately 5 m wide. In still water, fyke wings were fixed in place with
snapper leads attached to the outer lower end of each wing. In flowing waters wings were staked for
additional stability. In flowing waters fykes were set in locations sheltered from the main current to
reduce the risk of wings becoming dislodged and to reduce the potential impact of debris.

Day time fyke sets were set prior to the onset of electrofishing and cleared at the end of all
electrofishing activity and after clearing of all bait traps; a set period of approximately three hours.
Overnight fyke sets were set late in the afternoon and cleared the next morning. Electrofishing did not
occur within 30 m of fyke nets. As far as was possible, day fyke sets were set in different locations to
night fyke sets to avoid sampling interference. Most sites had ample sandbank, backwater and
shallow marginal habitat for this to be possible. However, this was not the case at the Kings Creek
site or the Surat site, where only narrow shelves of suitable depth or low velocity water were available
for fyke netting. In these cases fyke net pairs were reset at the same point locations. At the Surat site
overnight fykes were set first, and at the Kings Creek site day-time fykes were set first.

A fyke net was cleared by drawing the wings into the D frame, then untying the cod end from the
stake. The fyke was then dragged horizontally through the water towards the shore or boat for
processing. The dragging motion created a current to wash all fish towards the rear of the cod end.

The fyke cod-end was then dropped vertically into a 20 L bucket of river water or into a 60 L plastic
tub (Nally bin) of river water. The cod end was opened up to allow fish to enter the water. Gentle
shaking of the cod end was used to dislodge fish into the water. The cod end was also visually
examined and any remaining fish were picked out by hand and placed into the container of water.

An evaluation of fyke nets, Department of Agriculture and Fisheries, 2016                                   5
Figure 1- Fyke net showing: A) Fyke with two 5 m wings and cod end. B) Entrance tunnel
profile with two internal cones C) Turtle excluder on the first ring with dimensions of grids
labelled. D) 60 cm D-shaped entrance to fyke. E) Close up of fyke net mesh. Openings
between rows of fibre are approximately 1 mm (2mm on a stretched diagonal).

Figure 2- A pair of fyke nets set back to back near Eulo in the Paroo River. Note the floats in
the cod-ends providing an air pocket. Also note the highly turbid water.

An evaluation of fyke nets, Department of Agriculture and Fisheries, 2016                         6
Water quality
The water quality parameters turbidity, conductivity and water temperature were recorded at all sites.
All three parameters can influence the efficiency of electrofishing (Reynolds 1983). Conductivity and
water temperature were recorded at each site at 10 cm depth using a YSI water quality meter.
                                                                  -1
Conductivity was recorded as micro Siemens per cm (µS.cm ). Higher conductivity readings indicate
higher salinity levels. Turbidity was recorded as Secchi depth. Secchi depth was determined using a
Secchi disc. A Secchi disk is marked with black and white quadrants. The disc is lowered into the
water by a cord with depth markings. The depth at which the black and white quadrants are no longer
visible from the surface is the Secchi depth. Secchi depth was recorded to the nearest centimetre. As
turbidity increases, Secchi depth decreases.

Recording of the fish catch
Identification, measurement and counting of fish captured by electrofishing and bait traps followed the
procedures outlined in the Murray-Darling Basin Fish Survey protocol MDB2 (Murray-Darling Basin
Authority 2015). All fish captured by bait trap and electrofishing were identified and counted. For bait
traps the catch is pooled at each site and the first 50 of each species are measured. Total catch of
individual fish by bait traps was well below 50 at all sites sampled. In electrofishing at each site the
                                                                                                  th
sub-sampling began with the first individual captured of each species and continued to the 50
                                                           th
individual. For electrofishing, in the shot where the 50 individual of a species was found, all
individuals of that species in the shot were measured to avoid sampling bias. After that shot, any
further individuals of that species that were captured were counted, but not measured.

Measurement and counting of fish from fykes (both day and night sets) followed similar protocols to
those described for electrofishing shots in MDB2, where the first 50 fish of a species caught by fykes
                           th
were measured. If the 50 fish fell within a particular fyke shot then all fish of that species were
measured in that shot to avoid size sampling bias, then just counted in all following shots. However, at
one Condamine Valley site, fykes captured several thousand individuals of Carp gudgeons. It was not
practical to measure all fish past a count of 50 in the first fyke, both from a time management
perspective and fish welfare perspective. In that instance, an additional 10 fish were measured
beyond 50 to reduce sampling bias, but no more were measured as it was feared holding such large
numbers of fish in containers for the duration of measuring many hundreds of individuals could lead to
oxygen stress.

In cases where catches of small fish (mainly Carp gudgeons) in fykes were estimated to exceed 500
individuals in a shot, accurate counts were made of 100 individuals of the most abundant species and
then volumetric sub-samples in soft mesh dip nets were used to estimate abundances of that species
to speed up processing times and reduce stress on fish. Less abundant species were picked from the
sub-samples for counting and measurement. Such estimation techniques were not required for
electrofishing or bait traps as numbers captured per shot were much lower.

Data presentation and statistical analyses
All individual species captured were tabulated by site captured and sampling method used. The
number of species (species richness) captured by each method at each site was also tabulated.

An evaluation of fyke nets, Department of Agriculture and Fisheries, 2016                                  7
th
All statistical analyses were carried out using the software package GenStat (16 edition). The total
number of species caught by each of the sampling methods was evaluated by a generalised linear
model (GLM) using a normal distribution, with identity link function and with sampling event and
method as fixed effects. This was followed by a post hoc pairwise comparison of sampling methods
with Fisher’s least significant difference (LSD) test. The number of additional species detected by
adding day set fykes or night set fykes to the existing MDB Fish survey methods (electrofishing and
unbaited bait traps) were also analysed by GLM, using a normal distribution and identity link function,
with fyke method and sampling event as fixed effects.
For the more common species, abundance of each species captured by each gear type was also
examined by GLM, using a Poisson distribution (to account for large numbers of zero values) with a
log link function. The dispersion parameter set in each model used the estimate function and was
based on residual mean deviance. Sampling event and method were used as factors in the models.
For most species bait traps captured no individuals at all sites. Therefore, bait traps were excluded
from most analyses of abundance by gear type. For any given species, any sampling method that
recorded zero captures across all sites was excluded from any analyses for that species, but the raw
data are still presented in tabular form in this report. If a sampling method had zero captures across
all sites for a relatively common species, then it was assumed that method was not effective for that
species. Temperature, conductivity and Secchi depth were initially run as covariates in the GLM
models, but were not found to have any significant effect and were therefore dropped from the final
analyses.
For any GLM model that showed a significant effect for sampling method, a post hoc pairwise LSD
test was run for sampling method. Catch rates are presented as back-transformed means.
Unspecked hardyheads Craterocephalus stercusmuscarum fulvus were only captured at one site
(Kings Bridge). They were relatively abundant at this site, even though absent at all other sites.
Sampling gear was compared within this site using the Chi-square test for equal proportions.
Length frequency histograms were generated for pooled data across all sites for the more abundant
species captured by fykes and/or electrofishing. Length frequency distributions were compared
between pairs of sampling methods with the non-parametric Kolmogorov-Smirnoff test. This was to
determine if different capture methods were biased towards certain size classes. Bait traps did not
capture enough individuals of any species for length frequency analyses to be meaningful, therefore
bait traps were not included in length frequency analyses.
Results
Water quality data
Table 2 shows water quality data by site. Secchi depth ranged from 5 to 49 cm. Therefore all sites
would be classified turbid. Nine of the eleven sites used in this study had Secchi depths of 10 cm or
-1
less, which is highly turbid. Conductivity ranged from 60 to 1168 µS.cm . Boat electrofishers can
-1
operate in this range, but the effective field for stunning small fish would be reduced at 1168 µS.cm
compared to the other conductivity levels observed. Water temperatures ranged from 16.9 to 25.8º C.
Water temperature can affect activity levels of fish, but the temperatures observed were not extreme.
An evaluation of fyke nets, Department of Agriculture and Fisheries, 2016 8Table 2- Representative water quality samples from the study sites at the time of survey
Valley Site Representative water quality samples from time of fish survey
-2
Temperature °C Conductivity μS.cm Secchi depth cm
Paroo 64332 16.9 82 5
Paroo 64346 19.1 72 8
Warrego 64271 19.5 122 10
Warrego 64285 16.9 114 8
Warrego 64304 21.2 125 6
Warrego 70501 21.6 102 29
Warrego 70531 21.4 121 8
Condamine 66813 25.8 1168 49
Condamine 72902 23.2 60 6
Condamine 66784 24.5 196 9
Condamine 66787 24.1 173 10
Species detected
Table 3 shows species captured by sampling method, valley and site. A total of 15 fish species, 12
native and three non-native species were captured across the eleven sites. Note the Hypseleotris
species complex is treated as if a single species in this context, although it is likely several species of
Hypseleotris were captured. The Environment Protection and Biodiversity Conservation Act (EPBC)-
listed species Murray cod Maccullochella peelii peelii was captured only by electrofishing. The EPBC-
listed Silver perch Bidyanus bidyanus (a single specimen) was captured only by overnight set fykes.
Hyrtl’s tandan Neosilurus hyrtlii was captured only by day and night set fyke nets. Night set fykes
captured this species at six sites, whereas day set fykes captured this species at just four sites.
Freshwater catfish Tandanus tandanus was captured at only two sites, one specimen by
electrofishing and one individual by overnight set fykes.
An evaluation of fyke nets, Department of Agriculture and Fisheries, 2016 9Table 3- Species of fish captured by valley, site and sampling method
Valley Paroo Paroo Warrego Warrego Warrego Warrego Warrego Condamine Condamine Condamine Condamine
Site 64332 64346 64271 64285 64304 70501 70531 66813 72902 66784 66787
E, FON,FYD E, FON, FYD E, FON, FYD E, FON, FYD E, FON, FYD E, FON, FYD E, FON E, E, FON E, FON, FYD E, FON, FYD
NEMERE
E, FYD E, FYD E, FON, FYD FYD E FON
RETSEM
FON, FYD FON, FYD FON, FYD FON, FYD FON FON
NEOHYR
FON E
TANTAN
E, FON, FYD
CRASTE
E, FON, FYD E E, FON
MELFLU
E E, FON, FYD E E E
MELSPL
E, FON,FYD E, FON,FYD E, FON E, FON E, FON, FYD E, FON, FYD E, FYD E, FON, FYD E, FON, FYD E, FON, FYD
MACAMB
E E E
MACPEE
FON
BIDBID
E, FYD E, FON, FYD E, FON, FYD E, FON, FYD E, FON, FYD E E FON, FYD FON E, FON
LEIUNI
E, FON E, FON, FYD E, FON, FYD FON, FYD E, FON, FYD, T FON, FYD E, FON, FYD, T E, FON, FYD E, FON, FYD, T E, FON, FYD
HYPSPP
E, FON E E E, FON E E E E E E, FON E, FON
CYPCAR
E E E, FON E
CARAUR
E E E E E E E E, FON, FYD FON, FYD E, FYD
GAMHOL
Key. Species codes: NEMERE Nematalosa erebi Bony bream, RETSEM Retropinna semoni Australian smelt, NEOHYR Neosilurus hyrtlii Hyrtl’s tandan, TAN TAN Tandanus tandanus
Freshwater catfish, CRASTE Craterocephalus stercusmuscarum fulvus Un-specked hardyhead, MELFLU Melanotaenia fluviatilis Murray-Darling rainbowfish, MELSPL Melanotaenia splendida tatei
Desert rainbowfish MACAMB Macquaria ambigua ambigua Golden perch, MACPEE Maccullochella peelii peelii Murray cod, BIDBID Bidyanus bidyanus Silver perch, LEIUNI Leiopotherapon
unicolor Spangled perch, HYPSPP Hypseleotris spp Carp gudgeons, CYPCAR Cyprinus carpio Carp CARAUR Carassius auratus Goldfish, GAMHOL Gambusia holbrooki Eastern gambusia
Sampling methods code: E electrofishing, FON Fyke overnight set, FYD Fyke day-time set, T bait trap.
An evaluation of fyke nets, Department of Agriculture and Fisheries, 2016 10Murray-Darling rainbowfish Melanotaenia fluviatilis was captured only in Condamine Valley sites by all
methods except bait traps and the Desert rainbowfish Melanotaenia splendida tatei was captured only
in Warrego and Paroo Valley sites. The latter species was captured by electrofishing at five sites and
by day and night set fykes at just one site. Unspecked hardyhead C. s. fulvus was recorded at just
one Condamine valley site by electrofishing, and by both fyke sampling methods.
The only species (or species group) captured by bait traps was the Carp gudgeon species complex
Hypseleotris spp. But this species group was also captured by electrofishing, day set fykes and night
set fykes and was recorded at 10 of the 11 sites sampled.
The pest fish species carp Cyprinus carpio was captured at every site sampled. Carp were captured
by electrofishing at every site and also by overnight set fykes at four sites. Eastern Gambusia or
mosquitofish Gambusia holbrooki were recorded at 10 of the 11 sites sampled. They were mainly
captured by electrofishing, but were also captured by day set and overnight set fykes at three and two
sites each respectively.
Golden perch Macquaria ambigua were captured at ten sites. This species was captured by all
sampling methods except bait traps. Bony bream Nematalosa erebi were recorded at every site and
like golden perch were captured by electrofishing, day set fykes and overnight set fykes. Spangled
perch Leiopotherapon unicolor was recorded from ten sites. This species was captured by
electrofishing, day set fykes and night set fykes.
Table 4- Number of fish species detected at each site by different sampling methods. Numbers
in brackets in the two right hand columns show additional species detected when combining
fyke data with existing MDB Fish survey (electrofishing and bait trap) sampling method data.
Valley Site Number of fish species captured by sampling method
Electrofishing Bait Day set Overnight Fish Fish
boat trap fyke set fyke Survey Survey
(FYD) (FON) method method
+ FYD + FON
Paroo 64332 6 0 4 5 7 (+1) 8 (+2)
Paroo 64346 8 0 6 6 9 (+1) 9 (+1)
Warrego 64271 8 0 3 3 8 (0) 8 (0)
Warrego 64285 9 0 6 7 10 (+1) 10 (+1)
Warrego 64304 5 0 3 4 6 (+1) 6 (+1)
Warrego 70501 8 1 4 6 8 (0) 9 (+1)
Warrego 70531 6 0 2 3 7 (+1) 7 (+1)
Condamine 66813 10 1 5 3 11 (+1) 10 (0)
Condamine 72902 6 0 5 6 8 (+2) 8 (+2)
Condamine 66784 5 1 3 8 5 (0) 9 (+4)
Condamine 66787 8 0 4 7 8 (0) 9 (+1)
Table 4 shows the number of species captured by each sampling method at each site. It also includes
information on how many species were captured when combining either day or night fyke data with
An evaluation of fyke nets, Department of Agriculture and Fisheries, 2016 11electrofishing and bait trap (the current MDB fish survey method) data. Values in brackets indicate the number of additional species detected by adding the fyke methods. Additional species detected by day set fykes ranged from zero to two per site, with additional species being detected at seven of eleven sites. Additional species detected per site by overnight set fykes ranged from zero to four, with additional species being detected at nine of eleven sites. The GLM for number of species caught by method and sampling event (site) was significant for method (p
Table 6- Numbers of Hyrtl’s tandan captured by valley, site and method

    Valley         Site             Numbers of Hyrtl’s tandan captured by sampling method
                            Electrofishing boat       Bait trap       Day set fyke        Overnight set fyke
 Paroo          64332                  0                   0                  5                    64
 Paroo          64346                  0                   0                32                     57
 Warrego        64271                  0                   0                  0                     0
 Warrego        64285                  0                   0                15                     73
 Warrego        64304                  0                   0                  0                     0
 Warrego        70501                  0                   0                  0                     0
 Warrego        70531                  0                   0                  0                     0
 Condamine      66813                  0                   0                  0                     0
 Condamine      72902                  0                   0                  8                     9
 Condamine      66784                  0                   0                  0                     4
 Condamine      66787                  0                   0                  0                     2

Table 7- Summary of analysis for GLM of Hyrtl’s tandan catch by day set fykes and overnight
set fykes. Sampling method and sampling event (site) were factors in the model. The model
used a Poisson distribution with log link function.

                     Degrees of            Deviance               Mean         Deviance          Approx. F pr.
                       freedom                                 deviance           ratio
 Regression                11               648.97              58.998            19.98
Figure 3- Length frequency distributions of Hyrtl’s tandan captured by day set and overnight set fykes. Golden perch M. ambigua Table 8 shows the catch rates of Golden perch M. ambigua by the different sampling methods across the 11 sites sampled. At some sites electrofishing captured higher numbers of Golden perch than either fyke netting method, whereas at other sites fyke nets captured more Golden perch than electrofishing. The highest number of Golden perch captured at any one site (130) was by overnight set fykes. Bait traps failed to capture any Golden perch. The GLM model used to evaluate Golden perch catch rates for electrofishing, day set fykes and overnight set fykes across the 11 sites is shown in Table 9. The model was significant (p=0.009). Estimates of parameters (not shown in Table 9) showed that some parameters within sampling event (site) (p
Table 8- Numbers of Golden perch M. ambigua captured by valley, site and method

    Valley         Site             Numbers of Golden perch captured by sampling method
                            Electrofishing boat       Bait trap       Day set fyke          Overnight set fyke
 Paroo          64332                42                    0                    4                     8
 Paroo          64346                30                    0                    3                    10
 Warrego        64271                11                    0                    0                     5
 Warrego        64285                22                    0                    2                     3
 Warrego        64304                11                    0                    0                     9
 Warrego        70501                  1                   0                    3                     4
 Warrego        70531                11                    0                    1                     6
 Condamine      66813                  3                   0                    1                     0
 Condamine      72902                  3                   0                   12                    50
 Condamine      66784                  6                   0                   15                  130
 Condamine      66787                  9                   0                    1                     8

Table 9- Summary of analysis for GLM of Golden perch catch by electrofishing, day set fykes
and overnight set fykes. Sampling method and sampling event (site) were factors in the model.
The model used a Poisson distribution with log link function.

                     Degrees of            Deviance             Mean             Deviance          Approx. F pr.
                       freedom                                 deviance             ratio
 Regression                12               501.2                 41.76             3.31               0.009
 Residual                  20               252.3                 12.62
 Total                     32               753.5                 23.55

Table 10- Mean number of Golden perch captured per site by different sampling methods.
Means not sharing a letter in common are significantly different from each other (p
Figure 4 shows length frequency distributions for Golden perch captured by boat electrofishing, day set and overnight set fykes. The Kolmogorov-Smirnov two-sample test showed there were significant differences in the size distribution of Golden perch captured by boat electrofishing and day set fykes (p
Table 11- Numbers of Carp gudgeons Hypseleotris spp. captured by valley, site and method

    Valley         Site             Numbers of Carp gudgeons captured by sampling method
                            Electrofishing boat       Bait trap          Day set fyke        Overnight set fyke
 Paroo          64332                  0                   0                     0                     0
 Paroo          64346                  1                   0                     0                    11
 Warrego        64271                  8                   0                   71                     27
 Warrego        64285                  1                   0                   21                     26
 Warrego        64304                  0                   0                   18                     10
 Warrego        70501                15                    2                  242                   153
 Warrego        70531                  0                   0                     4                     1
 Condamine      66813                  4                   4                 3962                  2635
 Condamine      72902                  2                   0                     5                     3
 Condamine      66784                  5                   1                  108                   135
 Condamine      66787                  7                   0                   92                     59

The GLM model for Carp gudgeon catch rates for electrofishing, day set fykes and overnight set fykes
across the 11 sites is shown in Table 12. The model was significant (p
Table 13- Mean number of Carp gudgeons captured per site by different sampling methods. Means not sharing a letter in common are significantly different from each other (p
overnight set fykes were probably more effective at capturing some medium to large size classes and
day set fykes better at capturing some of the smaller size classes.

Spangled perch L. unicolor
Table 14 shows the numbers of Spangled perch captured by boat electrofishing, bait traps, day set
fykes and overnight set fykes across the 11 sample sites. Spangled perch were caught at ten of the
sites. Bait traps did not catch any spangled perch. The other sampling methods all captured Spangled
perch, but none of the methods captured very high numbers and none of the methods appeared to
dominate catches.

Table 14- Numbers of Spangled perch captured by valley, site and method

    Valley         Site            Number of Spangled perch captured by sampling method
                            Electrofishing boat       Bait trap       Day set fyke        Overnight set fyke
 Paroo          64332                  3                   0                1                      0
 Paroo          64346                  2                   0                3                      1
 Warrego        64271                  0                   0                0                      0
 Warrego        64285                16                    0                2                      9
 Warrego        64304                  1                   0                3                      2
 Warrego        70501                  1                   0                2                      3
 Warrego        70531                  2                   0                0                      0
 Condamine      66813                  6                   0                0                      0
 Condamine      72902                  0                   0                2                      4
 Condamine      66784                  0                   0                0                      1
 Condamine      66787                  3                   0                1                      0

The GLM model for Spangled perch captures by method and sampling event (site) was significant
(Table 15). However, none of the method parameters in the model was significantly different from the
reference level boat electrofishing. Most sites, excluding site 64285 (p
Table 16- Mean number of Spangled perch captured per site by different sampling methods. Means not sharing a letter in common are significantly different from each other (p
Table 17- Numbers of Bony bream captured by valley, site and method

    Valley         Site               Number of Bony bream captured by sampling method
                            Electrofishing boat       Bait trap       Day set fyke       Overnight set fyke
 Paroo          64332                98                    0                 8                    11
 Paroo          64346                51                    0                15                     3
 Warrego        64271                72                    0                10                     3
 Warrego        64285               119                    0                16                    17
 Warrego        64304               110                    0                 2                     4
 Warrego        70501                61                    0                 4                     1
 Warrego        70531                84                    0                 0                     1
 Condamine      66813                94                    0                 0                     0
 Condamine      72902                  7                   0                 0                     2
 Condamine      66784               130                    0                47                    24
 Condamine      66787                69                    0                21                    15

The GLM model for Bony bream captures by method and sampling event (site) was significant (Table
18). The method parameters in the model were significantly different (p
Table 19- Mean number of Bony bream captured per site by different sampling methods. Means not sharing a letter in common are significantly different to each other (p
equal proportions, from which it is concluded that the two fyke methods were significantly more
effective than electrofishing at capturing Un-specked hardyhead.

Figure 8 shows the length frequency distributions of Un-specked hardyheads captured by the two fyke
methods. Kolmogorov-Smirnov twosample testing showed no significant difference between the two
methods (p=0.499, 2 d.f.).

Figure 8- Length frequency distributions of Un-specked hardyheads captured by boat
electrofishing, day set fykes and overnight set fykes.

Rainbowfish M. s. tatei and M. fluviatilis
Data for the two rainbowfish species have been amalgamated for the analysis of catchability by gear
type. The desert rainbowfish M. s. tatei was only recorded in the Paroo and Warrego valleys, whereas
the Murray-Darling rainbowfish M. fluviatilis was only recorded in the Condamine valley. For this
analysis it was assumed the behaviour and catchability of the two rainbowfish species were
essentially the same. Table 20 shows the catch of Rainbowfish spp. by valley site and sampling
method. Rainbowfish were captured more consistently by electrofishing (i.e. at more sites).

The GLM model for Rainbowfish spp. captures by method and sampling event (site) was significant
(Table 21). However, method parameters in the model were not significantly different (p
Table 20- Numbers of rainbowfish captured by valley, site and method

    Valley         Site              Number of Rainbowfish captured by sampling method
                            Electrofishing boat       Bait trap       Day set fyke       Overnight set fyke
 Paroo          64332                  4                   0                 0                     0
 Paroo          64346                  7                   0                 5                     1
 Warrego        64271                  2                   0                 0                     0
 Warrego        64285                  3                   0                 0                     0
 Warrego        64304                  0                   0                 0                     0
 Warrego        70501                  1                   0                 0                     0
 Warrego        70531                  0                   0                 0                     0
 Condamine      66813                19                    0                21                    26
 Condamine      72902                  0                   0                 0                     0
 Condamine      66784                10                    0                 0                     0
 Condamine      66787                  6                   0                 0                     1

Table 21- Summary of analysis for GLM of Rainbowfish spp. catch by electrofishing, day set
fykes and overnight set fykes. Sampling method and sampling event (site) were factors in the
model. The model used a Poisson distribution with log link function.

                     Degrees of            Deviance             Mean           Deviance         Approx. F pr.
                       freedom                                 deviance          ratio
 Regression                12               244.39              20.366           8.36
14
12 Day fyke
10 Night fyke
8
Frequency
6
4
2
0
27- 30- 33- 36- 39- 42- 45- 48- 51- 54- 57- 60- 63- 65- 68- 71-
29 32 35 38 41 44 47 50 53 56 59 62 65 67 70 73
Fork length categories mm
Figure 9- Length frequency distributions of Murray-Darling rainbowfish captured by boat
electrofishing, day set fykes and overnight set fykes.
Carp C. carpio
Table 22 shows the number of Carp C. carpio captured by method valley and site. Electrofishing
captured carp at every site, whereas bait traps and day set fykes captured no arp. Overnight set fykes
captured carp at only 4 sites and in very low numbers.
Table 22- Numbers of carp captured by valley, site and method
Valley Site Number of Carp captured by sampling method
Electrofishing boat Bait trap Day set fyke Overnight set fyke
Paroo 64332 1 0 0 2
Paroo 64346 5 0 0 0
Warrego 64271 6 0 0 0
Warrego 64285 19 0 0 1
Warrego 64304 6 0 0 0
Warrego 70501 6 0 0 0
Warrego 70531 7 0 0 0
Condamine 66813 15 0 0 0
Condamine 72902 7 0 0 0
Condamine 66784 2 0 0 2
Condamine 66787 7 0 0 1
An evaluation of fyke nets, Department of Agriculture and Fisheries, 2016 25Based on Table 22, statistical analysis was not really essential to show a difference in the sampling
methods for carp. Nevertheless, a GLM for carp catch by method (boat electrofishing and overnight
fyke) and by sampling event (site) was run. The GLM is summarised in Table 23. The overall model
was significant, but none of the parameters for sampling event (site) were significantly different from
the reference level of Site 66784 (p>0.1). Overnight set fyke catches were significantly different from
the boat electrofishing (p=0.002). This reflects the generally higher and more consistent catch of carp
by boat electrofishing than by overnight set fykes. Not enough carp were captured by overnight set
fykes to warrant a length distribution comparison with carp captured by boat electrofishing.
Table 23- Summary of analysis for GLM of Carp catch by electrofishing and overnight set
fykes. Sampling method and sampling event (site) were factors in the model. The model used
a Poisson distribution with log link function.
Degrees of Deviance Mean Deviance Approx. F pr.
freedom deviance ratio
Regression 11 104.21 9.474 4.66 0.011
Residual 10 20.33 2.033
Total 21 124.55 5.931
Discussion
The sites sampled in this survey were highly turbid. Secchi depths recorded in some southern riverine
and anabranch sites include an average Secchi depth of 50 cm in the lower Murray, 48 cm between
Mildura and Euston, 57 cm in the Great Darling Anabranch and 78 cm in the lower Darling River in
2005/06 (Gilligan 2007). In 2006/07 average Secchi depth reported for the lower Murray River
downstream of Mildura was 76 cm and for the Murray River between Euston and Mildura the average
Secchi depth was 68 cm. The lower Darling River had an average Secchi depth of 42 cm and the
Great Darling anabranch an average Secchi depth of 55 cm (Gilligan 2009). These readings contrast
with the northern river sites in this current survey, where Secchi depths were generally 10 cm or less
and where the least turbid site had a Secchi reading of only 49 cm. Turbidity can therefore be
expected to have had a major influence on sampling efficiency of electrofishing and potentially bait
traps. In clearer water fish may enter bait traps for cover, but in highly turbid waters there would be
little to attract fish into unbaited bait traps.
The SRA Pilot report (Murray-Darling Basin Commission 2004) stated the following: “because
electrofishing under-represented several rare (few individuals per site) and small (in length) fish
species, there is potential for improving representation of these fish at some sites by setting bait traps
for a short period. It is recommended to assess the results from setting ten bait traps for two hours at
each site in the first round of the full SRA.” However, it is clear from the results of this current report
that bait traps are ineffective in northern turbid rivers for detecting fish. As a group Carp gudgeon are
a widespread and abundant small fish species in the northern Basin (Moffatt and Voller 2002), yet this
was the only species detected by bait traps and detected at only three of the eleven trial sites for a
total of seven individuals. At site 66813 (the least turbid site) where ten bait traps captured just four
Carp gudgeons (the highest catch by bait traps at any of the 11 sites), thousands of individual Carp
gudgeons were captured by both day set and overnight set fykes.
An evaluation of fyke nets, Department of Agriculture and Fisheries, 2016 26Electrofishing captured far fewer Carp gudgeons than fykes and tended to catch mainly larger individuals. The Sustainable Rivers Audit (SRA) was the precursor to the current Murray-Darling Basin Fish survey. Fyke nets were trialled in the SRA pilot in the Condamine catchment, but not in the Paroo or Warrego catchments (Murray-Darling Basin Commission 2004). Fyke nets were also trialled in several more southern catchments. The fyke nets used in the SRA pilot were of the same dimensions as the fyke nets used in the current study; however, the mesh size used in the SRA pilot was 10 mm (Murray-Darling Basin Commission 2004) compared to 1 mm squares (or 2mm stretched diagonal) in the current study. Fyke nets were dropped from the SRA program after the pilot work. The use of coarser meshed fykes in the SRA pilot may have led to an underestimation of the effectiveness of fykes in detecting small fish assemblages like Carp gudgeons. Use of fine mesh fykes can clearly alter nativeness indices based on abundance. Use of just electrofishing and bait traps could lead to a large underestimation of the abundance of the Carp gudgeon species group in northern turbid rivers. The fine-mesh fyke nets used in this study were also effective at detecting a range of other species that were not detected by bait traps in the northern turbid rivers. Use of fyke nets in the current study increased the number of species detected at the majority of sites. In contrast, use of bait traps did not increase the number of species detected at any site. Although unbaited bait traps may be of some value in detecting additional species in more southern, less turbid rivers, there is no evidence for them adding anything of significance to catches in northern turbid rivers. Overnight set fykes captured significantly more species than day set fykes and detected additional species at more sites than day set fykes. Although the mean increase in number of species detected by addition of overnight set fykes was greater than the mean increase gained from use of day set fykes, the increase was not statistically significant at the 5% level. Day set fykes captured significantly more carp gudgeons than overnight set fykes, but both methods captured significantly more Carp gudgeons than electrofishing and bait traps. However overnight set fykes captured significantly more Golden perch and Hyrtl’s tandan than day set fykes Hyrtl’s tandan was a key species of interest in this study. This species is one of the target species for the Basin-wide environmental watering program (Murray-Darling Basin Authority 2014). This species was only detected by fyke nets across the eleven sites sampled in the current study. During the SRA pilot Hyrtl’s tandan were also captured in fyke nets. The related Porochilus rendahli (Rendahl’s tandan) was only captured by fyke nets and only at reference locations in the SRA pilot (Murray- Darling Basin Commission 2004). With its decision to drop fyke nets from the SRA, the Murray- Darling Basin Commission seems to have concluded that Hyrtl’s tandan was a rarer species just detected by chance, and it was just as likely it could be detected by electrofishing. This conclusion may have been reached because the pilot work was conducted in the Condamine River, where Hyrtl’s tandan is probably less abundant than in the Warrego or Paroo rivers. The current study shows clearly that Hyrtl’s tandan are detected at multiple sites by fykes, but remain undetected by electrofishing, even when detected in relatively high numbers by fykes (especially overnight set fykes). It should be noted that at two NSW sites on the Paroo, where fykes were not set in the 2015/16 round of MDB Fish Survey sampling, Hyrtl’s tandan were detected by electrofishing (one and two individuals respectively). It is likely that had fykes been set at those sites, much higher numbers of Hyrtl’s tandan would have been caught. Use of fykes will add statistical power to any evaluation of Hyrtl’s tandan populations. Also, since Hyrtl’s tandan is a medium sized species (Figure 10), the An evaluation of fyke nets, Department of Agriculture and Fisheries, 2016 27
You can also read